
Another Friday Moonshot Loading on the S&P

KR Opinion
Sorry for the inconvenience, Substack had an outage!
Another wild day in the markets, with a midday rumor that crashed prices only to be denied within minutes, triggering a full recovery in roughly fifteen minutes. This is once again the kind of fragile market we’re dealing with, and it’s a continuation of the headline-driven regime that has defined trading for weeks. The more interesting backdrop, which I keep hammering on, is that the chips were on fire today. Texas Instruments was up 20%, Intel skyrocketed, and industrials showed solid strength, all of which continues to support the idea that the market is broadening well beyond the mega-cap technology names. Those groups have really been in catch-up mode over the last several weeks, and even real estate is starting to gain traction despite all the negative news swirling around the sector.
One of the biggest stories trying to emerge today is the idea that the pipeline is about to go completely dry, with tankers stuck in the Persian Gulf unable to get out, meaning the so-called floating pipeline has basically emptied. Folks are talking about gas literally ceasing to flow in multiple countries across the planet, with projections of a massive 2 to 3% drop in global GDP, and the doom narratives go on and on. Meanwhile, the markets are making new highs, and none of this seems to be a concern by any means. People keep asking whether the market is ignoring the risk or whether, as always, a few voices in financial news find a way to push these horrific stories to the front, almost as if the talking heads want to keep people out of the market while it continues to grind higher.
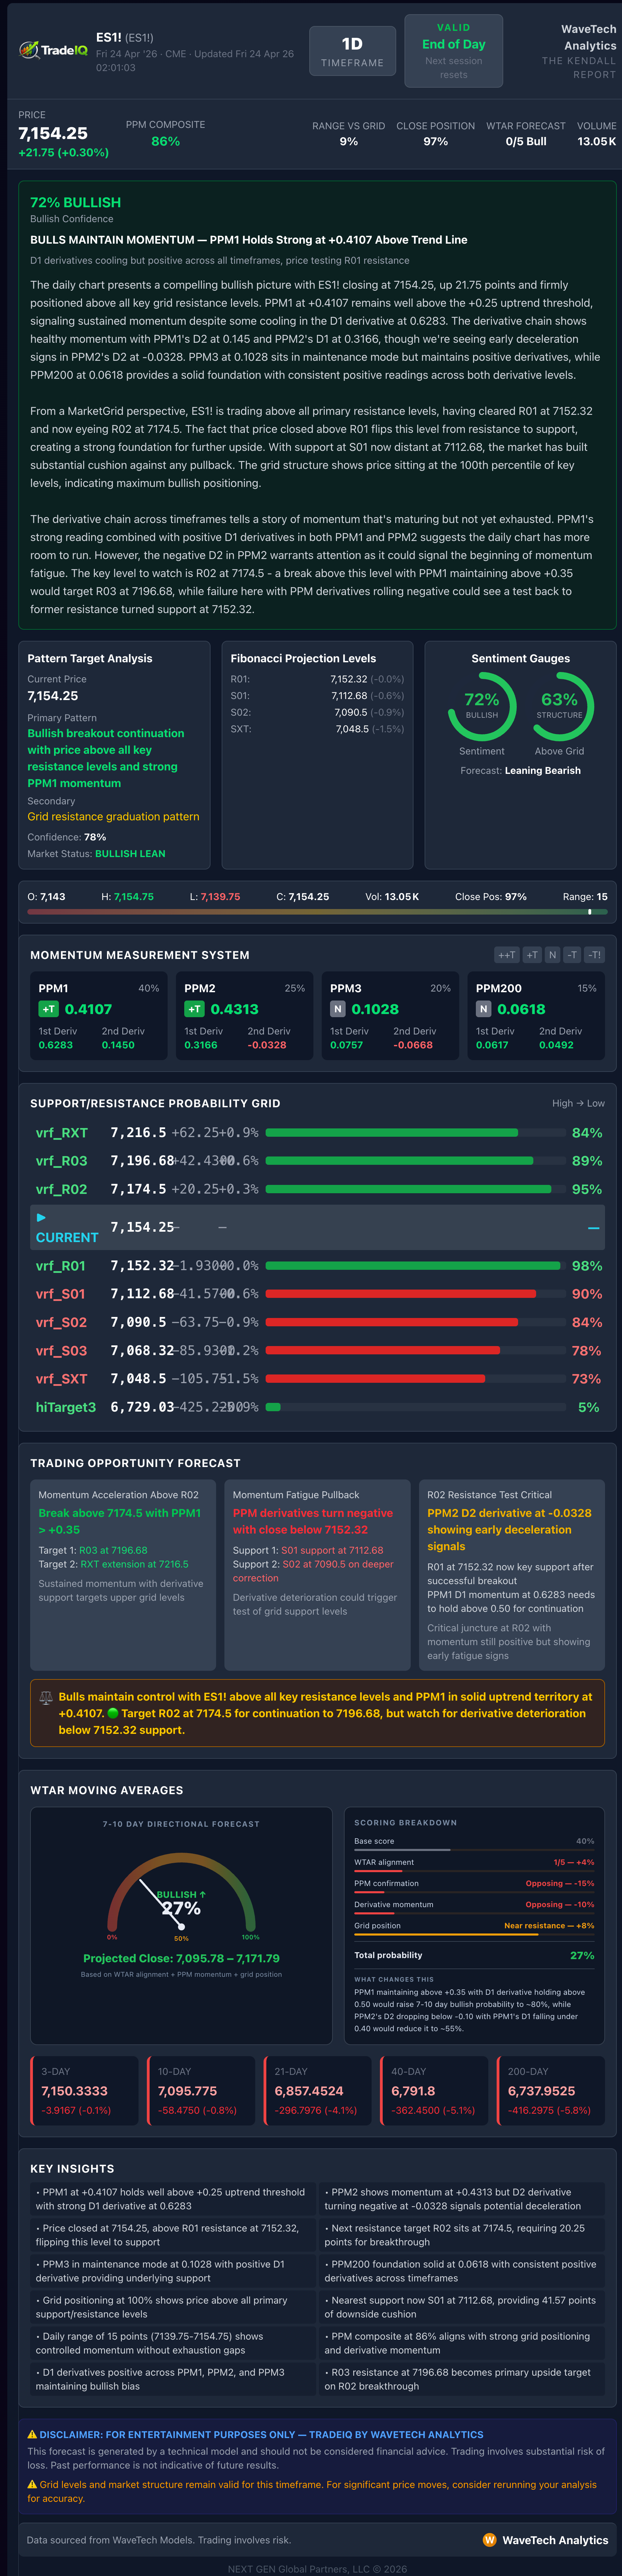
Over the past couple of Fridays, we’ve seen two or three sessions with massive moves higher. The configuration on the S&P and the NASDAQ suggests we’re setting up for another surge mode. Looking at the weekly Trade IQ sheets and the other data we track, everything has a decidedly bullish tone, especially after we picked up 5,600 buy signals in the database on Monday. As we come through the week and approach Friday’s close, we’ll see some interesting positioning configurations. My view is that if we close above the 7120 level on the S&P, we’re likely to see another large surge of buying come into the Wave Tech Database. I don’t expect a repeat of the 5,600-symbol print, but something in the range of 1,000 to 2,500 is very plausible, which would put us well into the upper end of expectations and keep the broader market firmly in bullish mode.
Against this backdrop of fears that parts of the planet are running out of oil, the market is not just shrugging it off; the reaction appears to be nonexistent. Theoretically and logically, that is exactly what’s happening, but I’ve heard claims that some regions are days away from running out of gasoline, that they may have to shut down refineries, and that Europe will have to start cutting back flights because they’re running out of jet fuel. The story keeps expanding, but the markets are not reacting to any of it. And the amount of buying it takes to generate 5,600 signals like we saw on Monday is not a trivial task; it requires an enormous amount of cash flow to produce those kinds of buys. If we get follow-through this week on the database, we’re likely to see further confirmation. Meanwhile, crude oil has moved back up toward the $97 level, and no one seems to care about that either.
It’s going to be interesting to see how this week ends, but it does feel like we could have another moonshot, which would suggest all-time highs above 7200 on the S&P 500 futures are within reach. There are no meaningful economic numbers coming out other than Michigan consumer sentiment, which I don’t think anyone has cared about for the last 25 years. So, as we close out the week, look for the bid to remain firm; unless something unexpected happens, we’re unlikely to see anything change.
Economic Reports
Apr 24
10:00 ET: Univ. of Michigan Consumer Sentiment - Final For: Apr | Trading Impact: Low | KR Forecast: 48.0 | KR Cons: 47.6 | Prior: 47.6
WaveTech Database
The WaveTech Database shows sectors at 66.67 percent long, groups at 60.78 percent, and symbols at 57.61 percent. All three tiers sit comfortably above the 42 percent sustainable-bias threshold, keeping the broader environment in upside mode rather than liquidation mode, though none of the tiers have yet entered the 62 percent full-investment zone. The hierarchy is worth noting. Sector-level conviction is running ahead of group and symbol readings, and that kind of top-down divergence often signals that the broader tape is leading while individual names are still catching up. If symbol-level participation continues to firm, there is a reasonable path toward the 62 to 68 percent range across the board. If it stalls here, the more probable near-term move is a drift back toward the 52 to 58 percent resistance shelf before the next decision point.
On the daily WaveTech models, the signals are split and worth watching closely. Daily 1.2a Long registered 38 new entries against 145 exits, a 0.26 ratio and a negative sentiment print, a clear sign that the faster timeframe is shedding positions and cooling off. Daily 3.2a Long tells a different story, with 305 new entries versus 269 exits, a 1.13 ratio, and a neutral sentiment reading, so the more deliberate daily model is still accumulating on balance. That divergence between the two daily engines often resolves in one of two ways, either the slower model follows the faster one lower if exits keep accelerating, or the heavy entry count on 3.2a absorbs the weakness and stabilizes the tape. For now, the weight of new activity on 3.2a argues for the latter, but the 1.2a exit pace is the number to monitor.
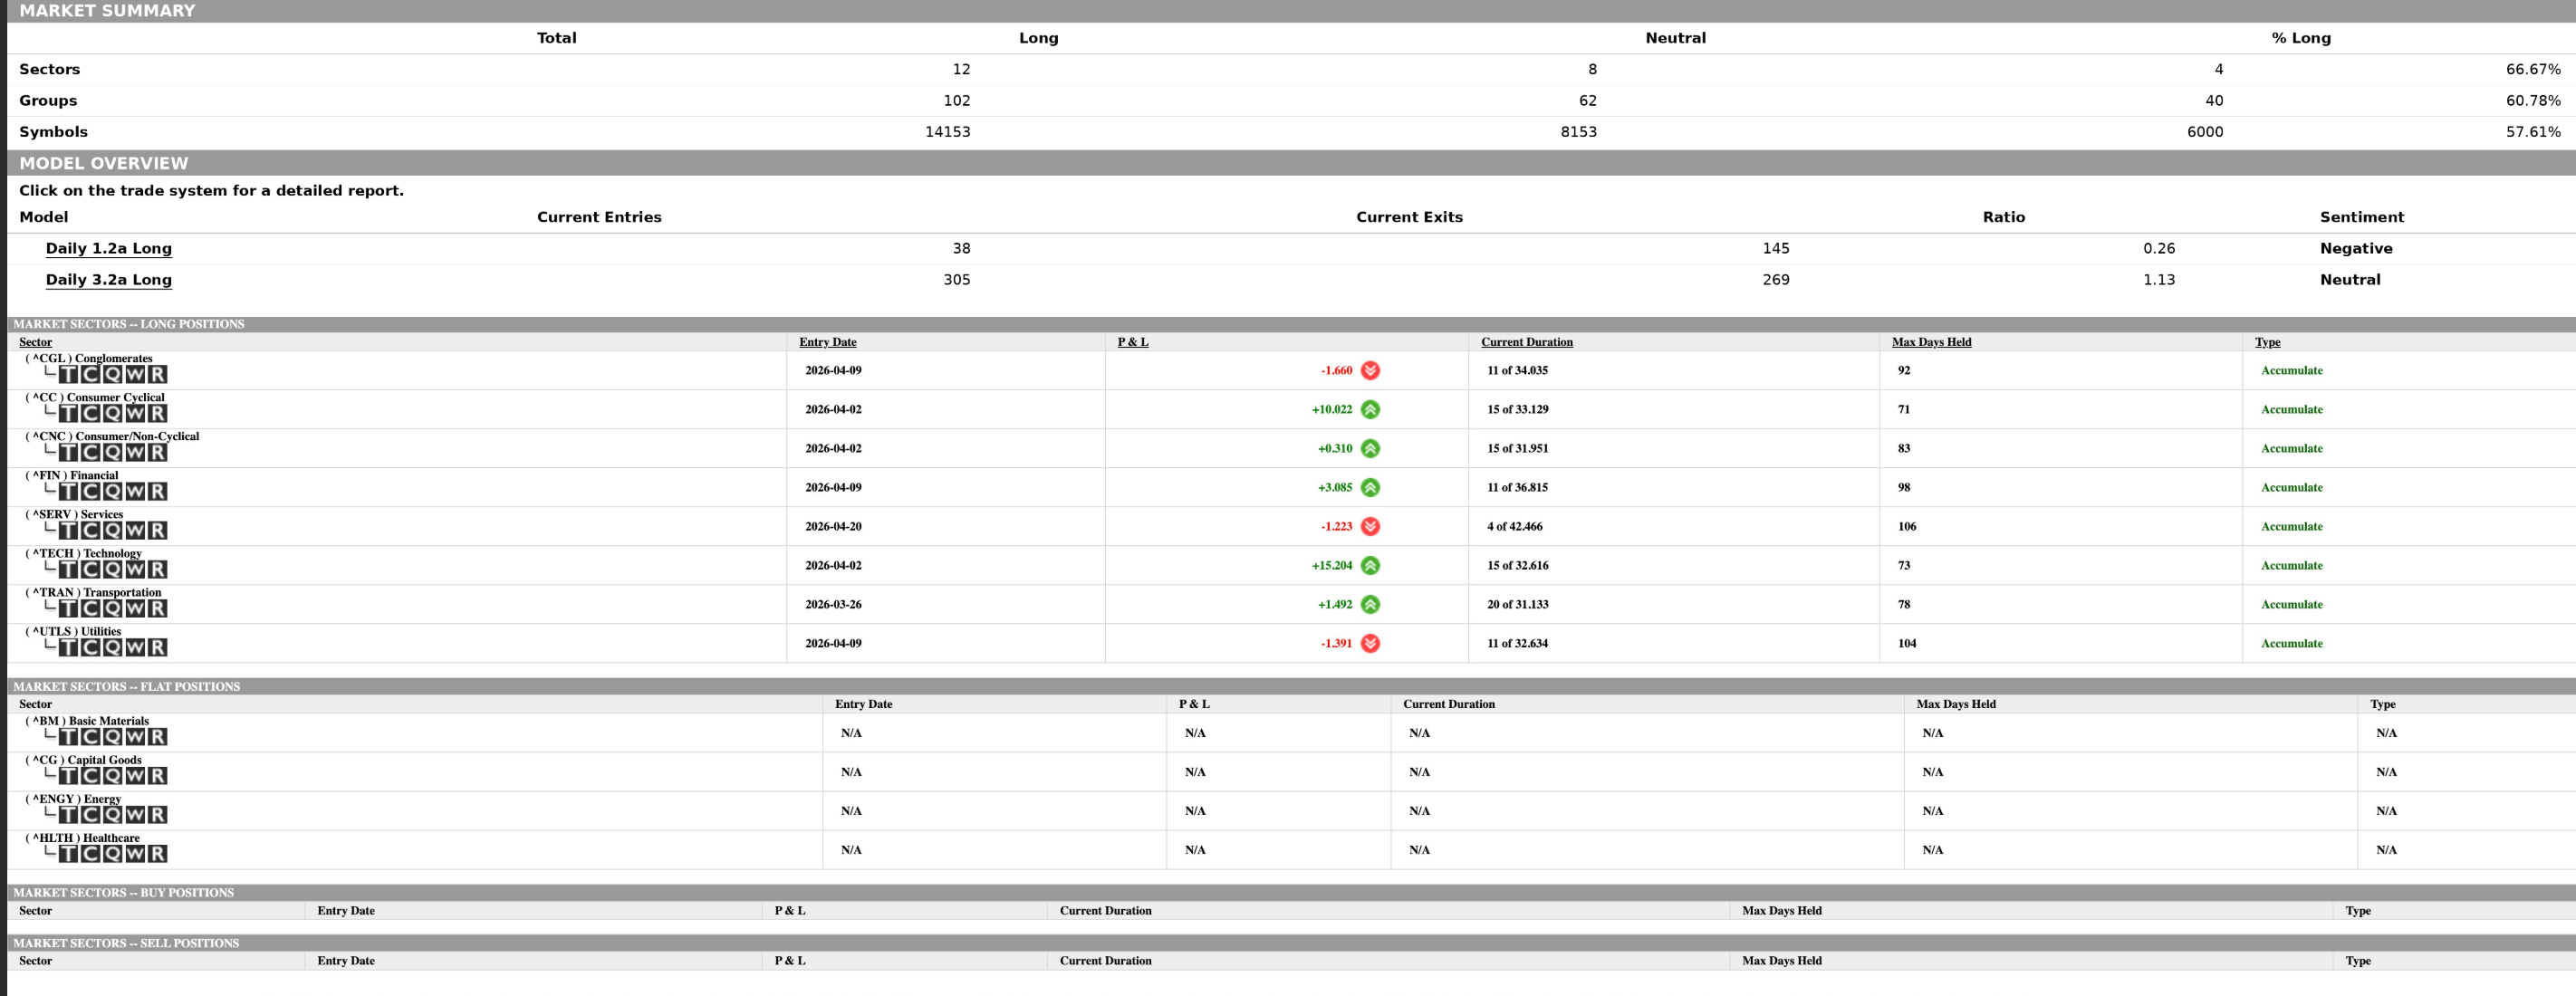
Eight sectors remain in active long positions, all carrying an Accumulate designation, and the maturity picture is starting to matter. Transportation is the oldest of the group at 20 of 31 cycle days, well past the 64 percent maturity threshold, while Consumer Cyclical, Consumer Non-Cyclical, and Technology are all at 15 of roughly 32 to 33 days, right at or just past that same maturity line. Technology continues to do the heavy lifting on performance at plus 15.20, with Consumer Cyclical at plus 10.02 close behind, while Services is the newest entry at only 4 days in and still finding its footing at minus 1.22.
The probability skew from here favors one of two outcomes. Either the mature positions, Transportation especially, begin rolling off and are replaced by fresh entries from the flat sectors like Basic Materials, Capital Goods, Energy, or Healthcare, or the database tightens and the percent-long readings drift toward that 52 to 58 percent resistance band as aging positions close out faster than new ones open. Watching how the flat sectors behave over the next few sessions will likely determine which of those paths the data takes.
S&P 500 Futures (ES), 1D Short-Term
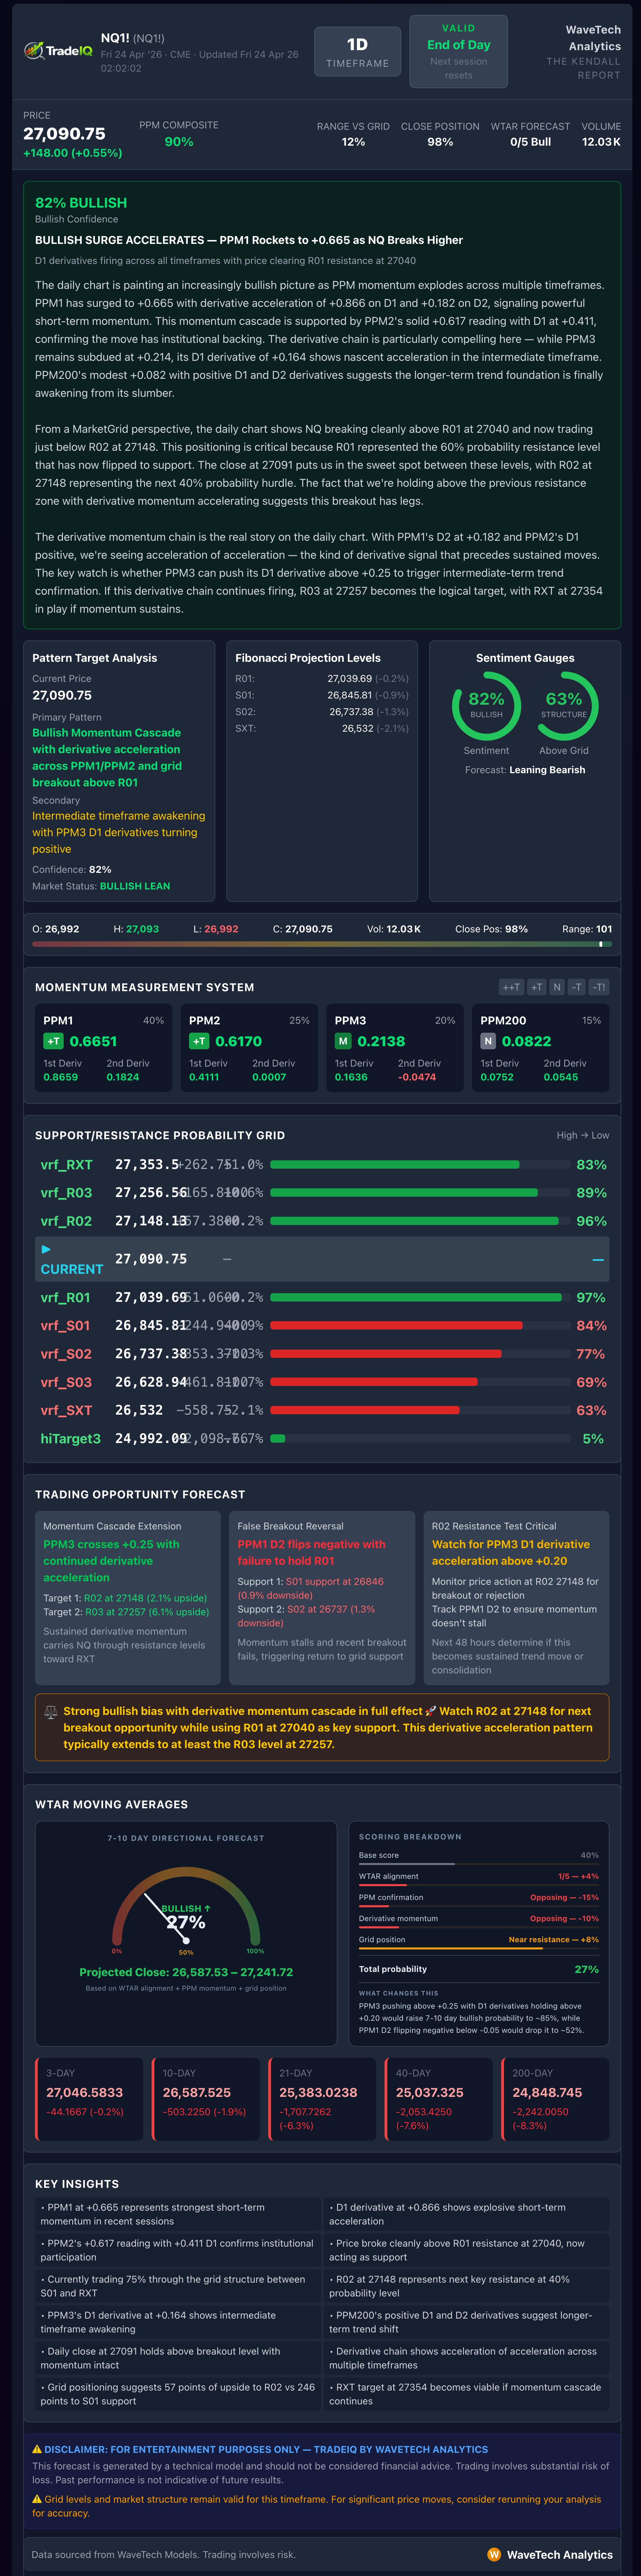
NASDAQ Futures (NQ), 1D Short-Term
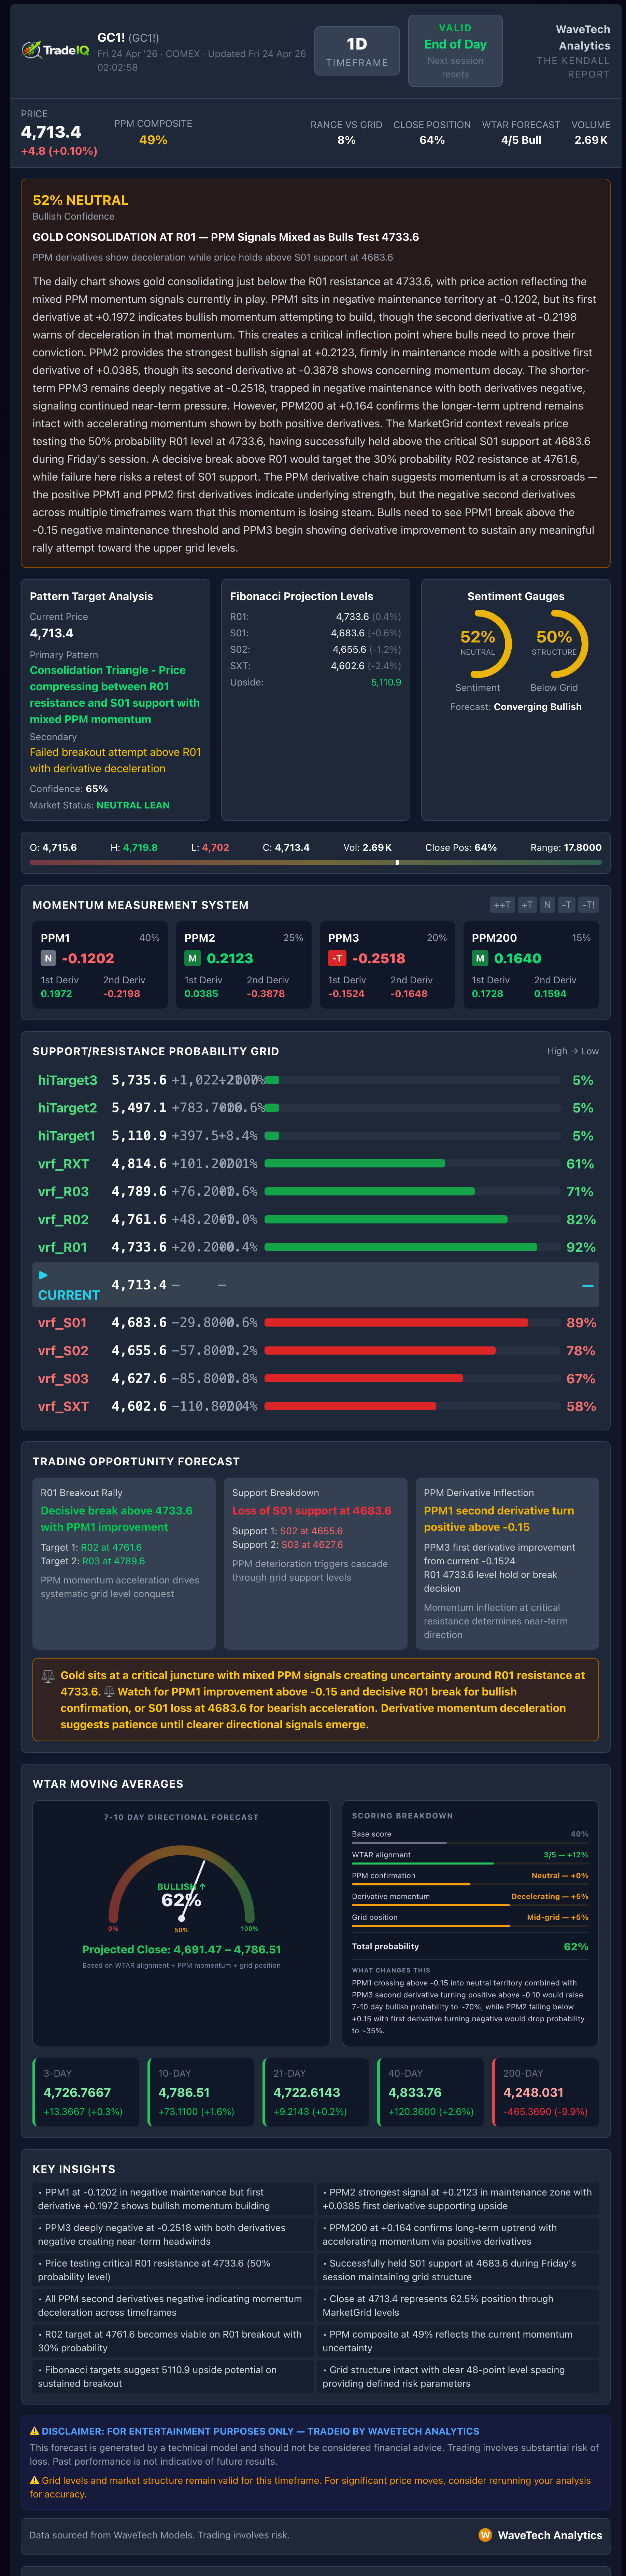
Gold Futures (GC), 1D Short-Term
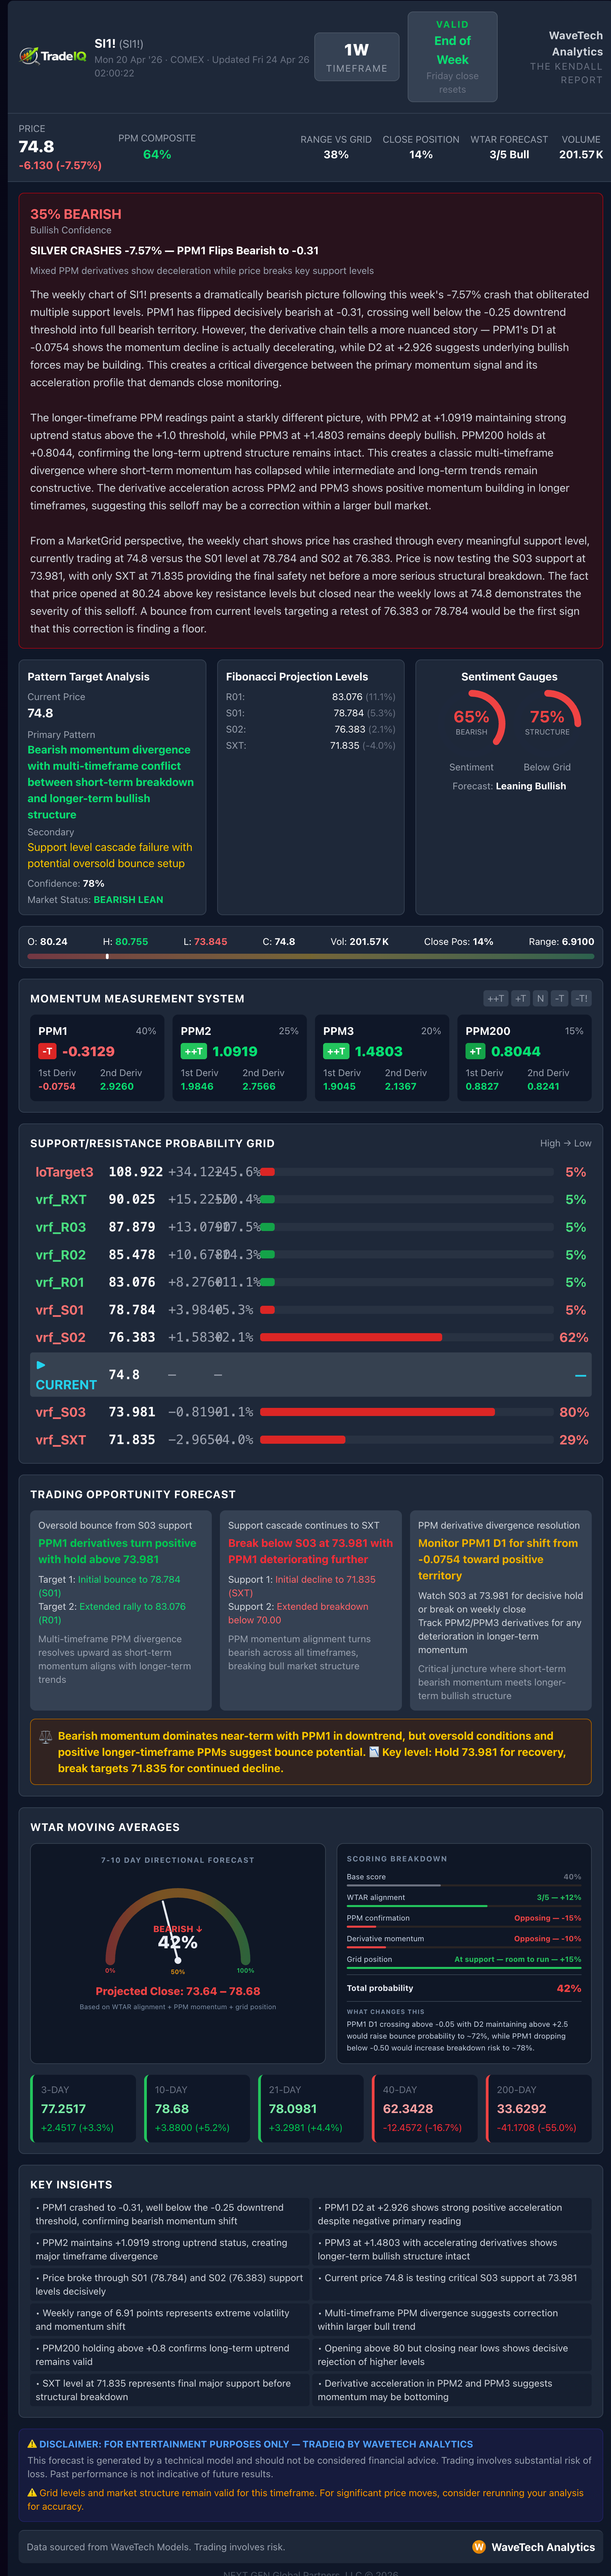
Silver Futures (SI), 1D Short-Term
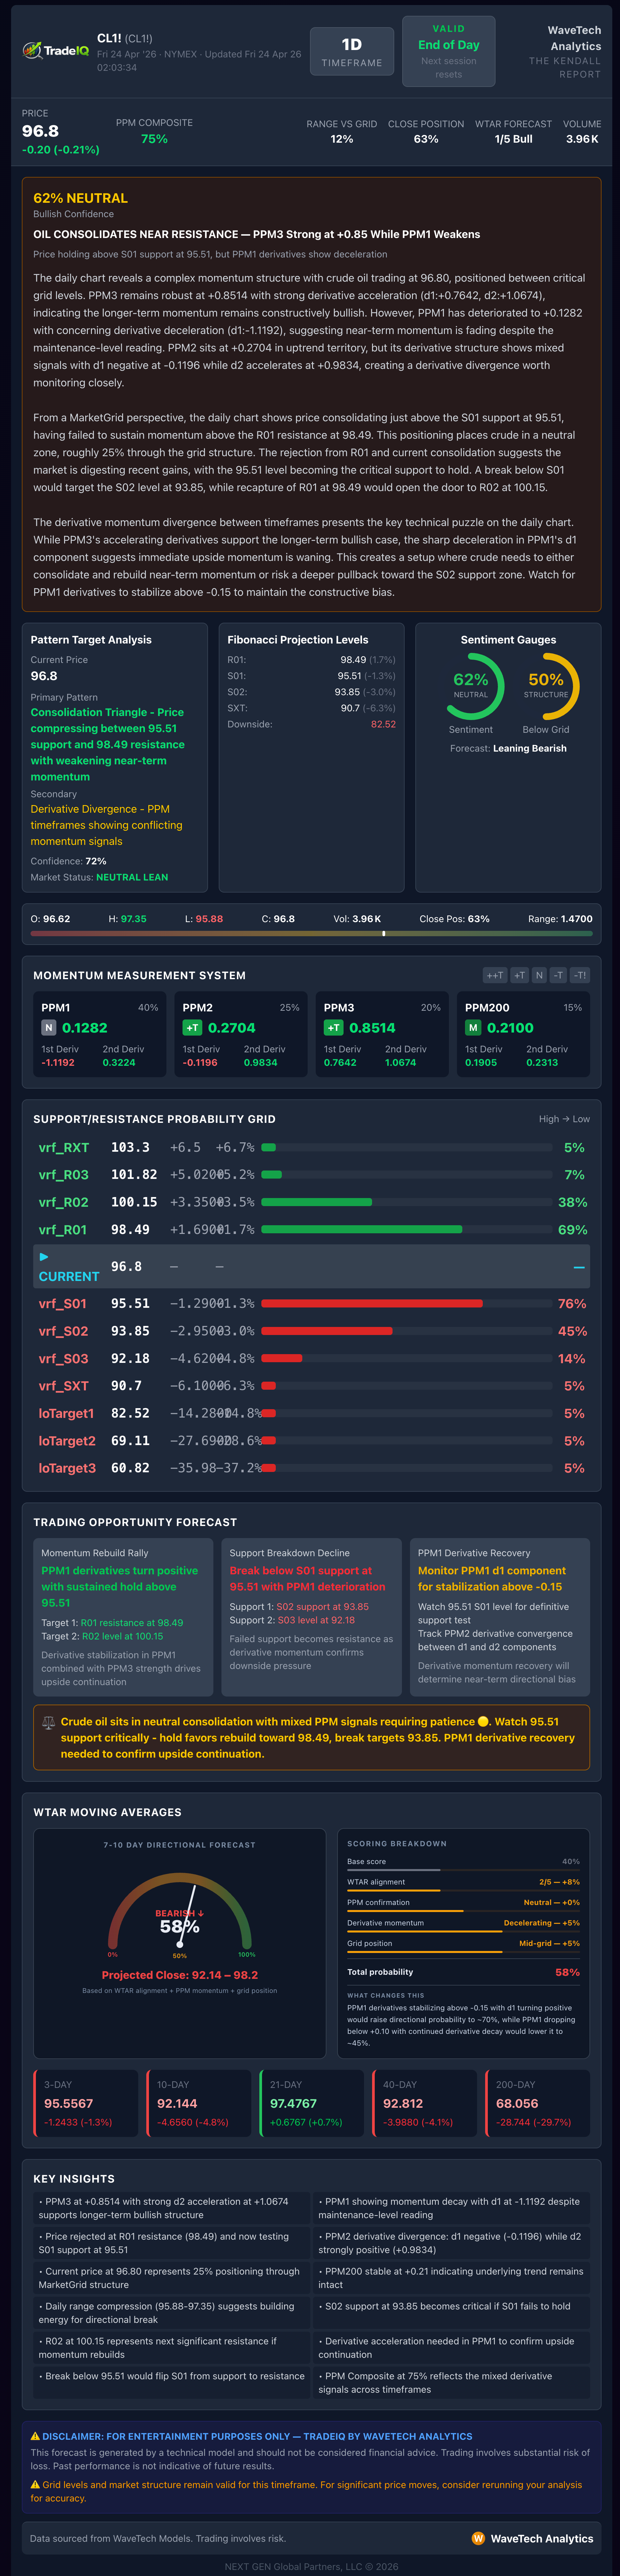
Crude Oil Futures (CL), 1D Short-Term
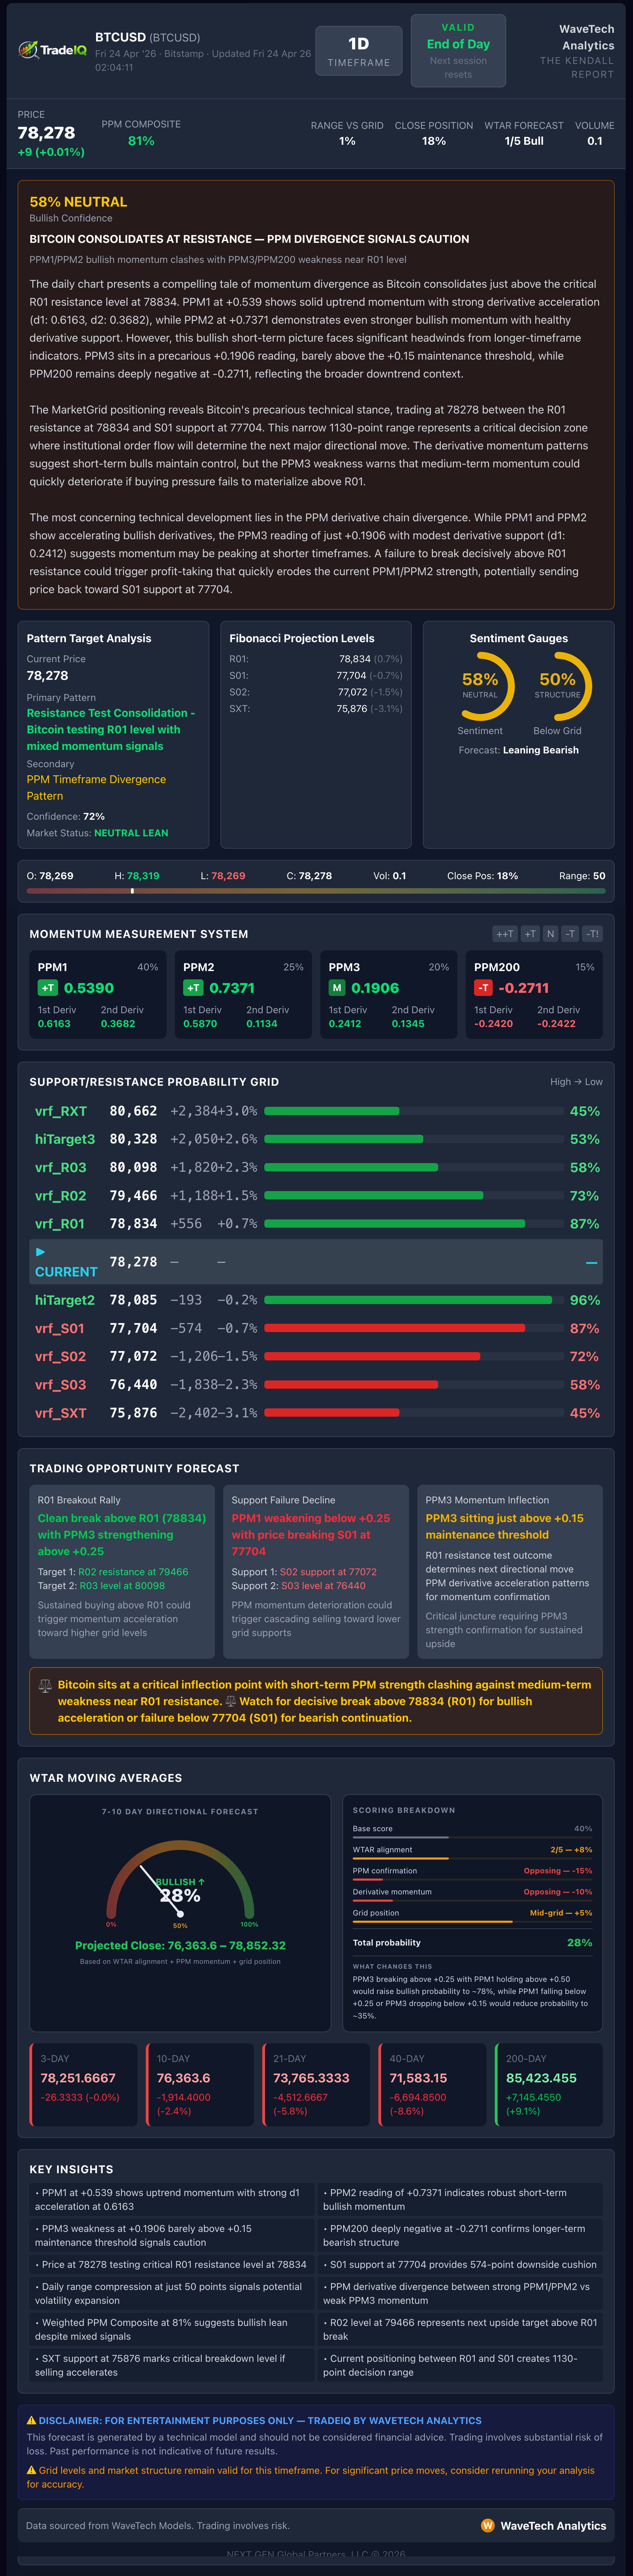
Bitcoin (BTCUSD), 1D Short-Term
Robert Kendall
Chief Analyst
“Disclaimer for “The Kendall Report
The information provided in “The Kendall Report” is for general informational and educational purposes only. The opinions, analyses, and forecasts included in this newsletter are based on the author’s personal views and experiences and are provided as is without warranty of any kind.
While we strive to provide accurate and up-to-date information, we do not guarantee the accuracy, completeness, reliability, or timeliness of any information contained in this newsletter. The information presented should not be construed as financial, investment, legal, or other professional advice. It does not constitute a recommendation or endorsement of any particular investment strategy, financial instrument, product, or service.
Investors should consider their financial situation, objectives, and risk tolerance before making investment decisions based on the information provided. The financial market is subject to high risk and volatility. Past performance is not indicative of future results. Investing in the financial market involves the risk of loss, including the loss of principal.
“The Kendall Report” and its contributors will not be liable for any direct, indirect, incidental, consequential, or exemplary damages arising from the use or inability to use the information provided in this newsletter, including but not limited to losses or missed gains.
By accessing and using “The Kendall Report,” you acknowledge and agree to this disclaimer and assume full responsibility for the use of the information provided. We reserve the right to make changes to the content of this newsletter at any time without notice.
This disclaimer is subject to change at our discretion, and it is the reader’s responsibility to review it regularly for any updates.