
Central Banks are Pumping!
Bitcoin to 73,500+?

KR Opinion
Reflecting on my comments in yesterday's report, I want to emphasize that the markets appear to be staying strong. We're not seeing the beginning of a significant decline after just one day's reversal. Instead, we're witnessing the continuation of this choppy sideways pattern I've been discussing for several weeks. We've hit new highs in the S&P and Dow Jones, though not yet in the NASDAQ. Still, the overall configuration remains extremely strong.
Overnight, I observed the markets dip about half a percent, but they've since rallied back and are now positive as we approach London's opening. This movement is partly due to the anticipated ECB rate drop and upcoming European CPI data. I've noticed that European traders often use S&P futures as a proxy due to their liquidity, which can influence overnight trading.
My expectations are for markets to remain resilient. I'm seeing several factors coming into play, with underlying trends still suggesting strong market positioning. One influence I have yet to discuss lately is the stimulus implemented in China several weeks ago. Even though Chinese markets have reversed slightly, there is a global sentiment that we're moving back towards a more accommodative environment.
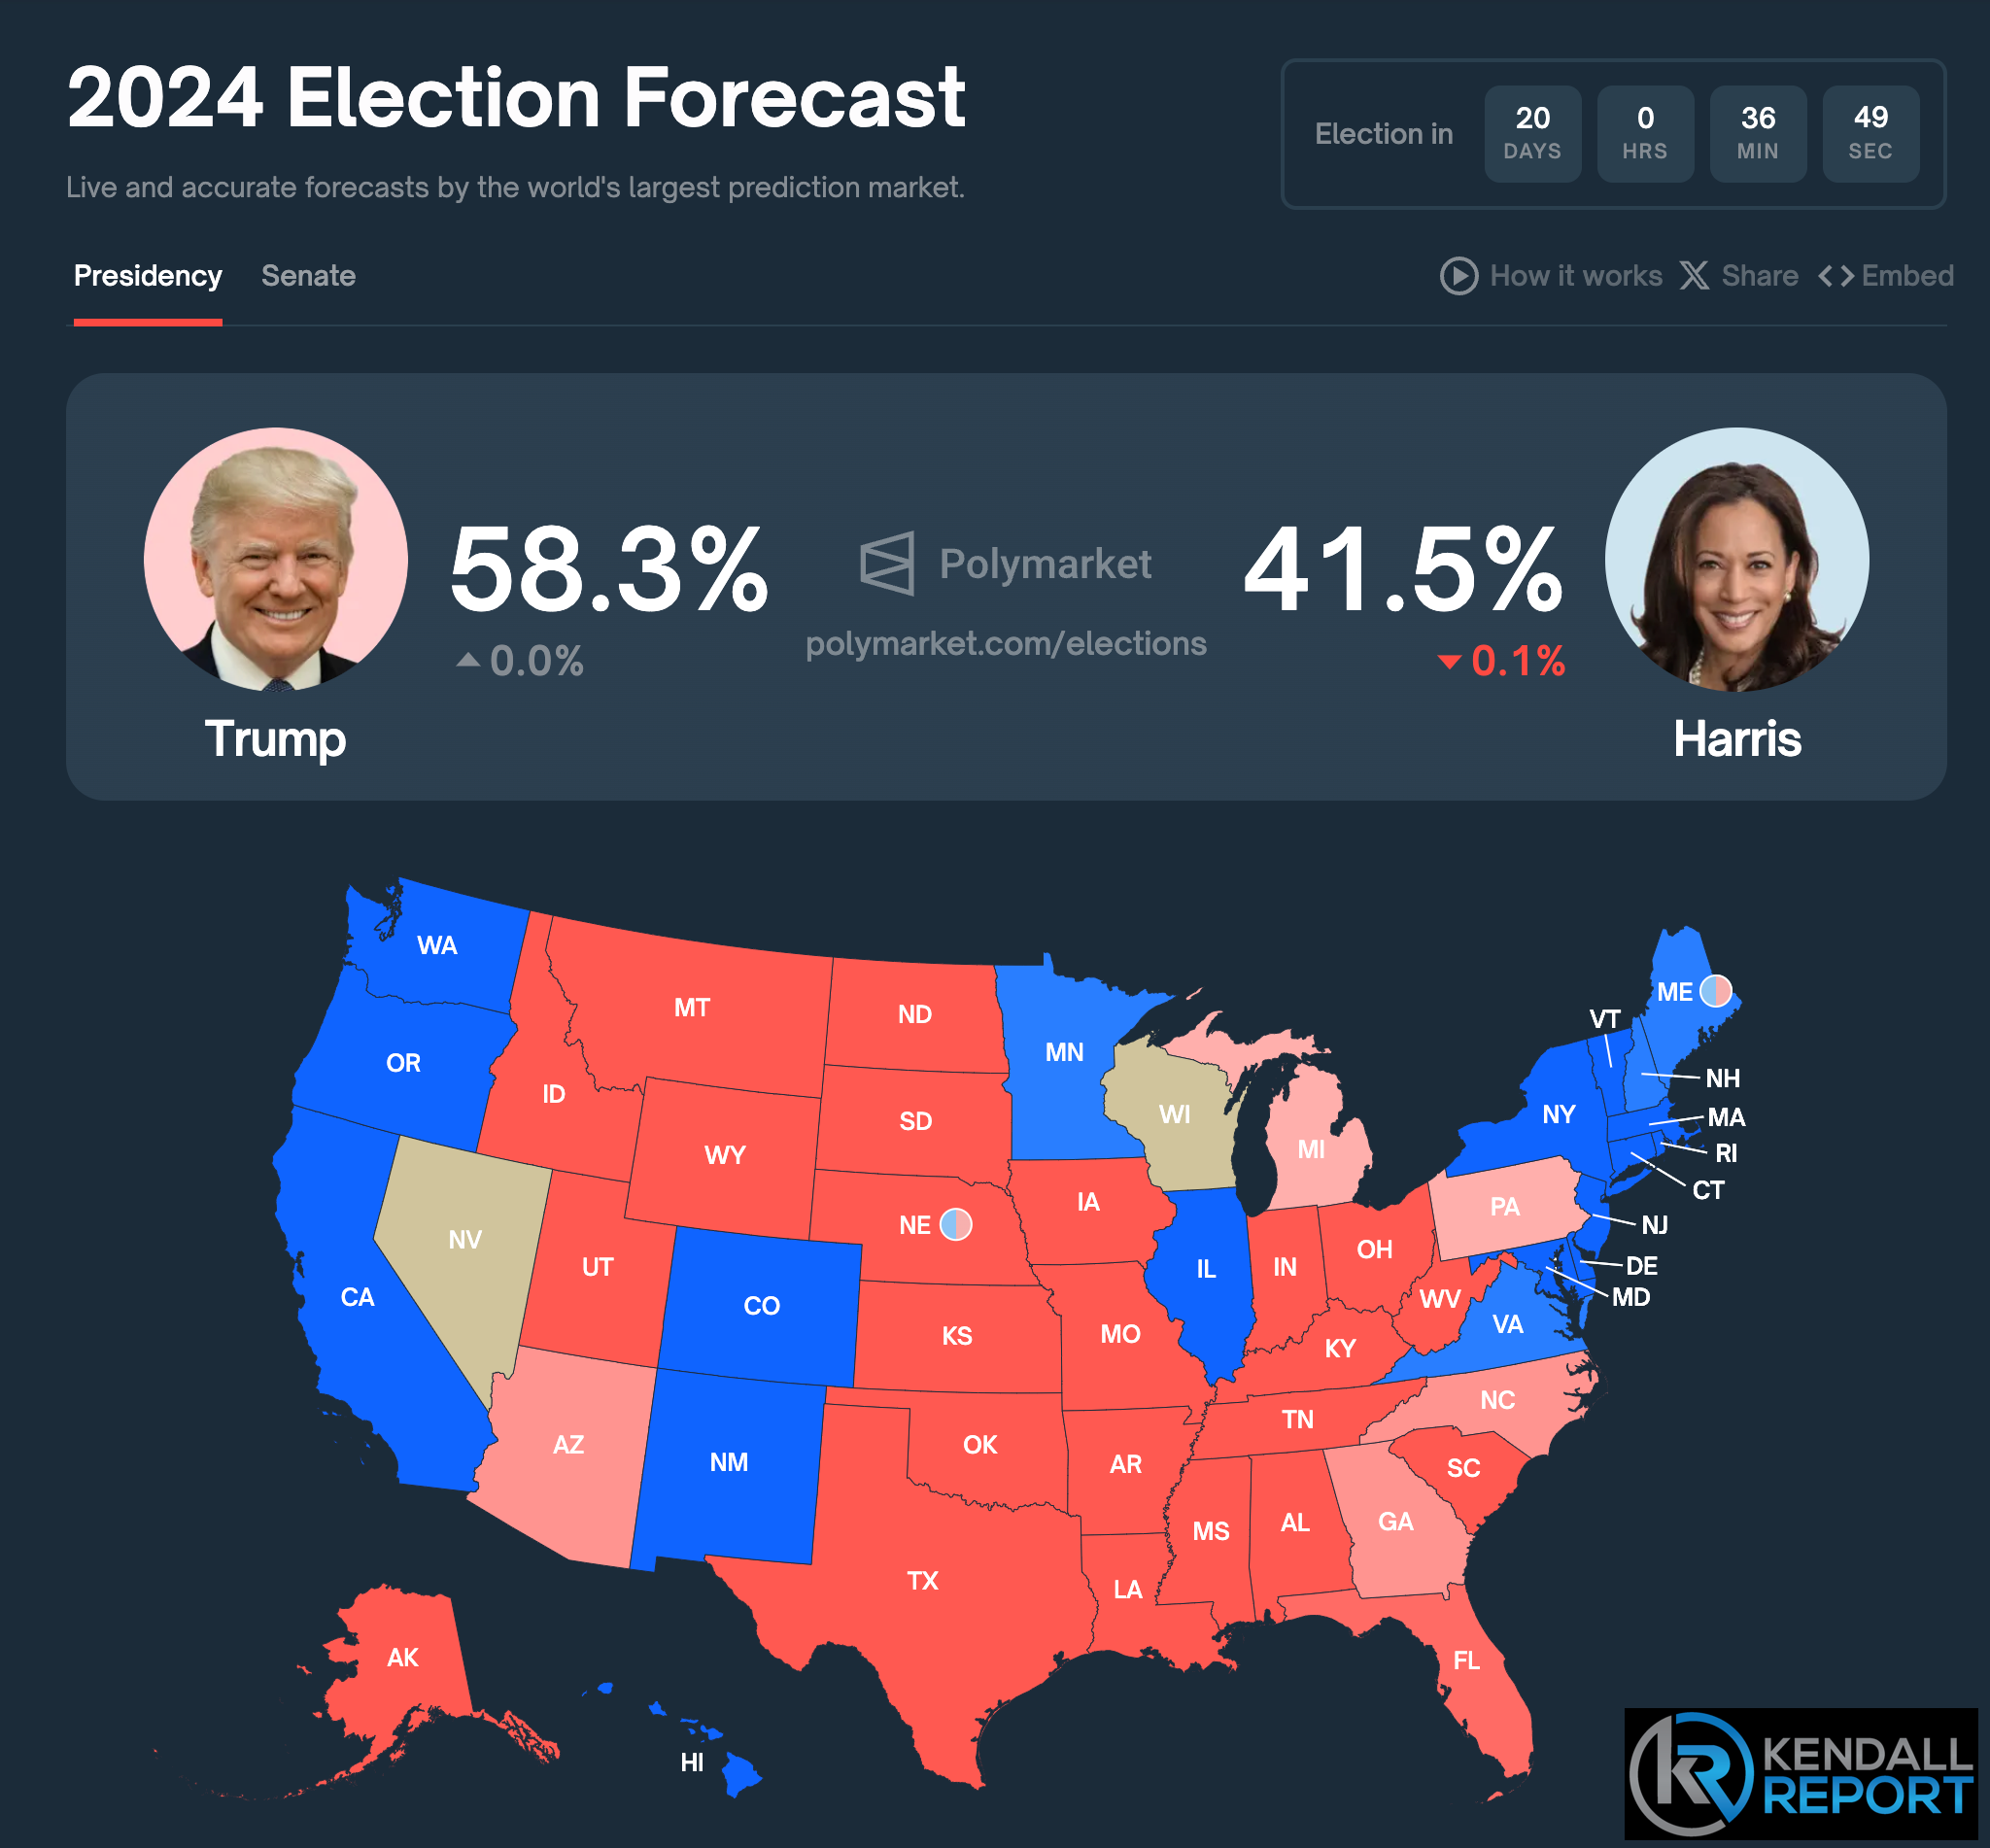
I wonder what else the markets are pricing in. We’re just 20 days from the U.S. election, and I'm seeing indications of a potential Trump win, along with solid leanings toward Republican control of both the Senate and House. It would be pretty remarkable if this scenario played out. The markets appear to be pricing in some form of optimism, though I'm not entirely sure if this is the driving factor.
From my analysis, the general trends are still upward. The database I'll review shortly reflects a very robust environment. As I've said before, it's nearly impossible to adopt a negative stance in this market right now, given the configuration from our database to the algorithms and the technical setups across a broad range of symbols.
I want to reiterate that 80% (or 8 out of 10) of symbols in our intermediate database are in trend mode. Nearly 15 thousand of them have a holding period of about 225 trading days and are about 60 percent complete. This suggests that the markets are in an amazingly robust configuration that doesn't appear to be slowing down.
However, I'm aware that these are the environments where you might see some rejection top when everything lines up so perfectly. Based on all of my analysis, I need to see evidence of that right now.
I'm keeping a close eye on the Russell 2000. From my perspective, we're seeing more traction there, with continued outperformance over multiple days. This has much to do with financials, particularly with banks, which are gaining significant traction.
I recall mentioning in a previous report that there's been some rhetoric on the street about potential problems with banks. You often hear people promoting ideas of banking crises and recessions, especially on Twitter and other platforms. But I've noticed there's not much talk about recession anymore. With the election just 20 days away, we'll likely see a continuation of current trends.
I'm pondering, and I invite you to consider, what exactly the market is pricing in. Is it anticipating a Trump win? Is that what we're seeing? I've included a Polymarket chart below to provide some food for thought.
In conclusion, while I see the market as strong and resilient, I believe it's crucial to remain vigilant and closely monitor these trends. The coming weeks, especially with the approaching election, could bring some exciting developments that may shape market direction.

Looking Back on Wednesday’s action
As I analyze Wednesday’s market action, I'm impressed by the broad-based strength we witnessed across various sectors and indices. The Russell 2000, representing smaller companies, continued its impressive run, surging 1.6% and bringing its weekly gain to a robust 2.5%. This outperformance by small-caps is particularly noteworthy, as it often signals increased risk appetite among investors.
The larger-cap indices also posted solid gains, with the S&P 500 rising 0.5%, the Nasdaq Composite adding 0.3%, and the Dow Jones Industrial Average climbing 0.8%. Significantly, these indices closed near their day's highs, typically seen as a bullish signal.
One key driver of today's positive momentum was the financial sector, which jumped 1.2%. Well-received earnings reports from several major players largely fueled this sector's strength. Morgan Stanley stood out with a remarkable 6.5% gain, while First Horizon and Synchrony Financial also posted impressive increases of 4.1% and 6.1%, respectively. The positive reaction to these earnings reports suggests that investors find comfort in these institutions' financial health and outlook.
Another interesting development was the rebound we saw in semiconductor-related names. This comes on the heels of yesterday's sharp sell-off in the sector. NVIDIA, a bellwether in the chip industry, bounced back with a 3.1% gain, while Broadcom added 0.5%. The Philadelphia Semiconductor Index (SOX) closed 0.2% higher, stabilizing this crucial tech subsector.
The breadth of the market's advance is particularly encouraging about today's session. Advancers outnumbered decliners by a significant 4-to-1 margin at the New York Stock Exchange. The Nasdaq saw a similar trend, with a nearly 3-to-1 ratio in favor of advancing stocks. This widespread participation in the rally suggests a healthy market environment where gains are not confined to just a few large-cap names.
Further underscoring the broad nature of today's rally, the equal-weighted S&P 500 index rose 0.7%. This outperformance relative to the cap-weighted S&P 500 indicates that the average stock in the index performed even better than the headline number suggests.
In the bond market, we saw a modest decline in yields, with the 10-year Treasury yield dropping two basis points to 4.02% and the 2-year yield edging down one basis point to 3.94%. This slight easing in yields may have contributed to the positive sentiment in equities, as lower bond yields generally make stocks more attractive on a relative basis.
Steel Dynamics showed particular strength following its Q3 results and upbeat commentary. While specific details weren't provided in the summary, the positive reaction to a company in the materials sector is worth noting, as it could signal optimism about industrial demand and economic growth.
This positive momentum could set the stage for further gains, particularly if we continue to see encouraging earnings reports and economic data. However, it's important to remember that markets can be volatile, and investors should always be prepared for potential shifts in sentiment.
Small-caps' outperformance and the broad-based nature of today's rally are particularly encouraging signs. If this trend continues, it could indicate a healthy rotation in the market and potentially signal a new leg up in the current bull market.
Nasdaq Composite: +22.4% YTD
S&P 500: +22.5% YTD
S&P Midcap 400: +14.8% YTD
Dow Jones Industrial Average: +14.3% YTD
Russell 2000: +12.8% YTD
Economic Releases for Wednesday
The Releases showed some interesting trends. The Weekly MBA Mortgage Applications Index took a significant hit, dropping 17.0% after the previous week's 5.1% decline. This sharp downturn in mortgage applications could signal some cooling in the housing market.
September's Import Prices decreased by 0.4%, a revision from the previously reported 0.8% increase. Excluding oil, Import Prices increased slightly by 0.1%, which was an upward revision from the initial -0.1% figure. On the export side, prices fell by 0.7% in September, with the previous month's data revised to show a steeper 0.9% decline. Excluding agricultural products, export prices dropped by 0.9%, more than the revised 0.7% decrease from the previous month.
Looking ahead to Thursday's releases
We've got a packed schedule of economic releases. The day kicks off at 8:30 ET with Initial and Continuing Jobless Claims. The KR Forecast consensus for Initial Claims is 270K, up from the prior week's 258 K. We'll also get September's Retail Sales figures, with expectations of a modest 0.2% increase overall and a 0.1% rise excluding auto sales. The October Philadelphia Fed Index is also due, with the KR Forecast consensus pointing to an improvement to 4.0 from the previous 1.7.
At 9:15 ET, we'll see September's Industrial Production data, which is expected to show a slight contraction of 0.1% after August's 0.8% growth. Capacity Utilization is anticipated to edge down to 77.9% from 78.0%.
The 10:00 ET hour brings us August Business Inventories, which is forecast to grow by 0.3%, and the October NAHB Housing Market Index, expected to tick up to 43 from 41.
10:30 ET for the EIA Natural Gas Inventories and at 11:00 ET for the EIA Crude Oil Inventories. Last week saw a build of 82 bcf in natural gas stocks and a 5.81M barrel increase in crude oil inventories.
Finally, at 16:00 ET, we'll examine August's Net Long-Term TIC Flows, which previously stood at $135.4B.
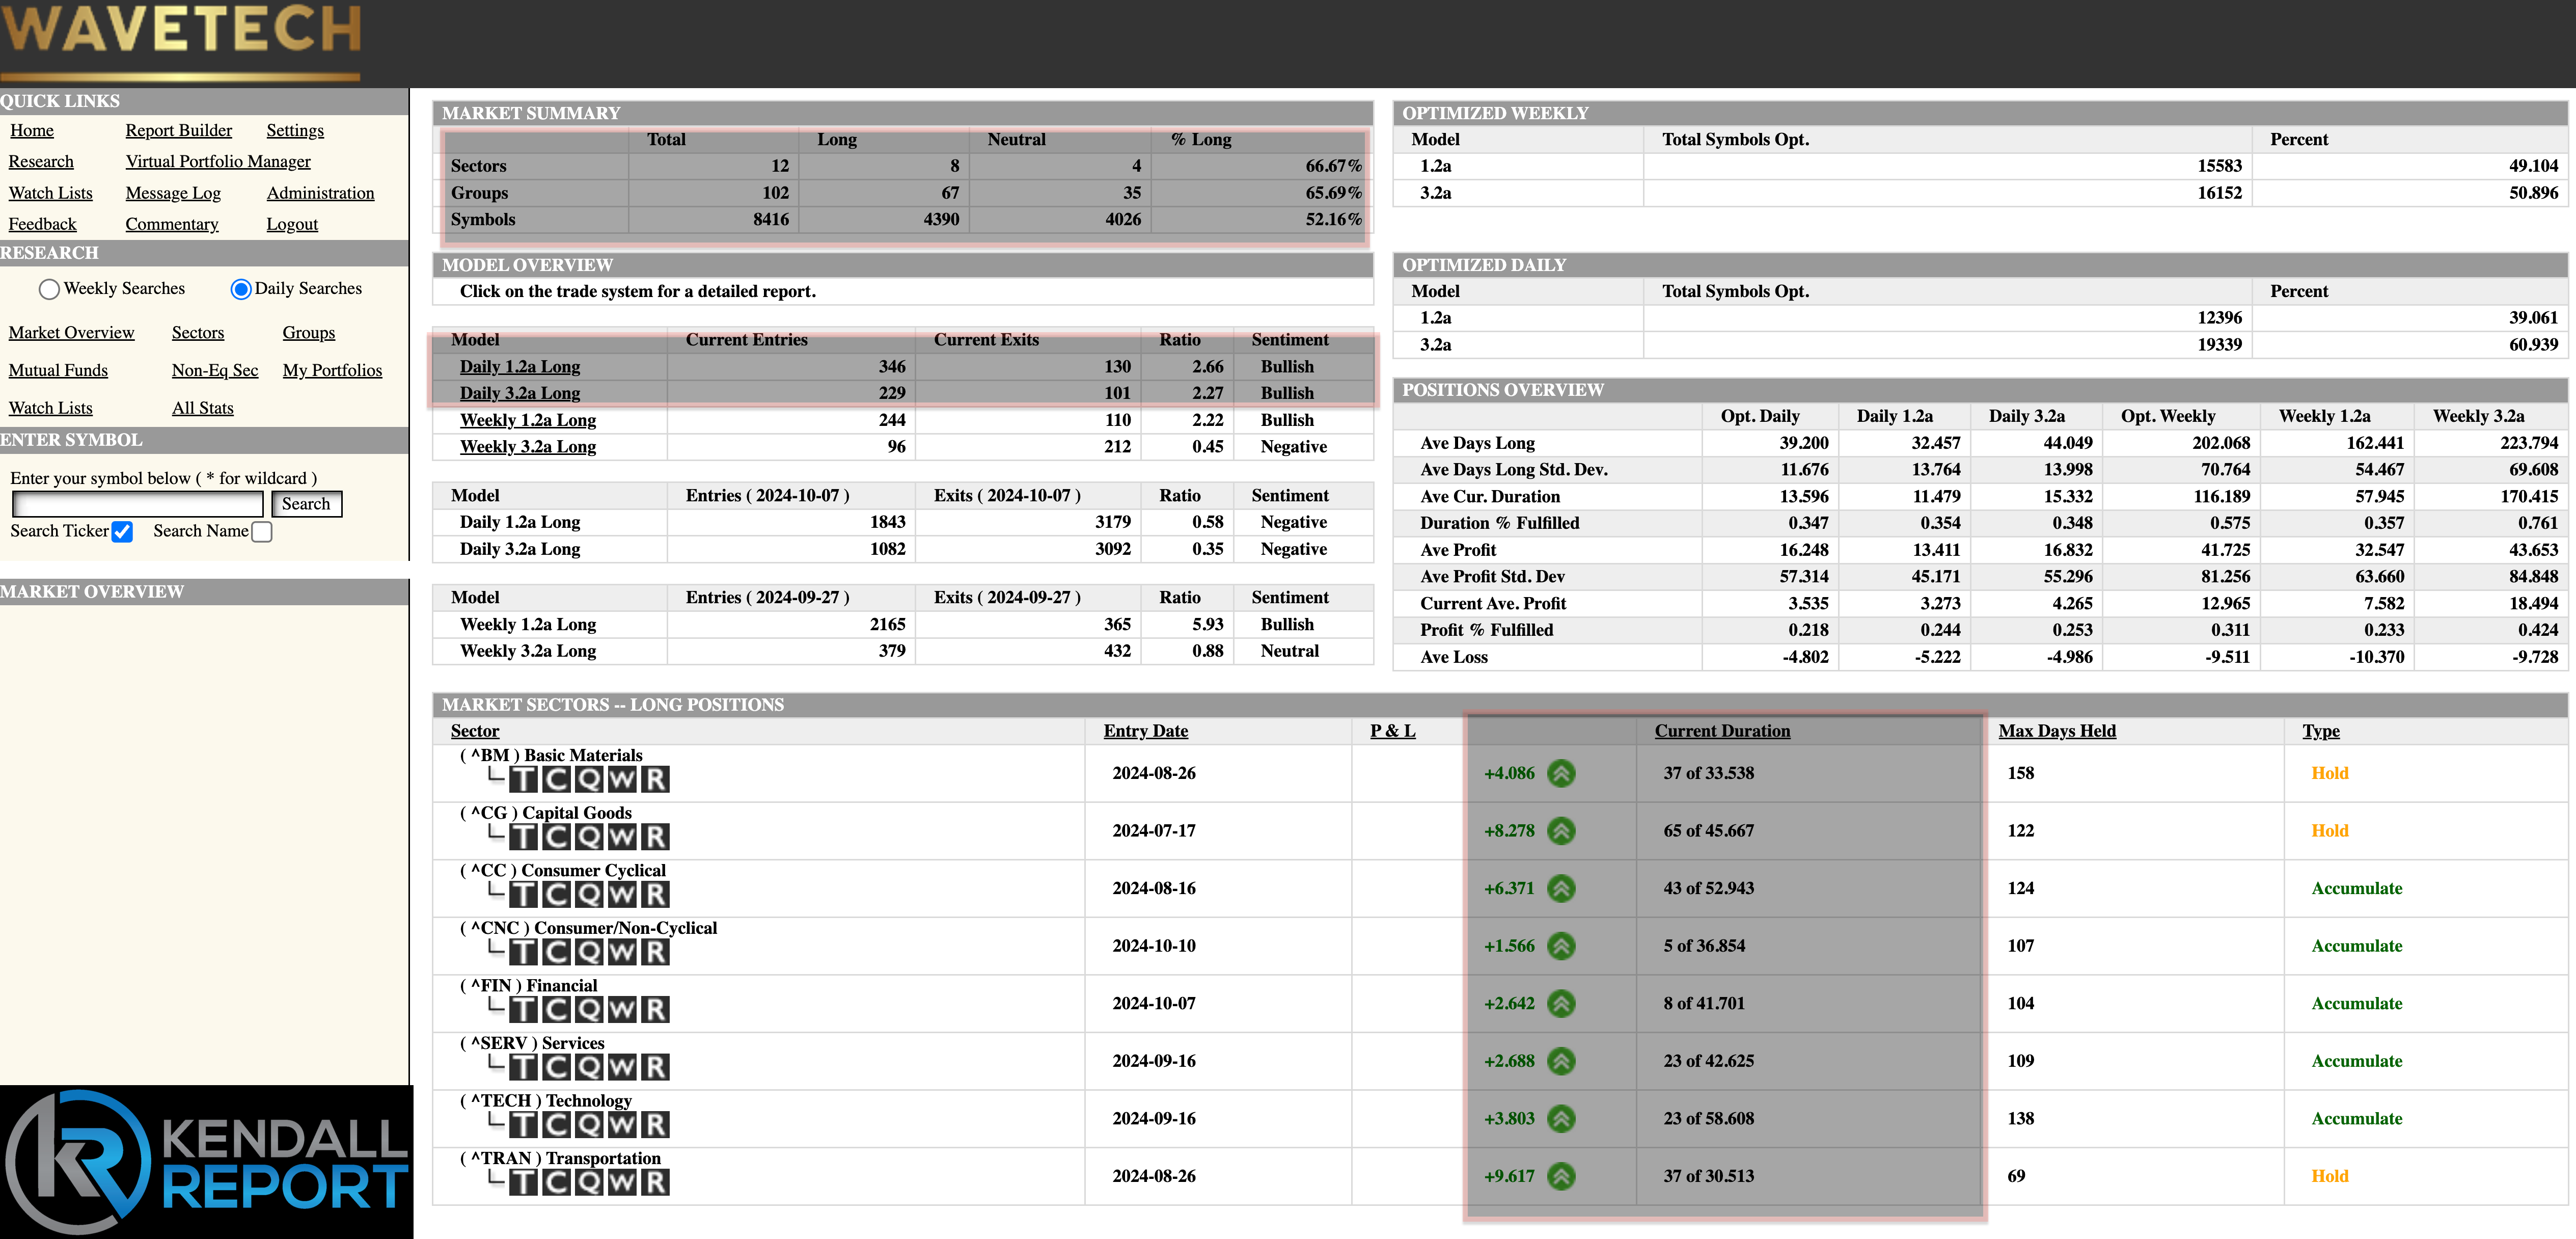
WaveTech Database
We're seeing a narrowing on a sector basis, which is worth paying attention to. Currently, we're down to 8 long sectors. While they're all positive at the moment, there are three sectors that I'm keeping a particularly close eye on: capital goods, basic materials, and transportation. This suggests we could see further attrition on a sector basis, a point I touched on in yesterday's report.
Looking at the overnight data for Thursday's opening, we have 575 new entries and 231 exits. The bullish percent now stands at 52.16%. This tells me the short-term database stabilizes just above the 48% level. As I've mentioned before, the critical levels to watch going forward will be 48% and 42%. The latter is particularly crucial, indicating further liquidation if breached.
Despite this, the overall sentiment remains quite bullish. We're continuing to see the rotation that's been a market characteristic this year. This pattern involves peak values on the short-term database pulling back into the mid-range and then rotating back into traction. In the last eight months, we've only seen one instance of more material liquidation, which didn't translate into exits on the intermediate database.
This rotation is a crucial feature of the current market dynamics. It's not unusual to see sectors and stocks move in and out of favor as investors adjust their positions based on various factors such as economic data, earnings reports, and broader market sentiment. The fact that we're seeing this rotation continue suggests a certain level of health in the market, as it indicates that investors are actively reallocating rather than broadly selling off.
The resilience of the intermediate database, even in the face of short-term fluctuations, is particularly noteworthy. It suggests that longer-term trends remain intact, which can be a positive sign for overall market stability. However, it's important to remember that past patterns don't guarantee future performance, and we need to remain vigilant for any signs of change.
In tomorrow night's report, I plan to discuss the intermediate database in more detail and share my expectations as we head into Friday. This longer-term perspective will provide valuable context for understanding the market's direction.
Four sectors are flat: conglomerates, energy, health care, and utilities. This flatness could indicate a period of consolidation or uncertainty in these sectors. Interestingly, these sectors often represent more defensive or stable market areas. Their flatness might suggest that investors must be more strongly bullish and bold on these areas, possibly waiting for more clarity on economic conditions or policy directions.
Given the volatility in oil prices, the energy sector's flatness is particularly intriguing. This could indicate that investors are balancing concerns about global economic growth (which could dampen energy demand) against geopolitical tensions that could disrupt supply.
Healthcare and utilities, being more defensive sectors, often attract investor interest during market uncertainty. Their current flat status suggests that investors are not yet fleeing to these traditional safe havens, which is a positive sign for overall market sentiment.
As for conglomerates, their diverse business models can sometimes make them less reactive to specific market trends, which might explain their current flat status.
In conclusion, while we're seeing some narrowing and potential for attrition in certain sectors, the overall market structure remains bullish. The ongoing rotation and the resilience of our intermediate database are positive signs. However, we'll need to closely monitor those critical levels in our short-term database and the performance of those flat sectors for any signs of shifting market dynamics. I'll provide a more detailed analysis of the intermediate database and my Friday expectations in tomorrow night's report.
S&P 500 Futures
