
Clear Sailing Through April:
Capacity Utilization Just Hit Levels That Would Have Crashed Old Economies

KR Opinion
This promises to be an interesting week for markets as we analyze the aftermath of last week’s Federal Open Market Committee meeting and focus on a series of economic data that will close out an already remarkable year. The Fed delivered exactly what we expected, with no real surprises from their policy decision, though the market response right after showed the kind of volatility we have become used to around these events. The reaction was more noise than signal, and as the dust settles, we find ourselves approaching the final meaningful trading week of the year with a clear sense of direction despite the surface turbulence.
The main event this week will definitely be the non-farm payrolls report, which consensus expectations suggest will be nearly unchanged. The unemployment rate continues its steady decline toward 4.5 percent, and projections from my database indicate this trend could continue. Looking at the chart below, you can see the path these models predict over the next year or so, with unemployment possibly rising above 4.5 percent and possibly nearing 5 percent at the highest point.
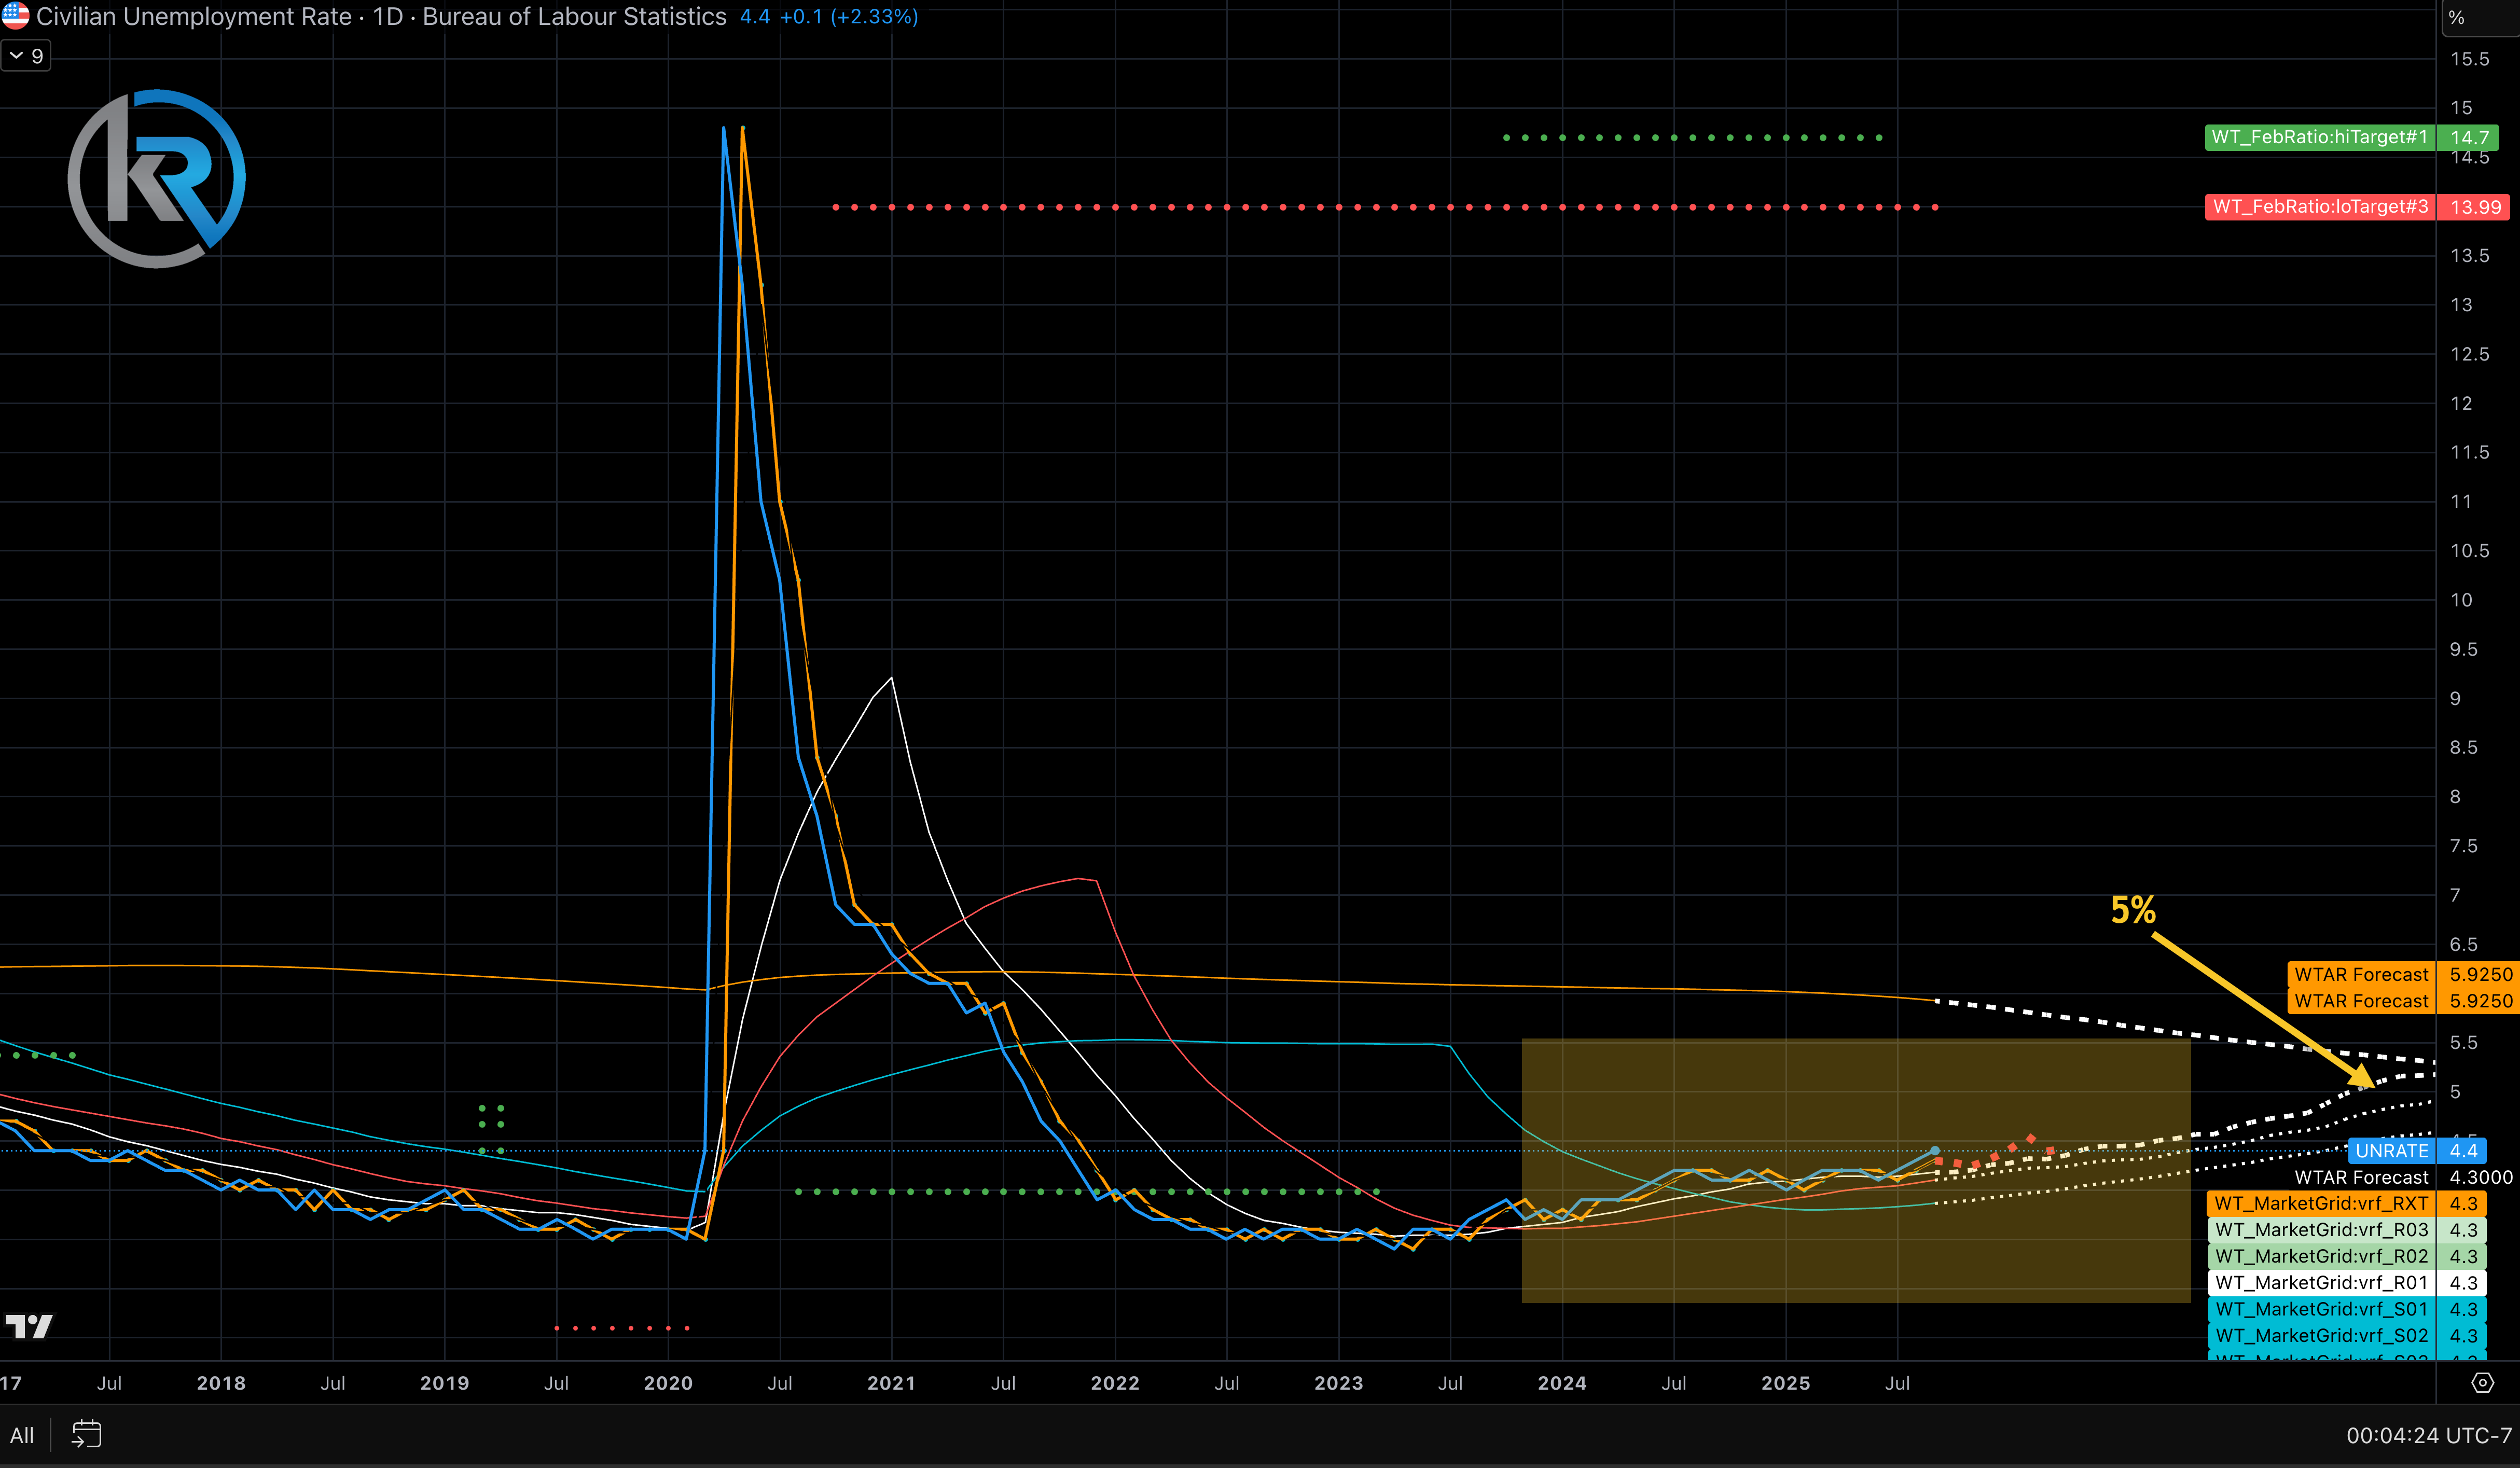
I want to clarify that I don’t see this as a disastrous development or a sign of economic trouble. Much of this shift could be due to structural changes in the labor market as artificial intelligence and automation reshape employment patterns across sectors. We are in the early stages of a transition where some jobs are being displaced, while new opportunities are opening up elsewhere in the economy. It’s too soon to make firm conclusions about these trends, but we should keep in mind that we might be seeing the first signs of a broader change in how work is done as we interpret the monthly employment data.
Beyond payrolls, this week presents a busy lineup of economic releases that will give markets plenty to analyze. We will see manufacturing data, retail figures, and mortgage applications, among other reports, offering a detailed view of economic activity as the year ends. Each of these data points presents an opportunity for markets to either support the current narrative or introduce new challenges for traders to consider.
Reflecting on last week’s Fed meeting, the most notable aspect of their communication was the ongoing bifurcation in their messaging. This intentional ambiguity is designed to keep markets somewhat uncertain about the exact path forward, which seems to be by design. The Federal Reserve has realized that maintaining flexibility in its guidance gives it more room to respond to changing conditions without being constrained by previous commitments. For market participants, this means they must continue to analyze not only policy decisions but also the subtle changes in language and emphasis that could signal future intentions. Despite this communication uncertainty, the forward-looking projections in the Fed’s materials indicate that the economy is expected to perform reasonably well, providing an essential baseline for interpreting any short-term softness we might see in the data.
One metric that warrants special attention this week is capacity utilization, which has been approaching seventy-eight percent. This marks a significant departure from historical patterns that many investors may not fully realize. In the early nineteen-eighties and even through the nineties, capacity utilization usually topped out at around seventy-two percent, peaking well below where we are now. The fact that current readings are much closer to 80% indicates fundamental changes in the economy’s efficiency. I anticipate this trend will continue and possibly accelerate as artificial intelligence and automation promote further efficiency gains across manufacturing and other capacity-heavy sectors. The economy can now operate at higher utilization rates than in previous decades without triggering the inflationary pressures that accompanied such utilization rates previously.
The maturity analysis I conducted on my database, looking ahead, shows a very positive outlook. The signals indicate smooth progress through April and into the end of June. Of course, we will need to keep an eye on how the data changes as we move into twenty-twenty-six, but for now, all indicators are favorable. Even if we face some minor issues in the labor market data this week, I don’t expect any surprises that would significantly disrupt our overall positive view.
The claims data present an interesting situation worth understanding. Initial and ongoing claims seem to have essentially reset after the government shutdown, and we are now in a normalization phase that might take several more weeks or even a few months to fully stabilize. This introduces some noise into the data that sophisticated market participants understand, but it can confuse more casual observers. Additionally, there is a possibility of distortions in the employment figures from the Bureau of Labor Statistics as they work through their own post-shutdown adjustments. If we encounter missing data or gaps in the reporting, notes or announcements may accompany the releases to explain the discrepancies. How markets will react to potentially incomplete data remains uncertain, but I sense that traders will largely look past any technical anomalies and focus on the underlying economic trends.
Taking all these factors into account, this week appears to be fairly positive for risk assets. Markets are expected to open higher on Monday morning, and I see no strong reason to anticipate significant disruptions to the ongoing upward trend that has been in place for months. The S&P 500 continues to face resistance around the sixty-nine hundred level, which has proved to be a meaningful technical barrier. However, we recently broke through to a minor new high, and futures are trading just below their all-time highs as I write this. Given this situation, don’t be surprised if we see rallies that break above these levels as the week progresses. A steady bid underneath the market has marked the price action observed from September through December, and I expect this pattern to persist as we approach the final trading days of the year.
Economic Calendar for the week of December 15, 2025
Week of December 15 - 19
Dec 15 • 08:30 ET: Empire State Manufacturing For: Dec | Trading Impact: Low | KR Forecast: 12.5 | Cons: 10.6 | Prior: 18.7 • 10:00 ET: NAHB Housing Market Index For: Dec | Trading Impact: Low | KR Forecast: 38 | Cons: 39 | Prior: 38
Dec 15
· 08:30 ET: Empire State Manufacturing For: Dec | Trading Impact: Low | KR Forecast: 12.5 | Cons: 10.6 | Prior: 18.7
· 10:00 ET: NAHB Housing Market Index For: Dec | Trading Impact: Low | KR Forecast: 38 | Cons: 39 | Prior: 38
Dec 16
· 08:30 ET: Nonfarm Payrolls For: Nov | Trading Impact: High | KR Forecast: 10K | Cons: 30K | Prior: NA
· 08:30 ET: Nonfarm Private Payrolls For: Nov | Trading Impact: High | KR Forecast: 0K | Cons: 34K | Prior: NA
· 08:30 ET: Unemployment Rate For: Nov | Trading Impact: High | KR Forecast: 4.4% | Cons: 4.4% | Prior: NA
· 08:30 ET: Avg. Hourly Earnings For: Nov | Trading Impact: High | KR Forecast: 0.2% | Cons: 0.3% | Prior: 0.2%
· 08:30 ET: Average Workweek For: Nov | Trading Impact: High | KR Forecast: 34.2 | Cons: 34.3 | Prior: NA
· 08:30 ET: Retail Sales For: Oct | Trading Impact: High | KR Forecast: 0.2% | Cons: 0.3% | Prior: 0.2%
· 08:30 ET: Retail Sales ex-auto For: Oct | Trading Impact: High | KR Forecast: 0.2% | Cons: 0.3% | Prior: 0.3%
· 08:30 ET: Housing Starts For: Sep | Trading Impact: High | KR Forecast: 1300K | Cons: 1320K | Prior: 1307K
· 08:30 ET: Building Permits For: Sep | Trading Impact: High | KR Forecast: 1350K | Cons: 1348K | Prior: 1312K
· 09:15 ET: Capacity Utilization For: Nov | Trading Impact: Medium | KR Forecast: 77.5% | Cons: 77.4% | Prior: NA
· 09:15 ET: Industrial Production For: Nov | Trading Impact: Medium | KR Forecast: 0.1% | Cons: 0.1% | Prior: NA
· 09:45 ET: S&P Global U.S. Manufacturing PMI - Prelim For: Dec | Trading Impact: Medium | KR Forecast: NA | Cons: NA | Prior: 52.2
· 09:45 ET: S&P Global U.S. Services PMI - Prelim For: Dec | Trading Impact: Medium | KR Forecast: NA | Cons: NA | Prior: 54.1
· 10:00 ET: Business Inventories For: Sep | Trading Impact: Low | KR Forecast: 0.0% | Cons: 0.1% | Prior: NA
Dec 17
· 07:00 ET: MBA Mortgage Applications Index For: 12/13 | Trading Impact: Low | KR Forecast: NA | Cons: NA | Prior: 4.8%
· 08:30 ET: Retail Sales For: Nov | Trading Impact: High | KR Forecast: 0.2% | Cons: 0.2% | Prior: NA
· 08:30 ET: Retail Sales ex-auto For: Nov | Trading Impact: High | KR Forecast: 0.1% | Cons: 0.2% | Prior: NA
· 10:00 ET: Business Inventories For: Oct | Trading Impact: Low | KR Forecast: 0.0% | Cons: 0.1% | Prior: NA
· 10:30 ET: EIA Crude Oil Inventories For: 12/13 | Trading Impact: High | KR Forecast: NA | Cons: NA | Prior: -1.81M
Dec 18
· 08:30 ET: CPI For: Nov | Trading Impact: High | KR Forecast: 0.2% | Cons: 0.3% | Prior: NA
· 08:30 ET: Core CPI For: Nov | Trading Impact: High | KR Forecast: 0.2% | Cons: 0.3% | Prior: NA
· 08:30 ET: Initial Claims For: 12/13 | Trading Impact: High | KR Forecast: 225K | Cons: 229K | Prior: 236K
· 08:30 ET: Continuing Claims For: 12/06 | Trading Impact: High | KR Forecast: NA | Cons: NA | Prior: 1838K
· 08:30 ET: Philadelphia Fed Index For: Dec | Trading Impact: Low | KR Forecast: 1.0 | Cons: 2.9 | Prior: -1.7
· 10:00 ET: Leading Indicators For: Nov | Trading Impact: Low | KR Forecast: 0.0% | Cons: -0.1% | Prior: NA
· 10:30 ET: EIA Natural Gas Inventories For: 12/13 | Trading Impact: Low | KR Forecast: NA | Cons: NA | Prior: -177 bcf
· 16:00 ET: Net Long-Term TIC Flows For: Oct | Trading Impact: Low | KR Forecast: NA | Cons: NA | Prior: NA
Dec 19
· 08:30 ET: Personal Income For: Nov | Trading Impact: High | Actual: DELAYED | KR Forecast: NA | Cons: NA | Prior: NA
· 08:30 ET: Personal Spending For: Nov | Trading Impact: High | Actual: DELAYED | KR Forecast: NA | Cons: NA | Prior: NA
· 08:30 ET: PCE Prices For: Nov | Trading Impact: High | Actual: DELAYED | KR Forecast: NA | Cons: NA | Prior: NA
· 08:30 ET: PCE Prices - Core For: Nov | Trading Impact: High | Actual: DELAYED | KR Forecast: NA | Cons: NA | Prior: NA
· 10:00 ET: Existing Home Sales For: Nov | Trading Impact: High | KR Forecast: 4.05M | Cons: 4.10M | Prior: 4.10M
· 10:00 ET: Univ. of Michigan Consumer Sentiment - Final For: Dec | Trading Impact: Low | KR Forecast: 53.0 | Cons: 53.3 | Prior: 53.3
WaveTech Database Weekly Intermediate Models
Looking at today’s dashboard, the market summary reveals an interesting pattern of conviction across the hierarchy. Sectors are showing the most substantial long bias at 66.67%, with eight of twelve sectors positioned long and only four neutral. The symbol level follows closely at 65.19% long, representing 9,344 individual securities with long signals out of over 14,000 tracked. The middle tier tells a more cautious story, with industry groups nearly split at 51.96% long, suggesting that while broad sector themes and individual stock selection favor upside, the intermediate groupings remain more contested territory.


The weekly models present a mixed picture. Weekly 1.2a carries 273 long positions but sits in Negative status with a ratio of 0.44, indicating deteriorating conditions for that particular strategy. Weekly 3.2a maintains a larger footprint with 618 positions. It has stabilized at Neutral status with a ratio just above 1.0, suggesting it has found equilibrium but lacks the positive momentum seen in previous readings.
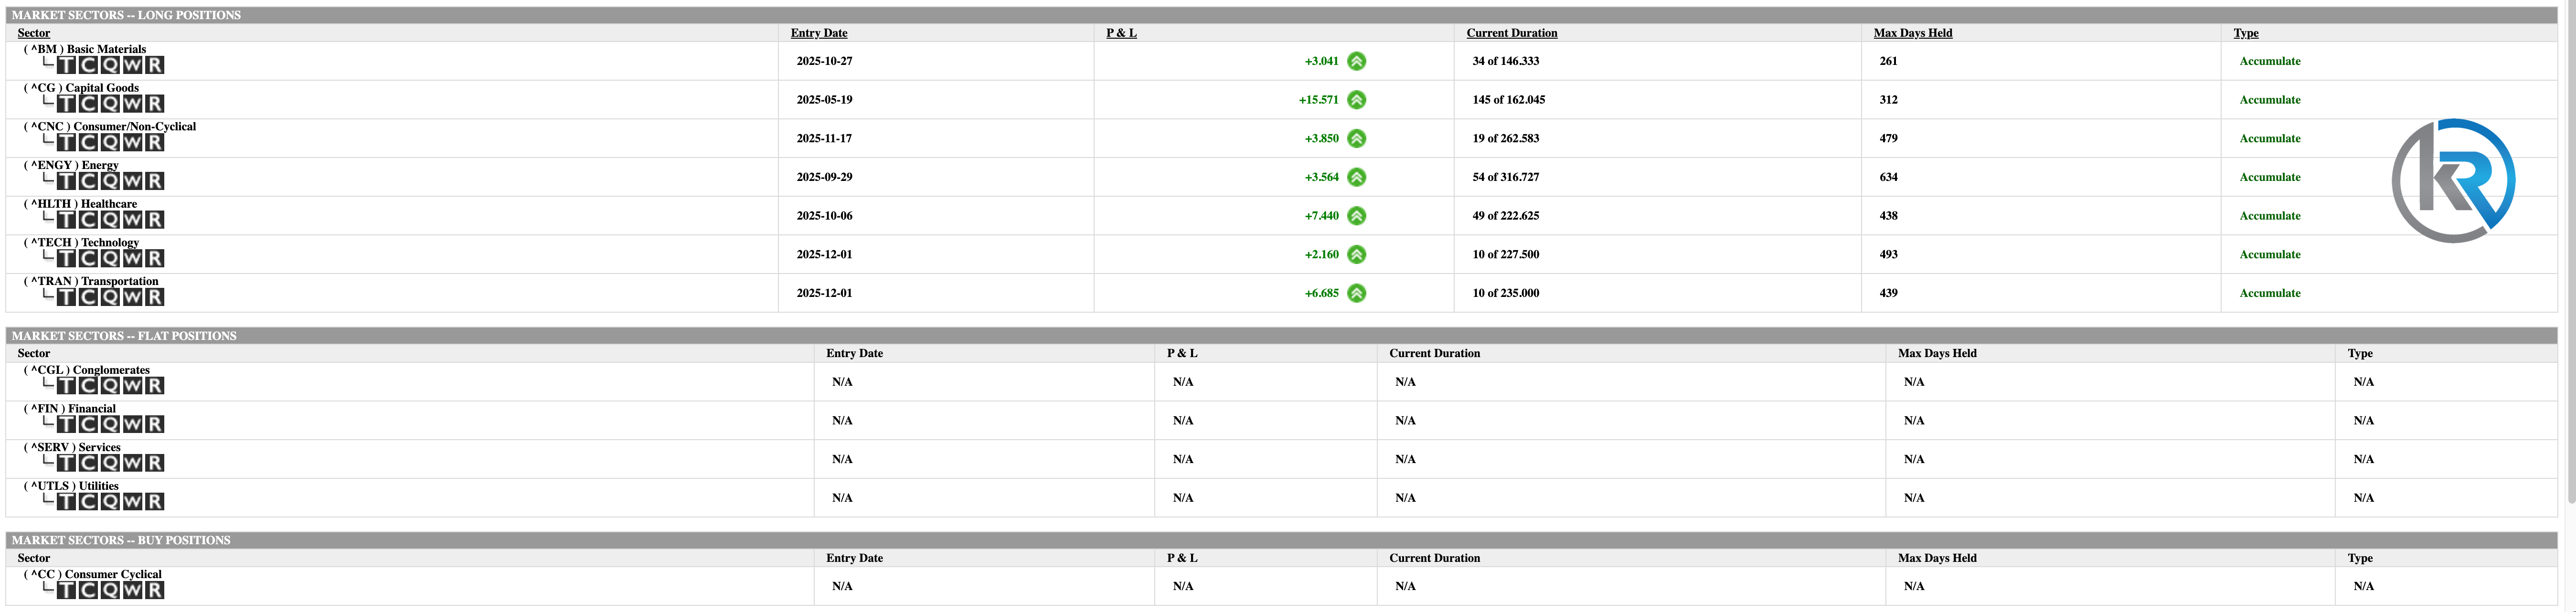
The sector positioning shows seven active long positions, all designated as Accumulate, meaning the system continues to build exposure rather than sitting on established holdings. Capital Goods stands out as the longest-running position, initiated in mid-May and now showing the most significant P&L at over +15,500, while approaching its expected duration of roughly 162 market days. Healthcare and Transportation are both performing well, with Healthcare up nearly 7,450 and Transportation showing 6,685, despite being relatively fresh December entries alongside Technology. The newer December positions in Technology and Transportation are still early in their expected hold periods of around 227 and 235 market days , respectively.
Four sectors remain flat, with no active positions: Conglomerates, Financial, Services, and Utilities. Consumer Cyclical appears in the Buy section, signaling a potential entry opportunity that has not yet triggered into an active position.
Looking at the optimized model’s duration profile, the system has currently consumed 30.54 market days of its average 206-day holding period, representing only 14.83% of the expected cycle. To project when this model would reach the critical two-thirds threshold, 66% of 206 days equals approximately 136 market days. With 30.54 days already elapsed, the model requires an additional 105 trading sessions to reach that milestone. At approximately 21 market days per month, this translates to roughly five calendar months. Counting forward from today’s date, December 15, 2025, the projection lands in late May to early June 2026, marking the point at which the optimized model would transition into the mature phase of its holding cycle.
This duration analysis becomes particularly valuable when extended to the individual sector positions, as each carries its own expected holding period and current progress. The calculations reveal a staggered maturation schedule that will unfold across the first eleven months of 2026.
Capital Goods stands in a category of its own, having already surpassed the 66% threshold. With 145 market days elapsed against an expected duration of 162 days, this position has consumed 89.5% of its projected hold and reached the two-thirds mark approximately 38 trading days before today’s reading. The 66% target for Capital Goods was 107 market days, a level passed in late October 2025, which explains why this position shows the most significant accumulated P&L at over +15,500.
Basic Materials presents the next maturation date among the active positions. Currently showing 34 market days against an expected 146.33-day duration, the position has completed 23.2% of its cycle. The 66% threshold calculates to 96.6 market days, requiring an additional 62.6 trading sessions from today. At 21 market days per month, this arithmetic points to late March 2026 as the date when Basic Materials would enter the mature two-thirds phase of its expected hold.
Healthcare follows in early May. With 49 market days elapsed of a 222.63-day expected duration, the position is 22% complete. The two-thirds target of 146.9 market days means the position needs roughly 98 more trading sessions, translating to approximately 4.7 calendar months and projecting to early-to-mid May 2026 for that threshold crossing.
Energy occupies a mid-year position in the maturation calendar. Having accumulated 54 market days against an expected 316.73-day duration, this position has completed 17% of its cycle. The 66% threshold of 209 market days requires an additional 155 trading sessions, equating to roughly 7.4 calendar months and targeting late July to early August 2026.
The two December entries in Technology and Transportation show nearly identical duration profiles at this early stage. Technology has logged 10 market days against a 227.5-day expectation, placing it at just 4.4% completion, while Transportation has logged 10 market days against 235 days, for 4.3% completion. For Technology, the 66% target of 150.15 market days requires 140 additional trading sessions, translating to approximately 6.7 calendar months and pointing to early July 2026. Transportation’s slightly longer expected duration yields a 66% threshold of 155.1 market days, requiring 145 additional trading sessions and projecting through mid-July 2026.
Consumer Non-Cyclical carries the most extended expected duration among all positions at 362.58 market days, and with only 19 days elapsed, it sits at just 5.2% completion. The 66% target of 239.3 market days requires another 220 trading sessions to reach the two-thirds mark. At 21 market days per month, this equates to approximately 10.5 calendar months, projecting through late October or early November 2026, making it the final sector to mature among the current holdings.
When viewed as a portfolio sequence, the maturation calendar creates a natural progression: Capital Goods is already in its final third and should be monitored for exit signals; Basic Materials reaches maturity in late March; the optimized model itself crosses its 66% threshold around late May to early June, roughly coinciding with the midpoint of the sector maturation sequence; Healthcare matures in early May; Technology and Transportation mature together in early-to-mid July; Energy follows in late July to early August; and Consumer Non-Cyclical extends the portfolio’s duration exposure deep into late autumn 2026. This staggered structure suggests the system has built positions with varied time horizons, creating optionality for both near-term profit-taking in Capital Goods and extended exposure in the longer-duration cyclical and energy positions.
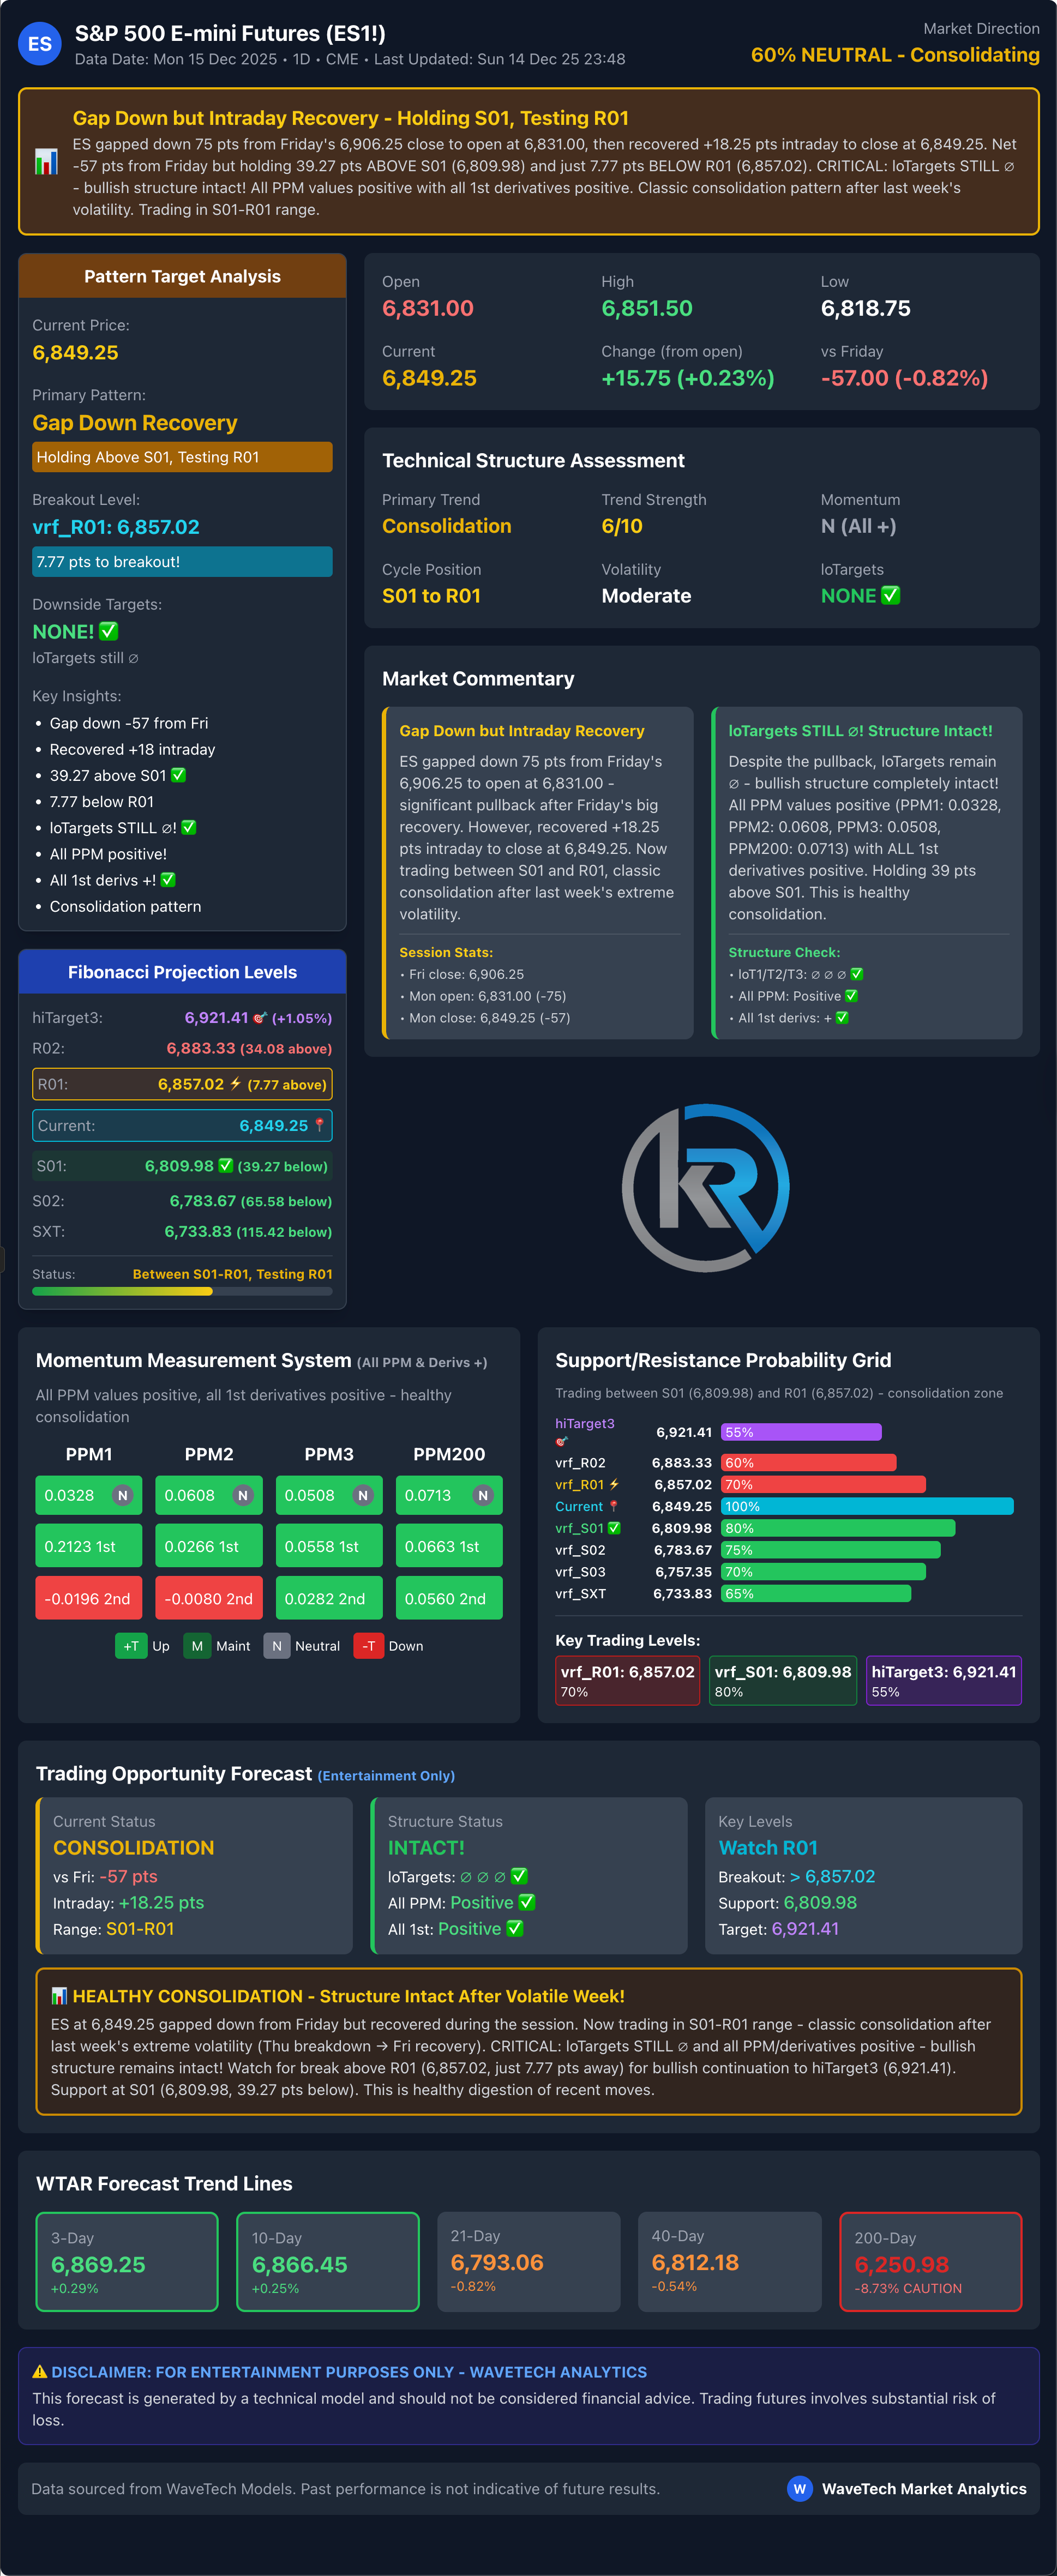
S&P 500 Futures
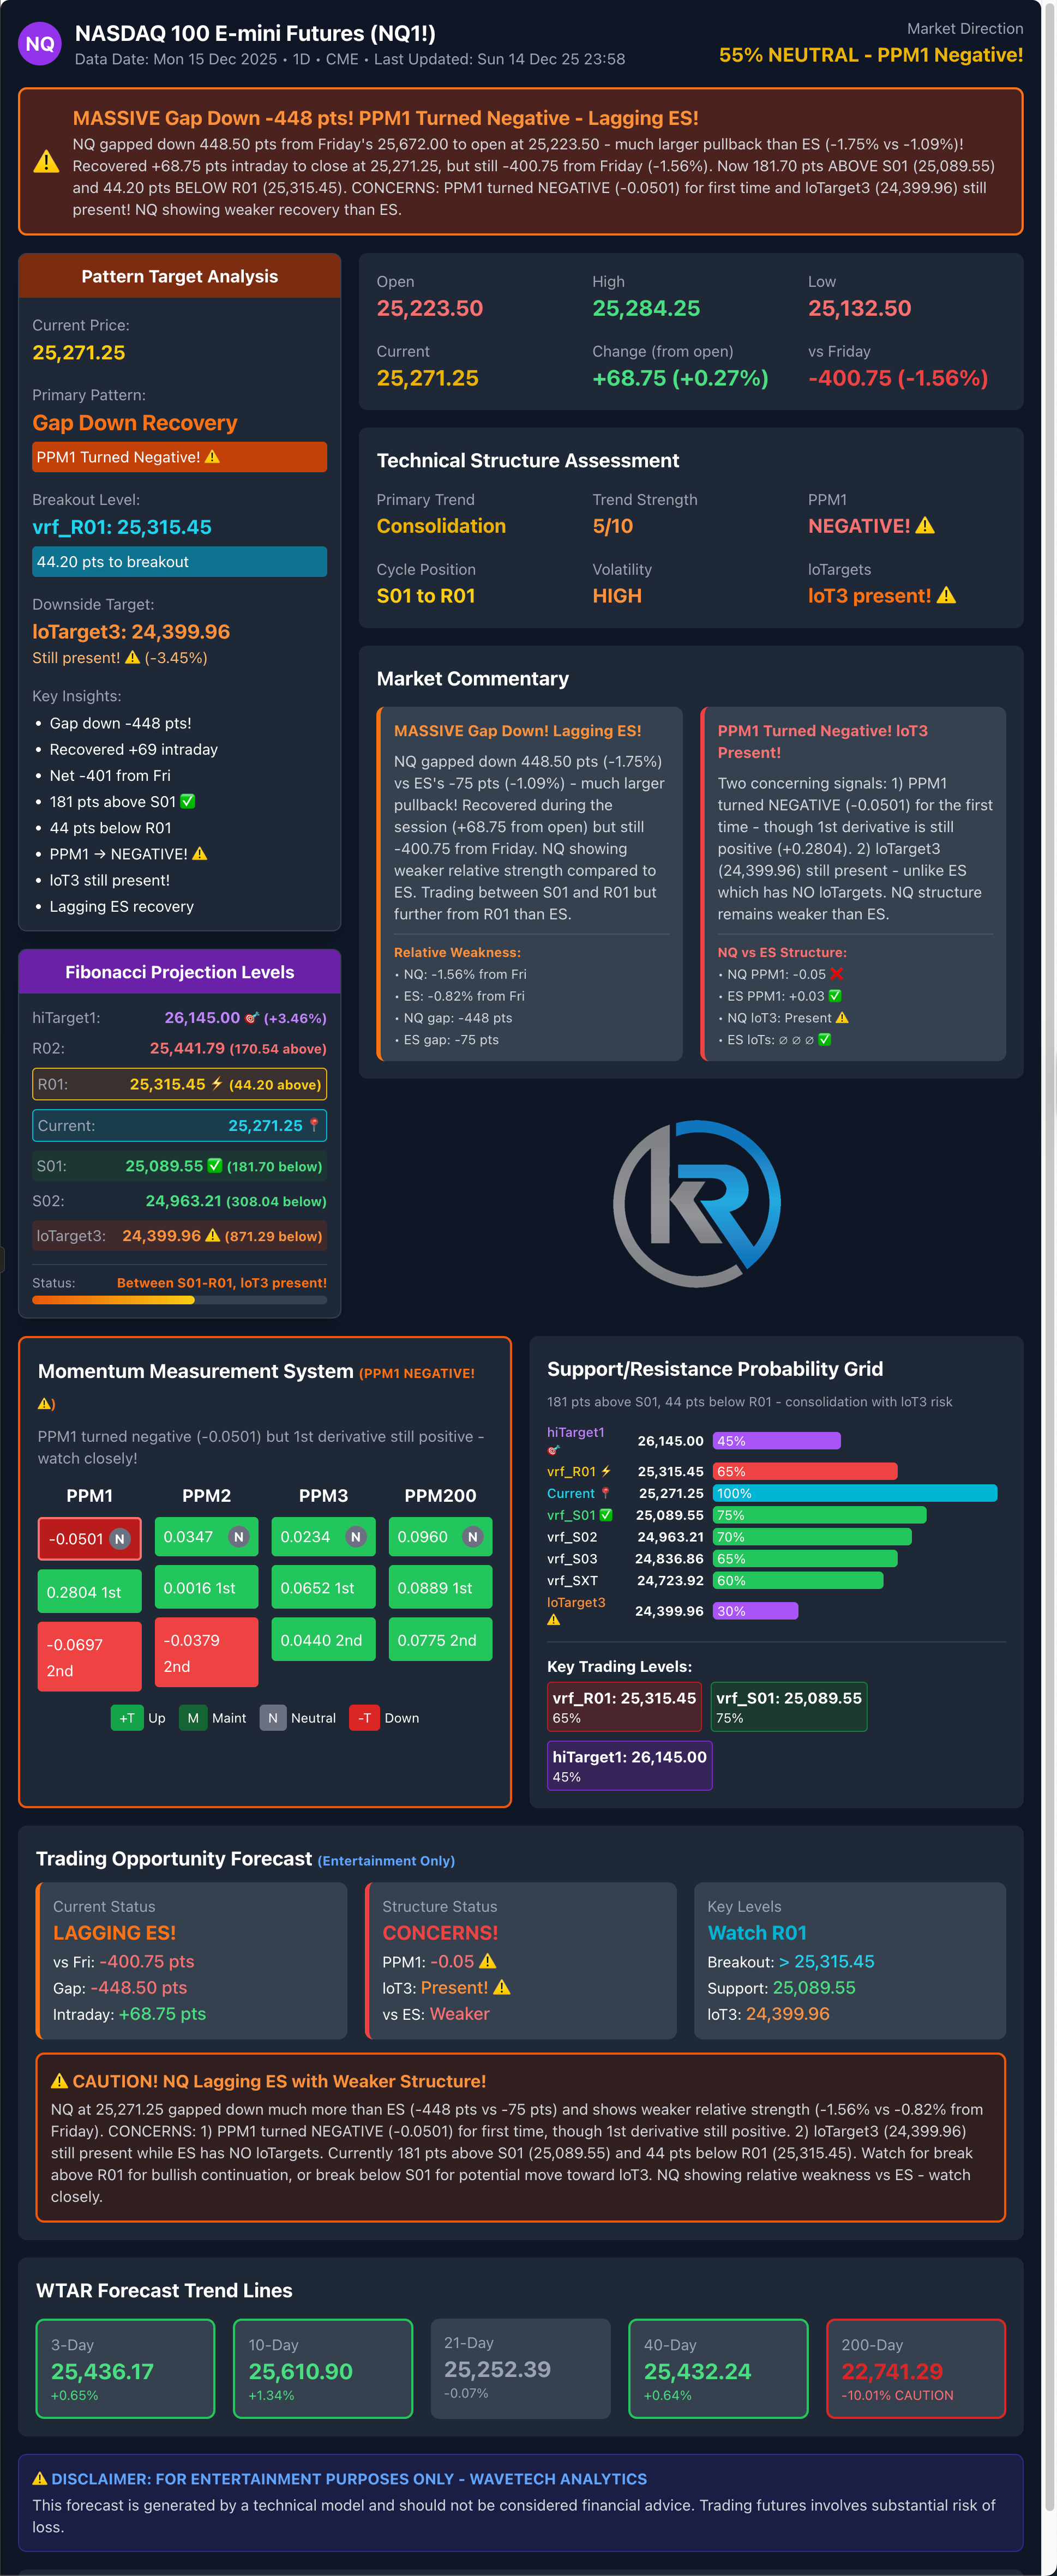
NASDAQ Futures
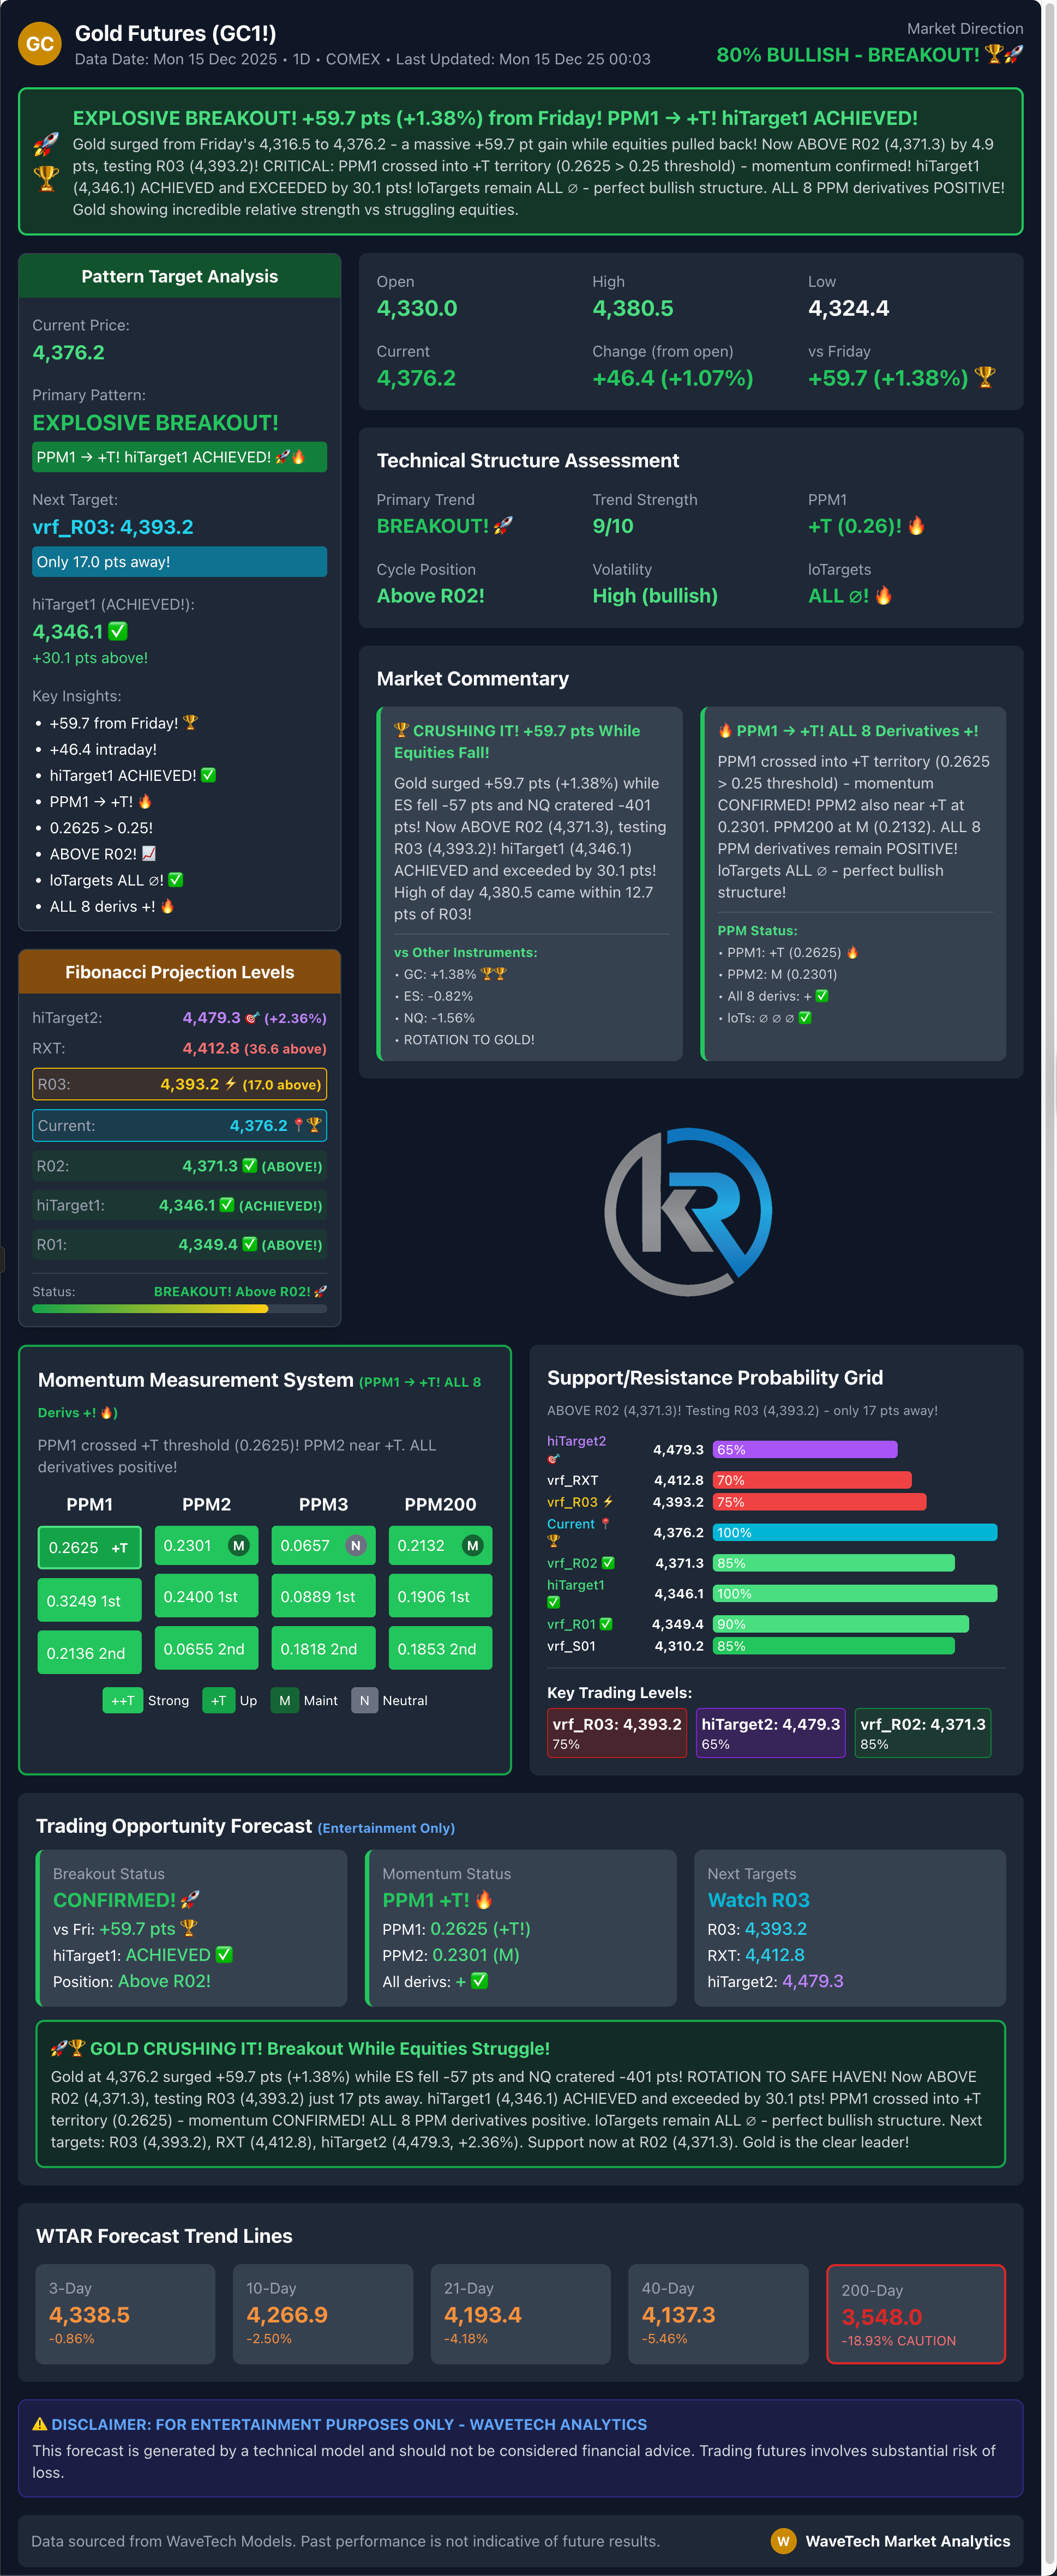
Gold Futures
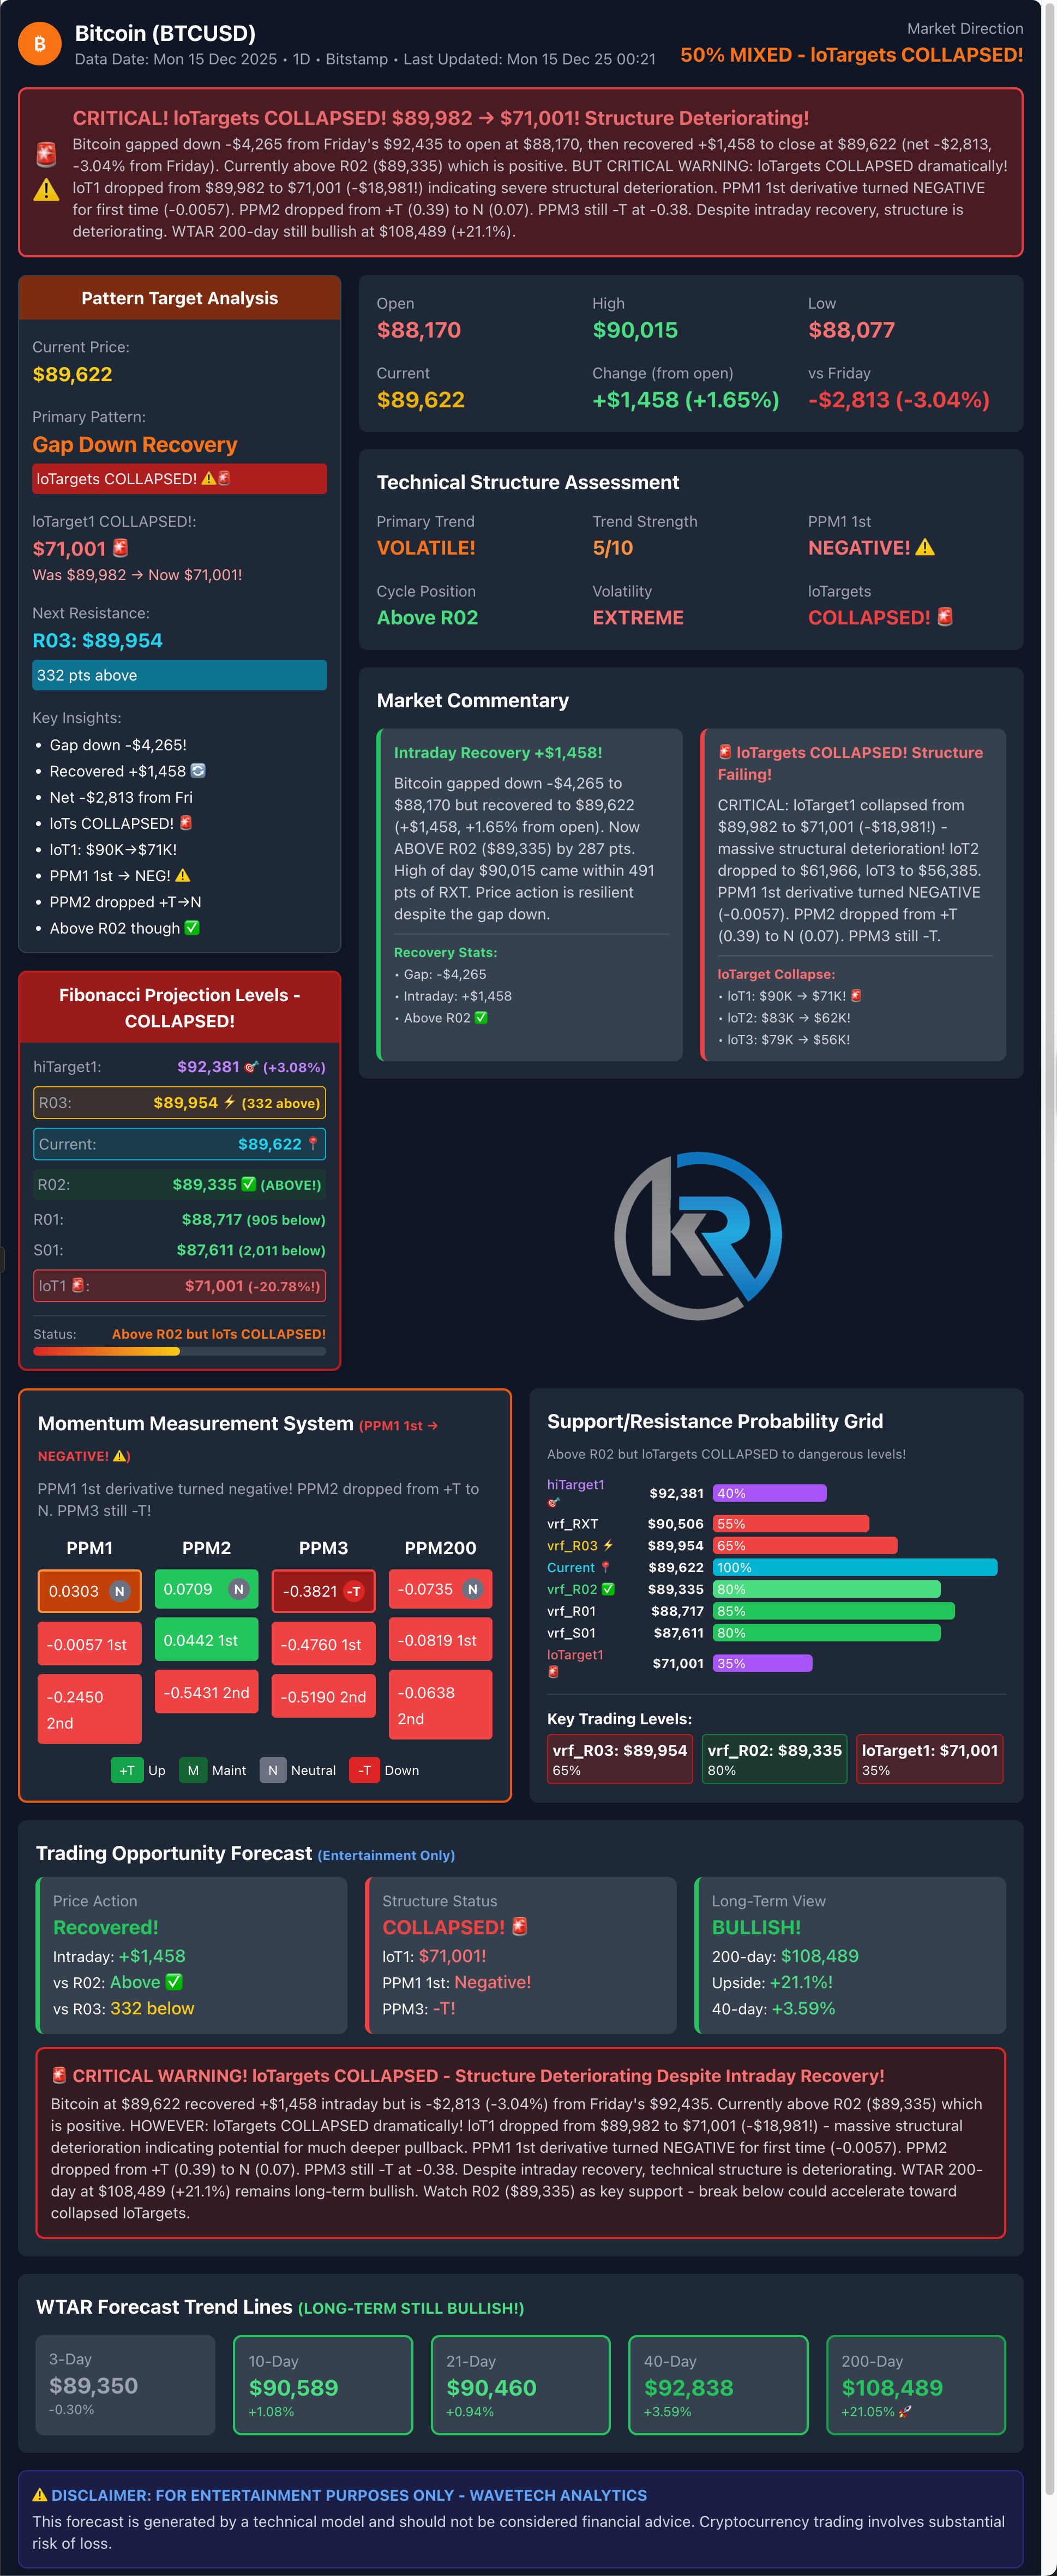
Bitcoin
Robert Kendall
Chief Analyst
“Disclaimer for “The Kendall Report
The information provided in “The Kendall Report” is for general informational and educational purposes only. The opinions, analyses, and forecasts included in this newsletter are based on the author’s personal views and experiences and are provided as is without warranty of any kind.
While we strive to provide accurate and up-to-date information, we do not guarantee the accuracy, completeness, reliability, or timeliness of any information contained in this newsletter. The information presented should not be construed as financial, investment, legal, or other professional advice. It does not constitute a recommendation or endorsement of any particular investment strategy, financial instrument, product, or service.
Investors should consider their financial situation, objectives, and risk tolerance before making investment decisions based on the information provided. The financial market is subject to high risk and volatility. Past performance is not indicative of future results. Investing in the financial market involves the risk of loss, including the loss of principal.
“The Kendall Report” and its contributors will not be liable for any direct, indirect, incidental, consequential, or exemplary damages arising from the use or inability to use the information provided in this newsletter, including but not limited to losses or missed gains.
By accessing and using “The Kendall Report,” you acknowledge and agree to this disclaimer and assume full responsibility for the use of the information provided. We reserve the right to make changes to the content of this newsletter at any time without notice.
This disclaimer is subject to change at our discretion, and it is the reader’s responsibility to review it regularly for any updates.