
Database Signals Further Weakness for Equities
Bitcoin signaling pattern failure!

KR Opinion
The database indicators I've been monitoring have finally breached the 42% bullish threshold, a development that typically signals incoming market liquidation. Just two weeks before the election, this inflection point's timing raises interesting questions about market sentiment.
While some speculate that the market is anticipating a particular election outcome, I’m seeing a more straightforward pattern of investors taking protective positions and adjusting their portfolios as we progress through Q4. The upcoming Fed meetings in the near term and December add another layer of complexity to market dynamics.
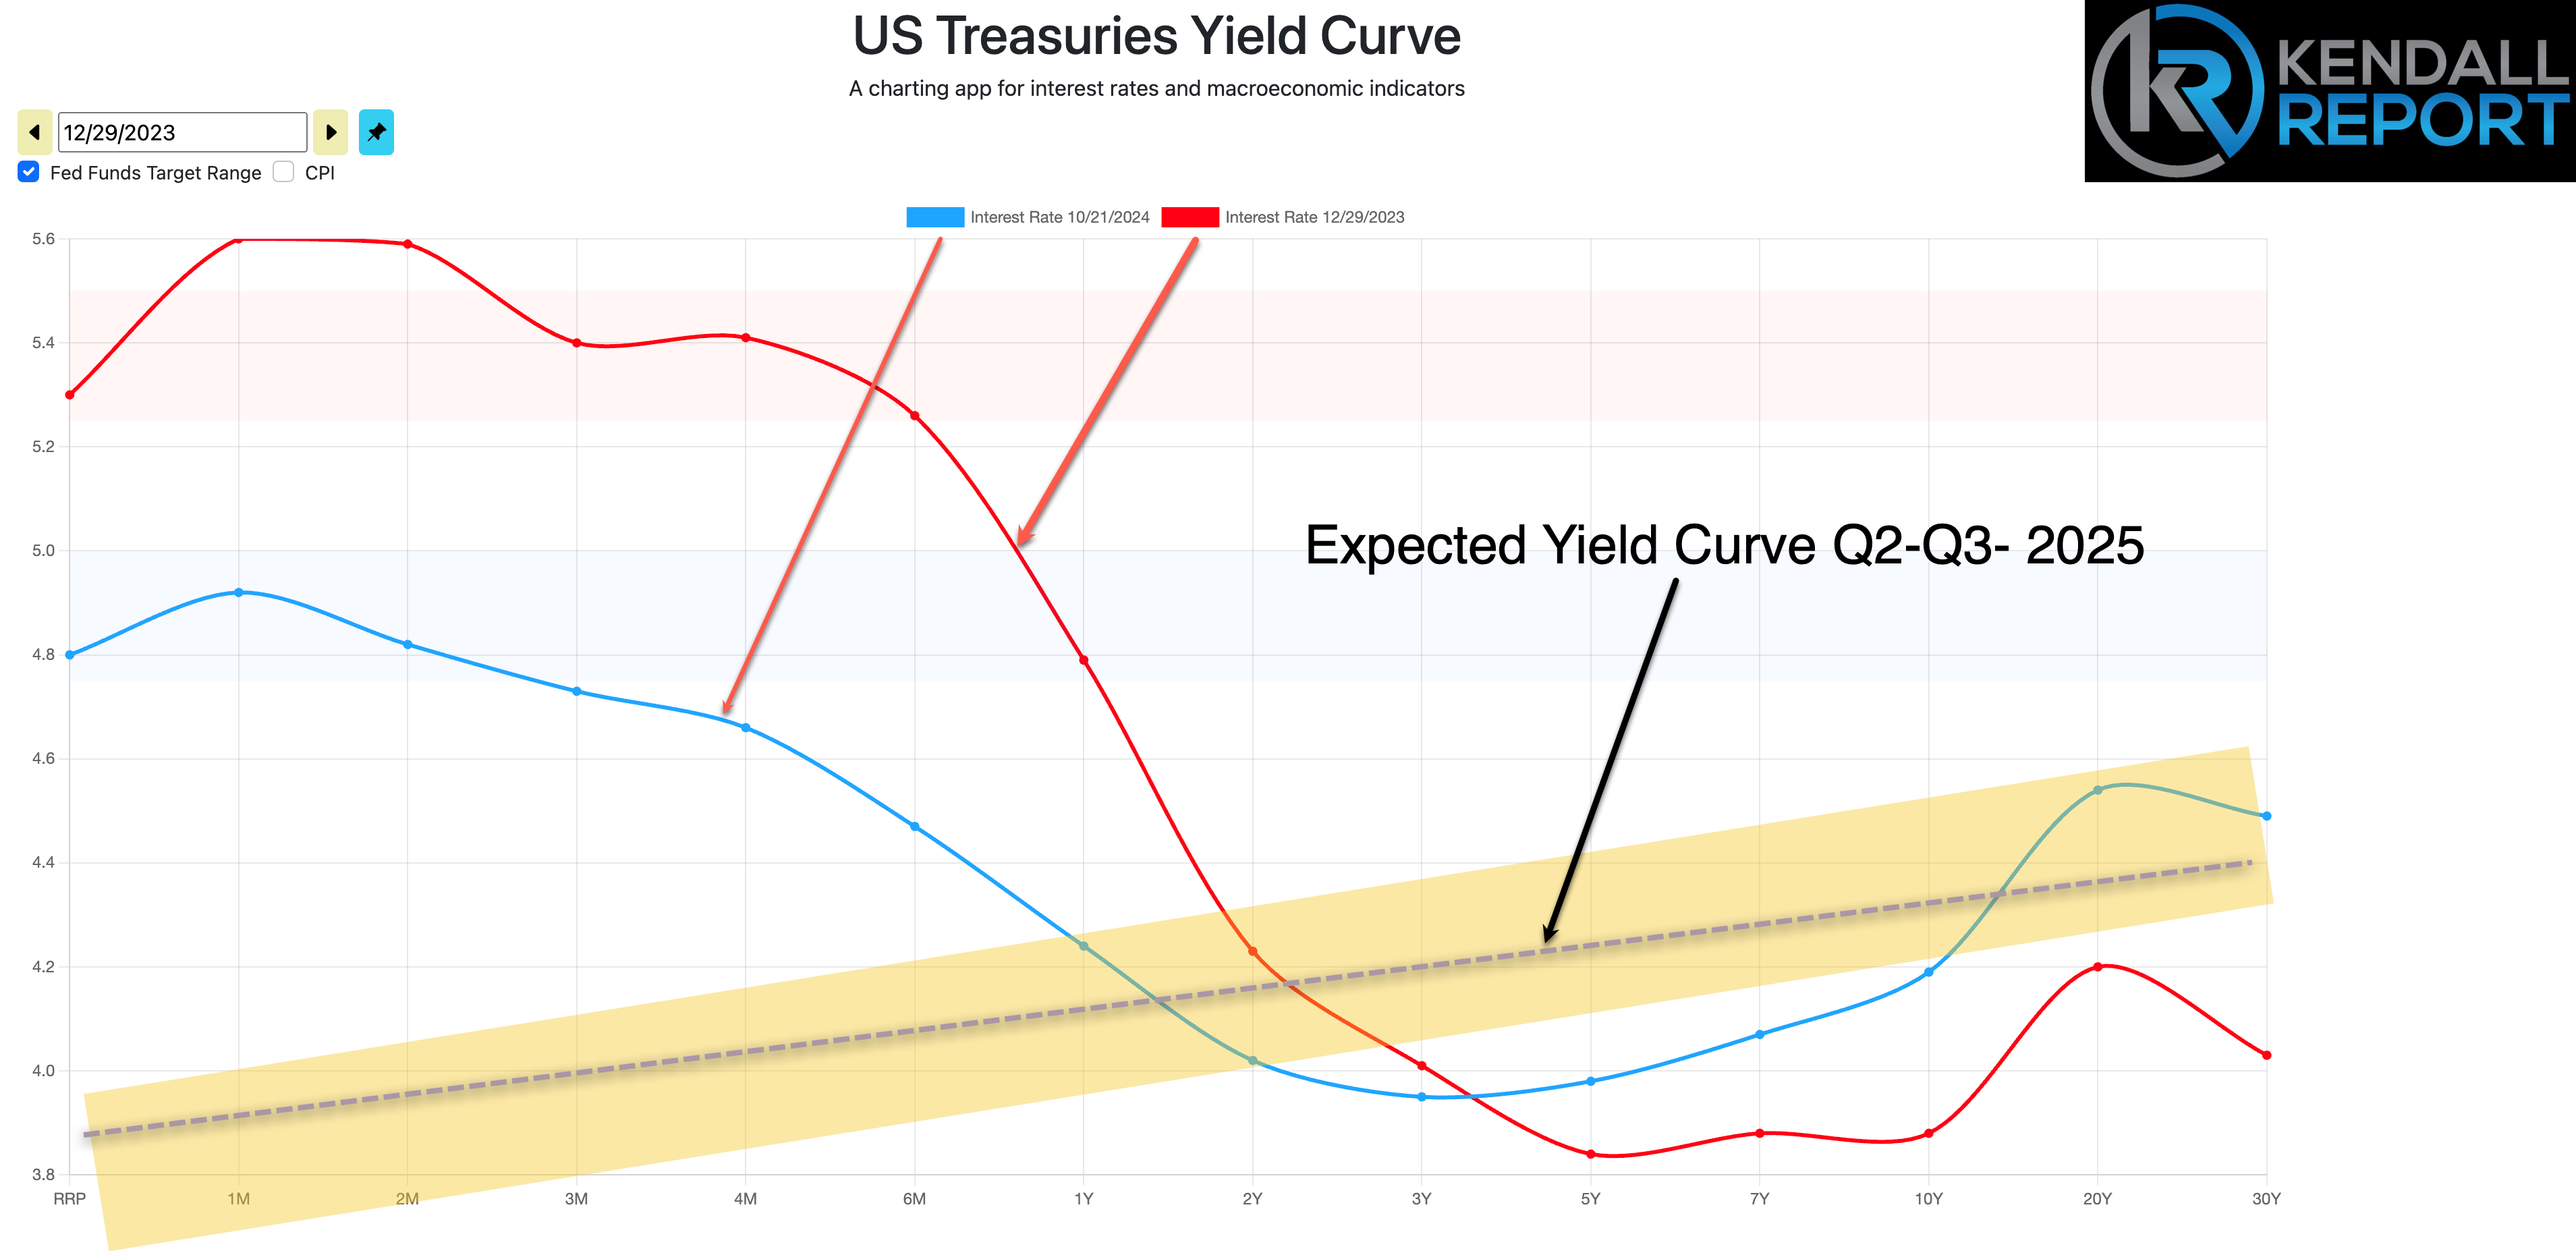
Perhaps most intriguing is the yield curve's recent behavior. Despite expectations that the Fed's 50-basis-point rate cut would push rates lower across the board, we're seeing the opposite effect. The back end of the curve has climbed to around 4.20%, puzzling many market observers. This reflects the Fed's dual strategy: cutting rates at the front end while conducting quantitative tightening through bond sales at the back end. This manipulation creates a more orthodox yield curve configuration, with the front end roughly 1.00-1.45% lower than the back end. This will likely materialize some time Q2-Q3 of 2025.
Regarding market positioning, we're witnessing what resembles a quarterly rebalancing scenario. Investors are shifting toward neutral stances, treating the upcoming election as a pivotal financial event. While we're not seeing major structural problems yet, signs of increasing overhead resistance suggest the market may be entering a topping phase with the potential for modest declines.
While expected to show a slight increase despite higher mortgage rates, tomorrow's existing home sales data is unlikely to impact markets unless the numbers deviate significantly from expectations. The real story to watch is the continued repositioning of institutional investors ahead of the election – a theme that will likely dominate market activity over the next few weeks.
These market movements don't necessarily signal immediate concern, but they do suggest a period of careful position adjustment and risk management lies ahead.
Looking Back on Tuesday’s action
The major indices demonstrated resilience Tuesday, with mixed but relatively contained movements. The S&P 500 finished marginally lower, down 0.1%, but it showed steady improvement throughout the session from its opening lows to closing near its intraday high. The Nasdaq Composite managed to end in positive territory, up 0.2%, while the Dow Jones Industrial Average finished essentially flat.
Mega-cap technology stocks played a crucial role in supporting the broader market. Microsoft stood out with a substantial 2.1% gain to 427.51, while Meta Platforms advanced 1.2% to 582.01. However, beneath the surface of these headline names, many stocks continued the consolidation pattern that emerged Monday.
Market internals revealed broader weakness than the headline indices might suggest. Declining stocks outnumbered advancers by a 3-to-2 ratio at the NYSE and a 4-to-3 margin at the Nasdaq. This underlying weakness was further evidenced by the equal-weighted S&P 500's decline of 0.5%, indicating that smaller companies within the index faced more significant pressure.
Sector performance was predominantly negative, with six of the eleven S&P 500 sectors closing lower. The industrial sector faced the steepest decline, dropping 1.2%. In contrast, consumer staples showed strength, gaining 0.9% as investors favored defensive positions.
The bond market continued to pressure equities, with yields pushing higher across the curve. The benchmark 10-year Treasury yield climbed another two basis points to 4.20%, bringing its total increase to 13 basis points since Friday. The 2-year yield edged up one basis point to 4.04%, accumulating a nine-basis point rise for the week.
Corporate earnings results painted a mixed picture. Several high-profile companies reported disappointing results or guidance. Verizon shares dropped 5.0% to 41.50, while 3M declined 2.3% to 131.73. The industrial sector faced particular pressure from GE Aerospace, which tumbled 9.1% to 176.66, and Lockheed Martin, falling 6.1% to 576.98. However, General Motors provided a bright spot, surging 9.8% to 53.73 after reporting better-than-expected earnings and providing optimistic guidance.
This market action suggests investors are becoming more selective, with money rotating between sectors and individual stocks rather than flowing uniformly into the broader market. The divergence between mega-cap technology performance and the broader market, combined with rising yields and mixed earnings reactions, points to a market carefully weighing various factors rather than maintaining the broad-based momentum seen in recent months.

Nasdaq Composite: +23.7% YTD
S&P 500: +22.7% YTD
Dow Jones Industrial Average: +13.9% YTD
S&P Midcap 400: +12.9% YTD
Russell 2000: +10.1% YTD
There was no US economic data of note on Tuesday.
Wednesday's calendar features:
7:00 a.m. ET: Weekly MBA Mortgage Applications Index
10:00 a.m. ET: September Existing Home Sales
10:30 a.m. ET: EIA Crude Oil Inventories
2:00 p.m. ET: October Beige Book
WaveTech Database
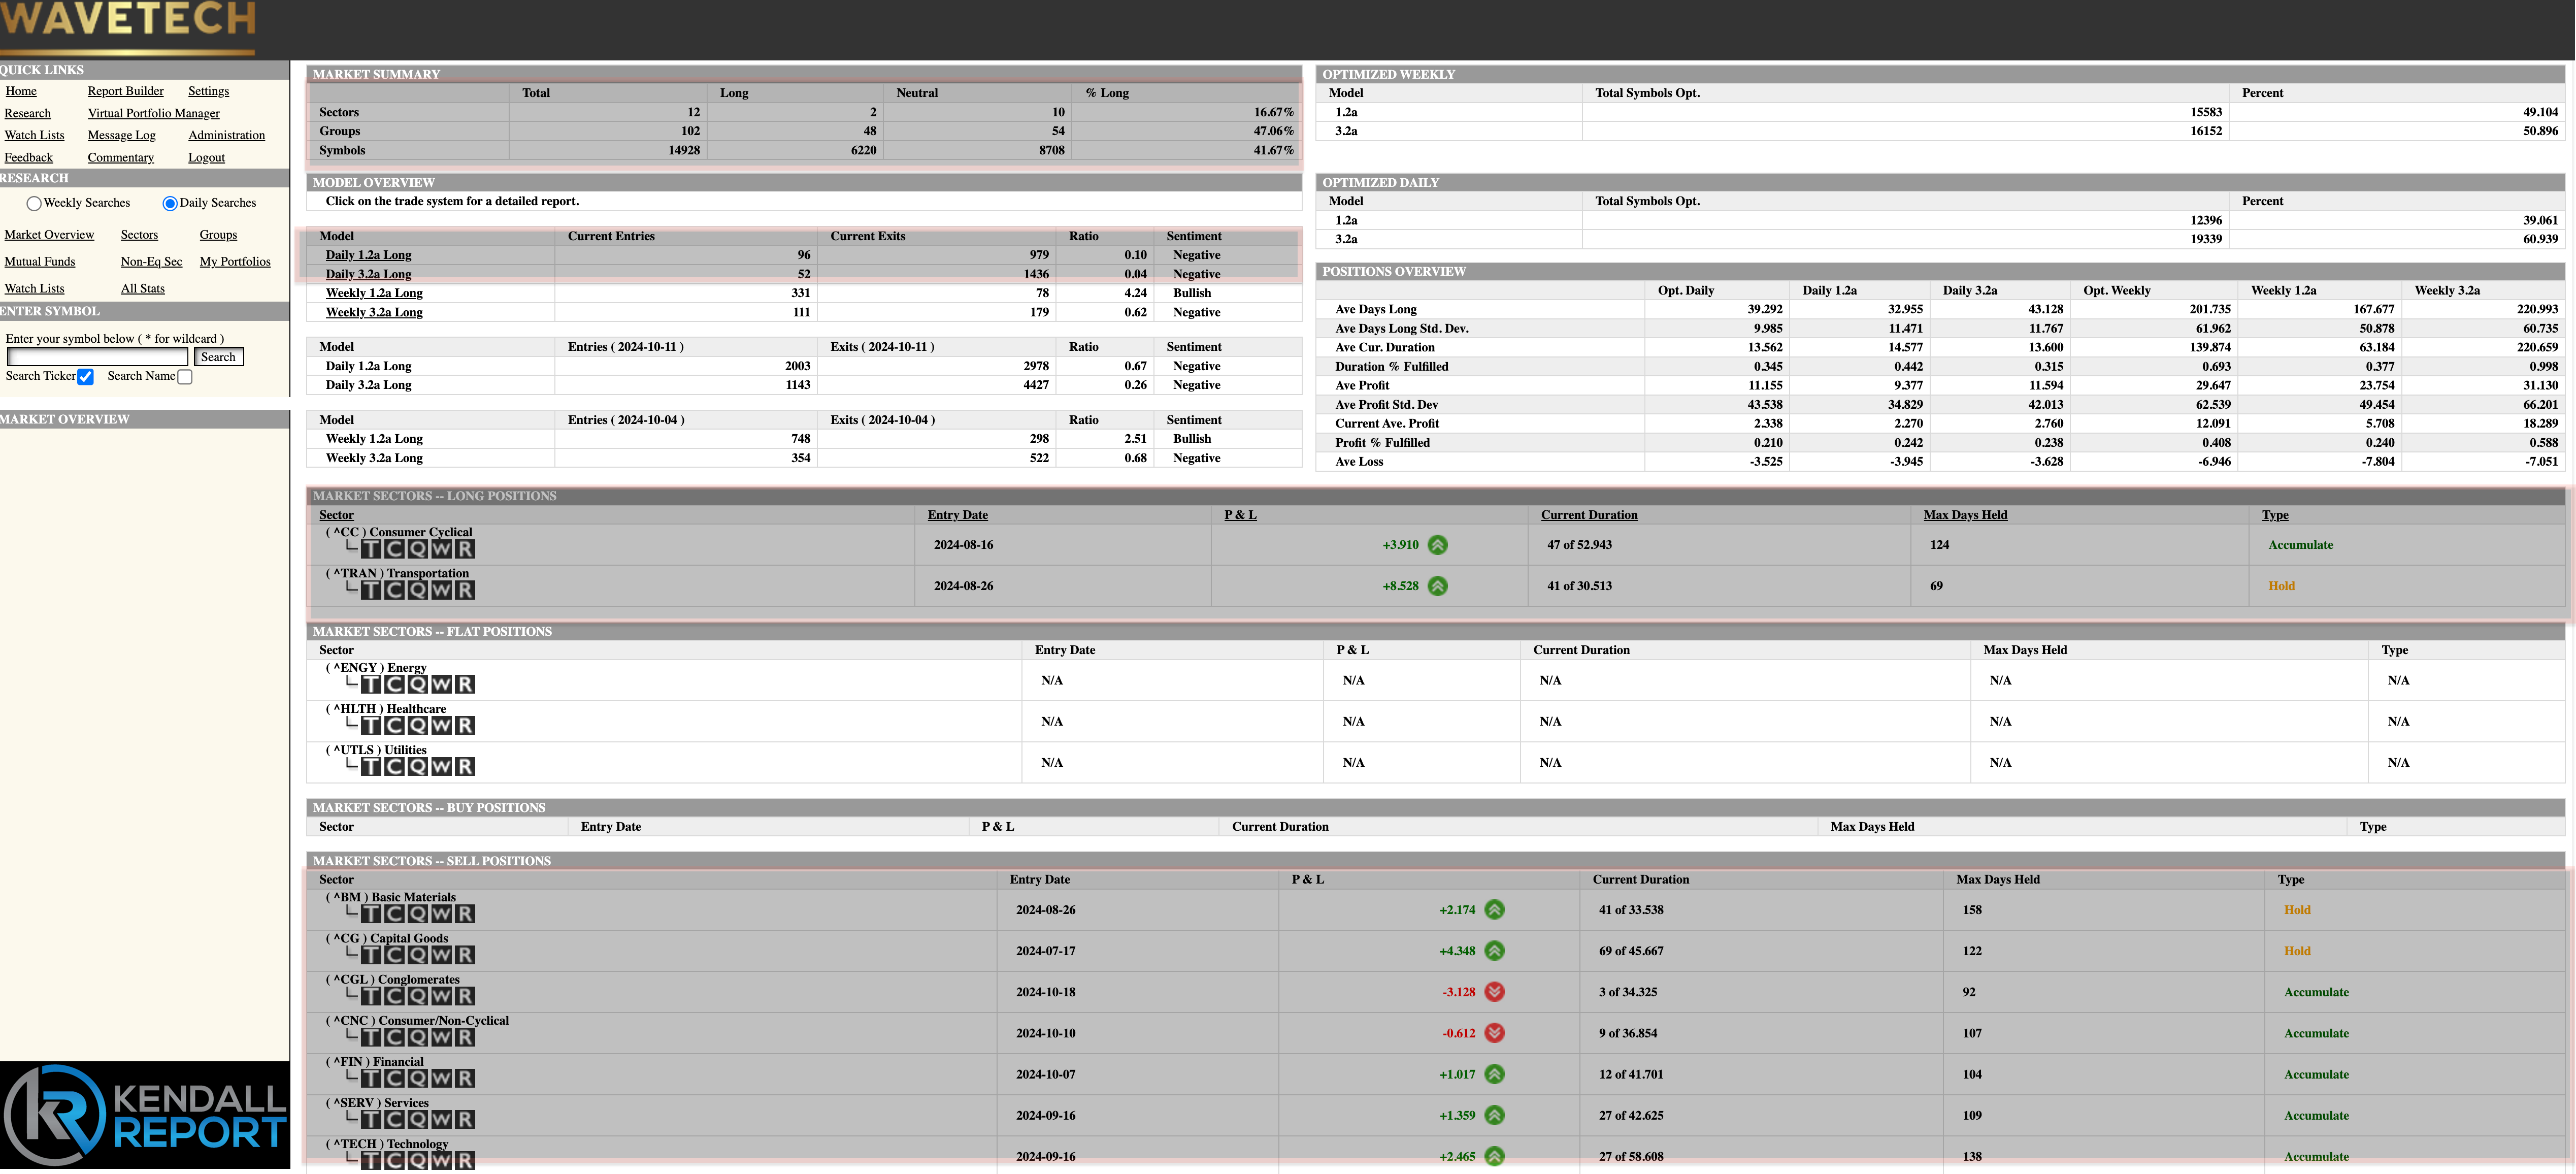
Recent market data reveals a significant shift in selling pressure In the past few days alone. The Database has issued 2,405 exits against just 148 new entries for Wednesday, pushing the bullish percentage below the critical 42% threshold to 41.67%. This breakdown is particularly noteworthy given the database's remarkable resilience throughout 2024.
The current market structure suggests we're entering an exhaustion phase. However, Friday's intermediate model results will be the key indicator. While the current 82% bullish reading on intermediate models might indicate an oversold condition ripe for correction, we're still far from reaching the kind of liquidation phase triggered by a 42% move in the intermediate database. To put this in perspective, such a move would require 7,000-8,000 sell signals - a process that would take considerable time to unfold.
Nevertheless, we can anticipate rotation and contraction in the database, potentially leading to lower prices without necessarily triggering a major market rollover. The short-term sector analysis reveals developments that are particularly concerning. We're seeing widespread liquidation across multiple sectors:
- Basic Materials
- Capital Goods
- Conglomerates
- Consumer Non-Cyclical
- Financial Services
- Technology
Only two sectors remain in long positions: Consumer Cyclical and Transportation. This represents a dramatic shift, with only 16% of sectors maintaining long positions in short-term cases. Industry groups show similar weakness, with group readings at 47% and individual symbols at 41.67%.
The speed and breadth of this change are remarkable - the market landscape has transformed dramatically in just the past couple of days. While we'll need to carefully monitor how these developments affect the intermediate database as we approach week's end, the immediate implications are clear: investors should consider tightening their trailing stops and potentially taking profits on existing positions.
This shift doesn't necessarily predict a severe market downturn but signals a significant change in market dynamics that warrants careful attention and possibly defensive portfolio adjustments. The comprehensive nature of this selling pressure across multiple sectors suggests this isn't just normal market noise but rather a meaningful shift in market sentiment and positioning.
S&P 500 Futures
