

Fed Cuts QT!

KR Opinion
As we entered Wednesday's trading session, the Federal Reserve's messaging remained consistent. In a recent speech, Powell reiterated that although inflation has decreased significantly over the past year, it remains above the desired 2% target.
This suggests that monetary policies will continue suppressing demand, particularly in interest-sensitive sectors like real estate. Despite this, economic growth and employment have shown resilience, bolstered by improvements in global supply chains and increased labor supplies. However, Powell’s narrative hints at ongoing challenges from past supply chain disruptions.
It is clear that immigration has been supporting the labor market, which may not be as robust as the Fed portrays in its FOMC meeting minutes. For those of us who must work and pay for essentials without aid like EBT cards or housing subsidies, the economic experience differs significantly from the Fed's discussions, which seem almost detached from reality.
Nevertheless, the Fed insists on maintaining high-interest rates due to persistent inflation, claiming transparency and effectiveness in its policies.
Powell also touched on potential triggers for lowering interest rates, but always with a caveat. A notable point in his speech was the Fed's planned reduction in security sales, from $60 billion to $25 billion monthly, a significant shift that I believe will impact the markets, though it seemed to go unnoticed.
Additionally, the latest JOLTS report shows a continued surplus of jobs over applicants, a key metric for the Fed. Meanwhile, ADP employment numbers exceeded expectations, emphasizing the labor market's influence on Fed policies.
Looking ahead to Thursday, we expect reports on job claims and ongoing metrics on economic output, which continue to show a disconnect between labor strength and actual production.
Powell mentioned that inflationary pressures will persist as long as productivity lags behind GDP.
I've been advocating for productivity boosts through AI, which could reshape our economic landscape post-2025.
As this week progresses, market sentiment appears negative, reflecting broader concerns as we move through Q2.
Looking Back on Wednesday Action
In the early trading hours, major stock indices fluctuated within narrow ranges as market participants awaited key market events scheduled for later. The market's reaction was mixed, with a slight tilt towards advancing stocks at the NYSE and Nasdaq.
The stock market remained mostly stable after the Federal Open Market Committee (FOMC) decided unanimously to maintain the federal funds rate between 5.25% and 5.50%, as anticipated. The FOMC noted the continued challenge in making progress towards the inflation target.
However, stocks surged following Fed Chair Powell's press conference, where he indicated it was "unlikely that the next policy rate move will be a hike." This statement led to a drop in market rates and a rise of over 1.0% in major indices.
Interest rates on short-term government securities, like the 2-year note, decreased by 11 basis points to 4.94%, and the 10-year note yield dropped by nine basis points to 4.60%.
The rally lost steam towards the market's close due to ongoing concerns about the Fed potentially maintaining higher interest rates for an extended period. Major indices closed near their levels before the impactful events; the Dow Jones Industrial Average ended slightly up by 0.2%, while the S&P 500 and Nasdaq Composite fell by 0.3%.
In earnings news, Amazon's stock gained, supporting the broader market, while significant losses in stocks like CVS Health, Starbucks, and Skyworks Solutions following their earnings reports restrained market gains. CVS Health dropped by 16.8%, Starbucks by 15.9%, and Skyworks Solutions by 15.3%.
·S&P 500:+5.2% YTD
·Nasdaq Composite: +4.0% YTD
·S&P Midcap 400: +3.0% YTD
·Dow Jones Industrial Average: +0.6% YTD
·Russell 2000: -2.3% YTD
Reviewing Wednesday's economic data:
- Weekly MBA Mortgage Applications Index fell by 2.3%, following a previous decline of 2.7%.
- April ADP Employment Change was 192K, surpassing the KR Forecast Review's expectation of 175K; the previous figure was revised up from 184K to 208K.
- April S&P Global US Manufacturing PMI settled at 50.0, down from 51.9 previously.
- April ISM Manufacturing Index registered at 49.2%, below the KR Forecast Review's prediction of 50.0% and the prior reading of 50.3%. The key takeaway is the unfavorable combination of weakening manufacturing activity and a faster increase in prices.
March JOLTS—Job Openings reported 8.488 million, revising the previous figure from 8.756 million to 8.813 million.
- March Construction Spending dropped by 0.2%, contrary to the KR Forecast Review's forecast of a 0.4% increase; the prior month's data was revised to 0.0% from -0.3%. The report highlights weak residential spending, likely due to the impact of higher financing costs and stricter lending standards for new construction.
Looking ahead, Thursday's economic data will include:
- 8:30 ET: Weekly Initial Claims (KR Forecast expects 213,000; prior was 207,000), Continuing Claims (previous 1.781 million),
March Trade Balance (KR Forecast predicts a deficit of -$69.0 billion; prior was -$68.9 billion), preliminary Q1 Productivity (KR Forecast expects 0.8%; prior was 3.2%), and Unit Labor Costs (KR Forecast Review predicts 2.5%; prior was 0.4%).
- 10:00 ET: March Factory Orders (KR Forecast Review predicts 1.6%; prior was 1.4%).
- 10:30 ET: Weekly natural gas inventories (prior increase of +92 bcf).
S&P 500 Futures
Wednesday's market action was intriguing, marked by relatively stable trading within a narrow range until a notable Fed announcement sparked a swift rise, exceeding the RTX level. However, this gain was short-lived, as a sharp reversal occurred in the final hour, ending the day closer to the session's lows.
The hourly chart below illustrates an RTX sell signal accompanied by a signal from Hourly PPM 1, predicting a downturn following the initial spike. This volatility spike, which I often highlight, typically requires several hours to settle before the market determines its next direction.
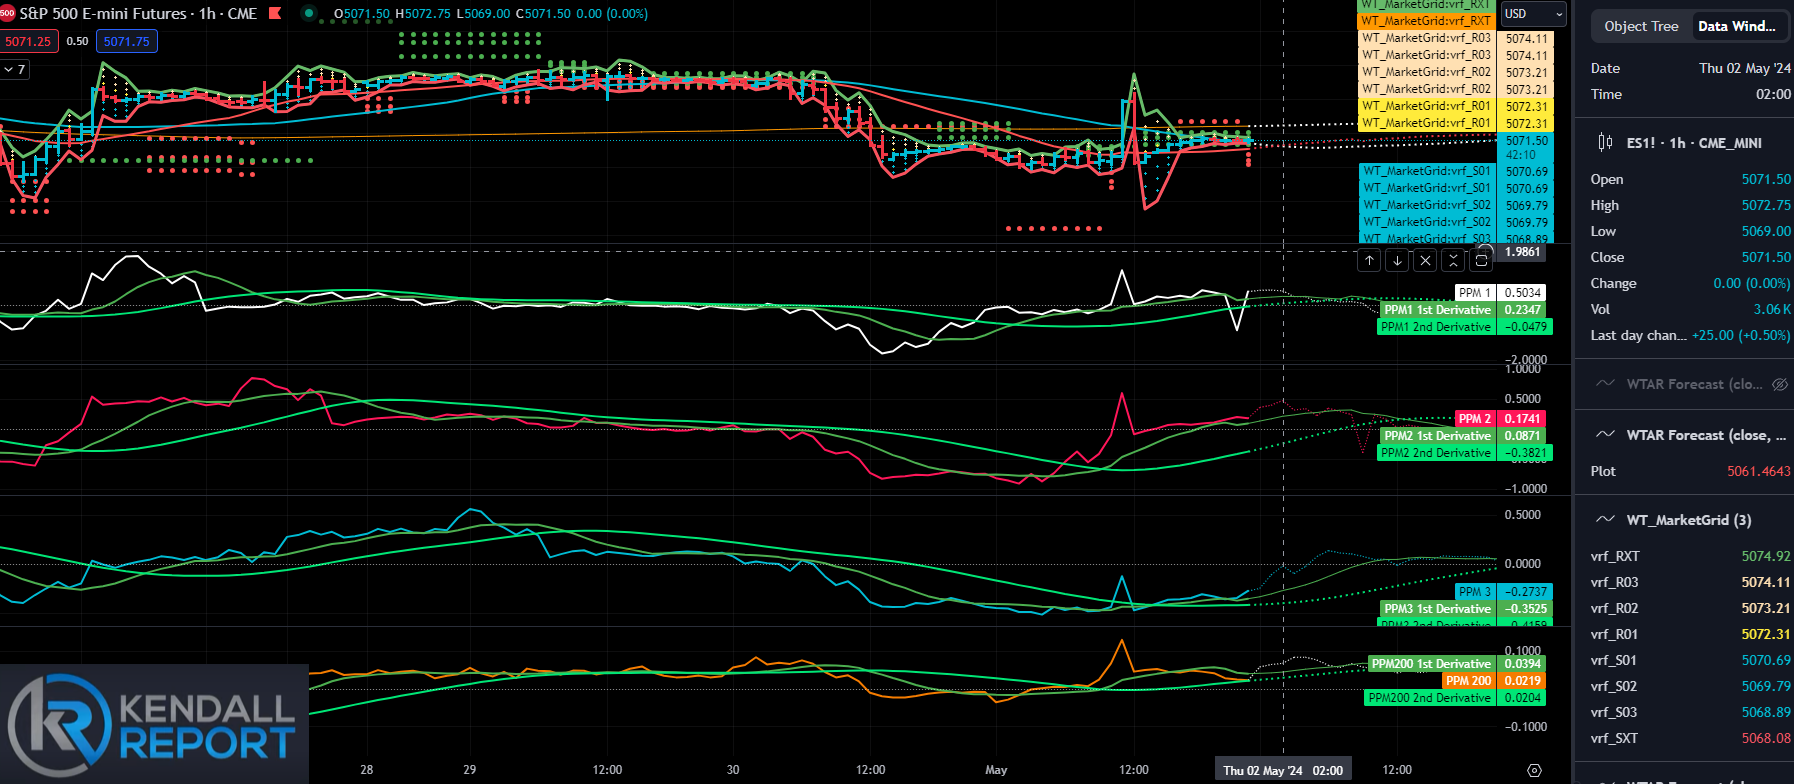
The daily chart reflects significant volatility over the past two sessions, with the market failing to sustain above the 21-day moving average and closing below the STX level. This typically indicates a potential sideways to upward movement in the following days. However, the Fed's announcement influenced a temporary intraday rise, ultimately leading to a close in the negative.
Looking ahead, the overnight trends suggest a continuation of this volatile pattern. Algorithmic projections indicate a potential rally towards the 21-day moving average, currently at 5128, contrasting with yesterday's rejection at 5126. As we approach Friday, market stability might improve, hinting at an upward adjustment in the market grid.
For the S&P, it's crucial to monitor specific levels: last Thursday's low at 5022, where we observed significant volatility, and the previous week's low at 4963. These levels are key in understanding the current market pattern, which suggests more volatility and the possibility of an expanded trading range for the next three to five days. A close above 5083 on Thursday would signal a possible recovery. Thursday's market behavior will be particularly interesting to observe.

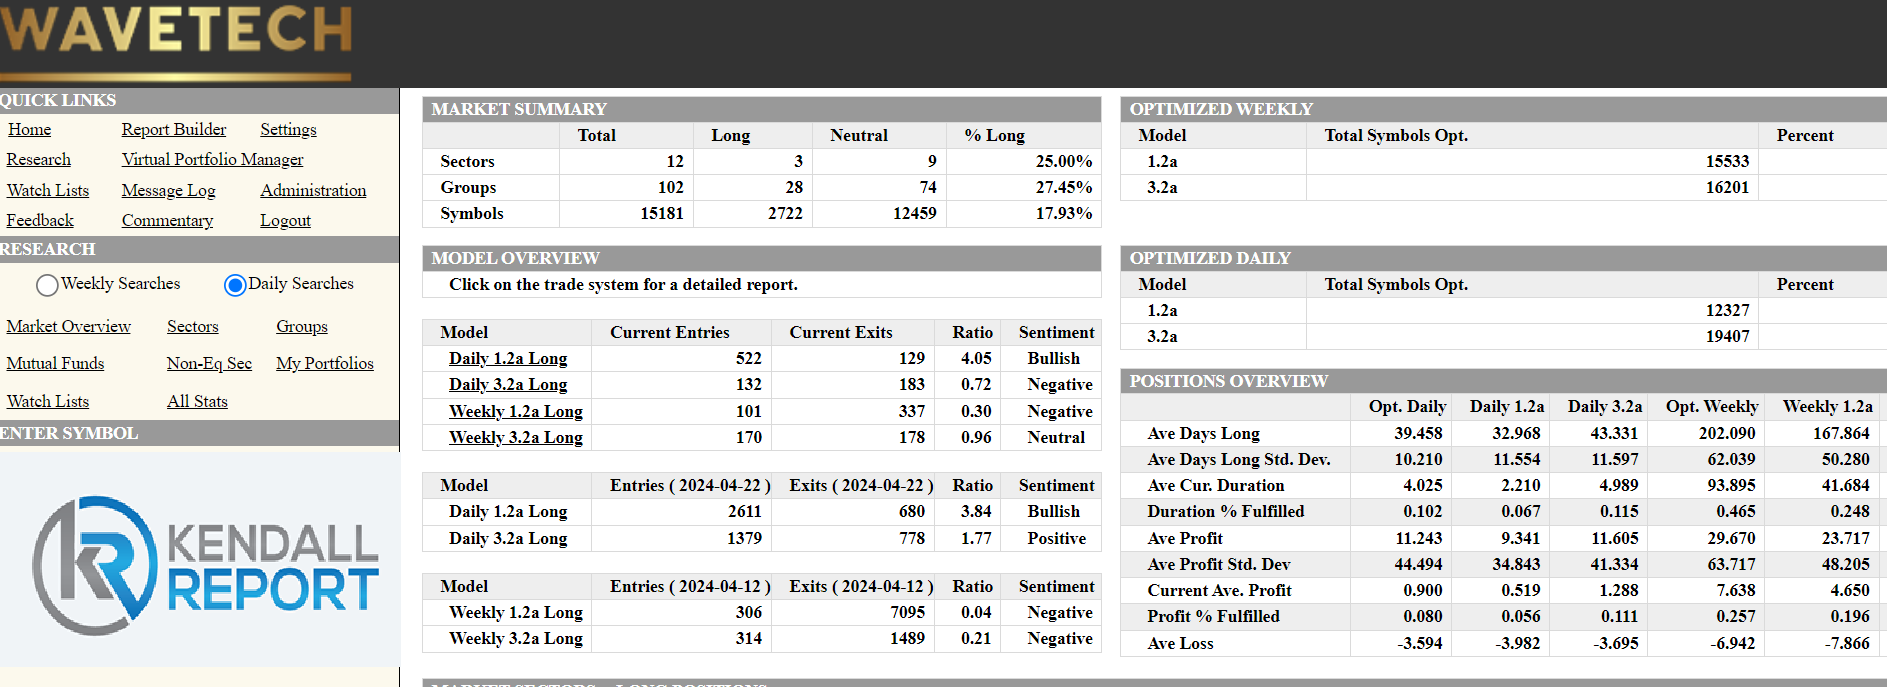
WaveTech Database
As the week progresses, we're observing a continuation of the choppy pattern in the markets, reflected in our database updates with 654 new entries and 312 exits. This ongoing rotation indicates a lack of momentum towards establishing a stable bullish trend.
Historically, I've noted that a bullish percent of at least 22% is essential to stabilize short-term trends and alleviate downward pressure. However, surpassing this threshold doesn't guarantee a significant market rally, as resistance levels may pose challenges.
For the past three weeks, the bullish percentage has remained below the 22-28% range, suggesting that this pattern of uncertainty may persist. Based on my analysis, I anticipate May could remain challenging for the equity markets.
NASDAQ Futures
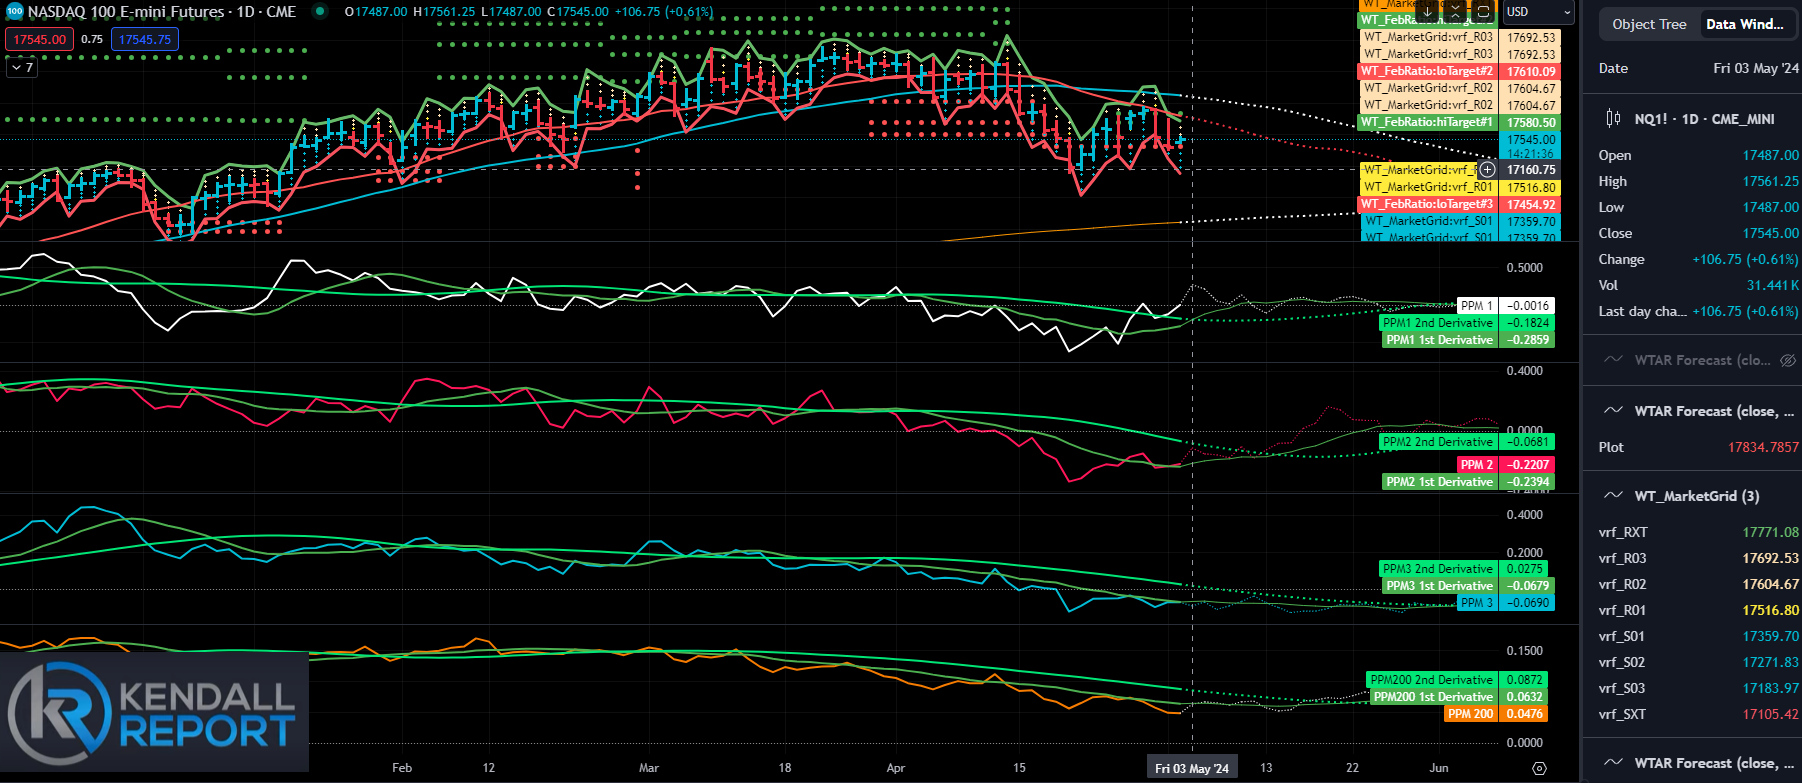
After reviewing the daily chart for NASDAQ, we observed a configuration similar to that of S&P. The market is attempting a rally, indicated by an overnight gain of about half a percent, suggesting a potential move towards the 21-day moving average.
This average has previously rejected prices three times, and there's a Fibonacci target just above at 17,869, while the current average stands at 17,008.34. This allows for a spike above this level, supported by algorithms predicting at least a two-day rally before potentially flattening out next week.
This pattern seems to form a minor bottom, similar to the S&P, with critical levels to watch. The first key level is 17,308, and the lower crucial level is 17,113. These levels will act as trigger points for potential sell-offs. However, current indications suggest these levels will likely hold for the next three to five sessions.
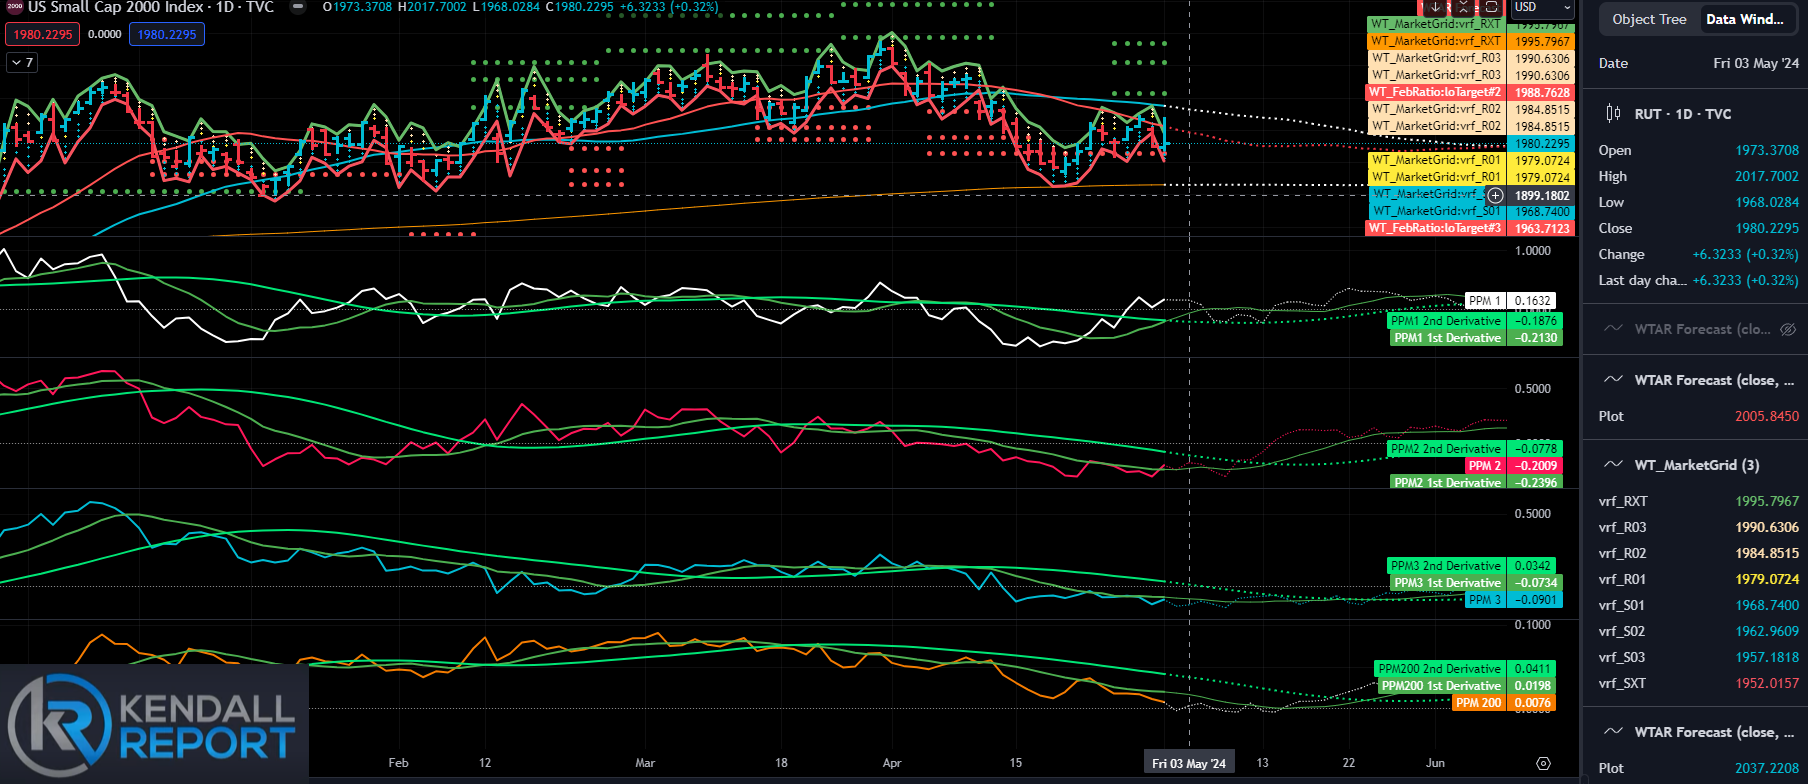
Russell
Yesterday's activity in the Russell Index was notable as it was the only index to close in positive territory amidst slight declines in interest rates. Observing the RTY futures, we see a pattern where the 21-day moving average serves as a critical resistance point, currently at 2016.
The current trade was at 2007, nearing this resistance level. A break above 2016 could open the potential for movement towards the 2051 level, aligning with a Fibonacci target also positioned at 2050.
Additional extended targets are set at 2101 and 2133. Like the S&P and NASDAQ, algorithmic predictions suggest a few days of upside, followed by stabilization and potential further gains.
The levels to watch include the 21-day moving average in 2016 and the 40-day moving average in 2051, which coincides with the Fibonacci targets.
On the downside, the critical support levels are at 1965 and 1915. There seems to be a potential bottoming pattern forming, with two additional Fibonacci targets on the upside at 2101 and 2133, marking the extreme targets.
Treasuries
In my initial remarks, I noted that the markets had not reacted to the reduction in quantitative tightening (QT) from $60 billion to $25 billion. While the equity markets remained unaffected, the treasury markets reacted significantly, evidenced by a noticeable drop in yields. Last night,
I discussed that I anticipated yield levels to decline around 4.55%; we observed a low of 4.58% and a close at 4.59%. We expect further declines towards 4.55% and possibly below 4.50% in the coming sessions.
Weekly trend algorithms indicate a stabilizing yield range of around 4.50%. However, as we progress through May, yields might decrease further. This decline could result from reduced QT sales and potential economic deterioration.
Despite the Federal Reserve's primary focus on labor, visible weaknesses are emerging in the economy's output, which raises concerns.
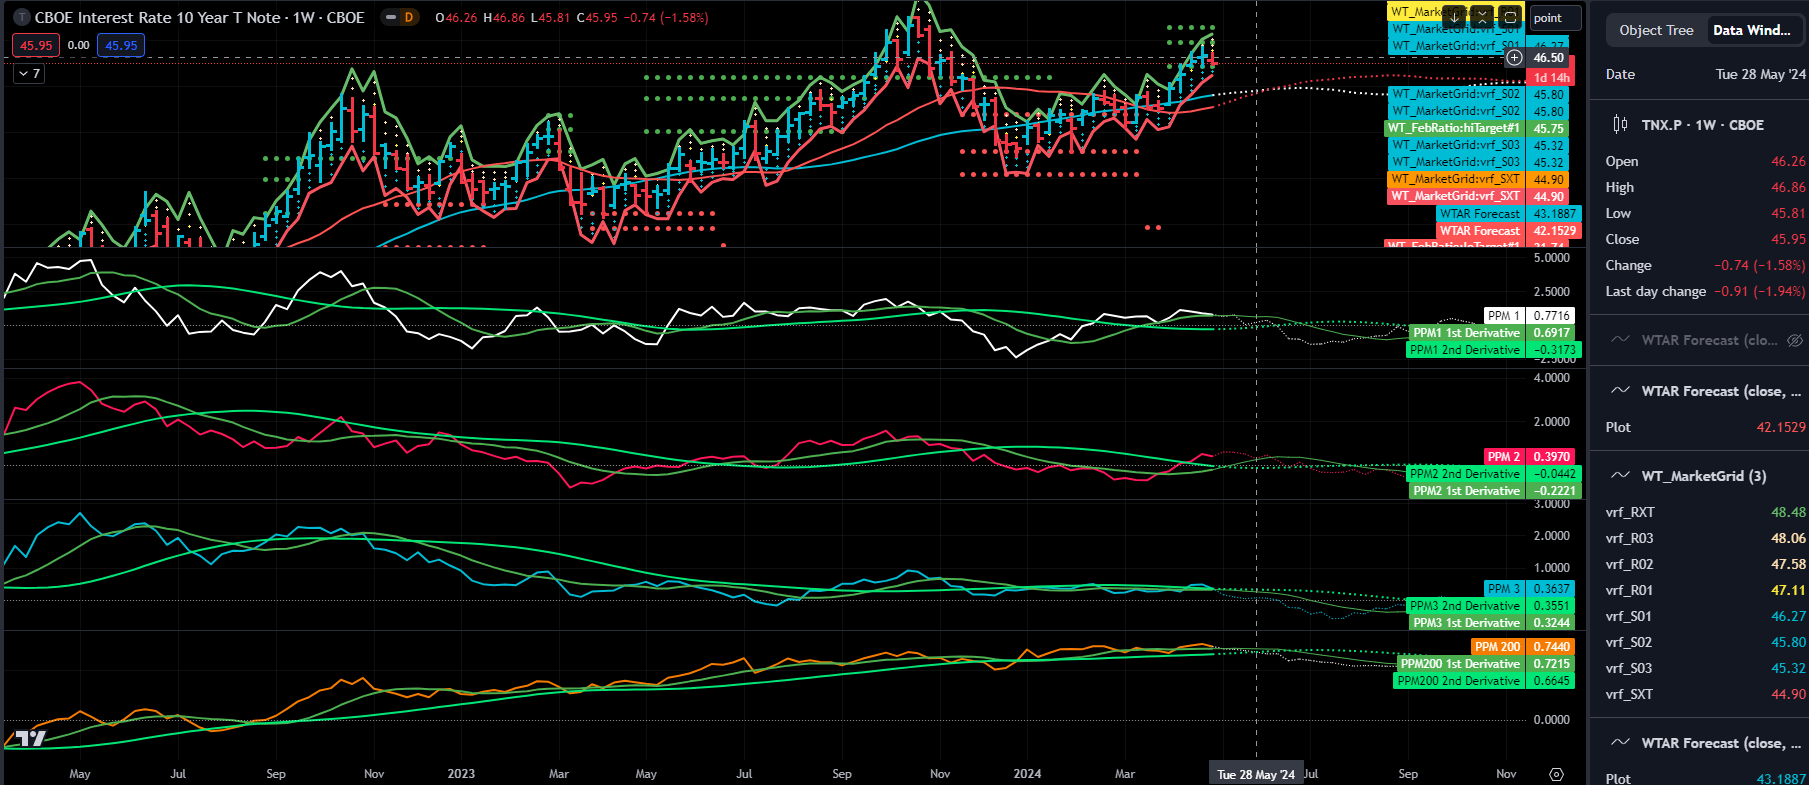
The combination of lowered QT and economic softening might drive yields down towards a level I particularly watch—between 4.332% and 4.25%.
For now, stability around 4.50% seems likely, with a ceiling no higher than 4.79%. Although we may see spikes and fluctuations, the overall trend should flatten and retreat over the next few weeks.
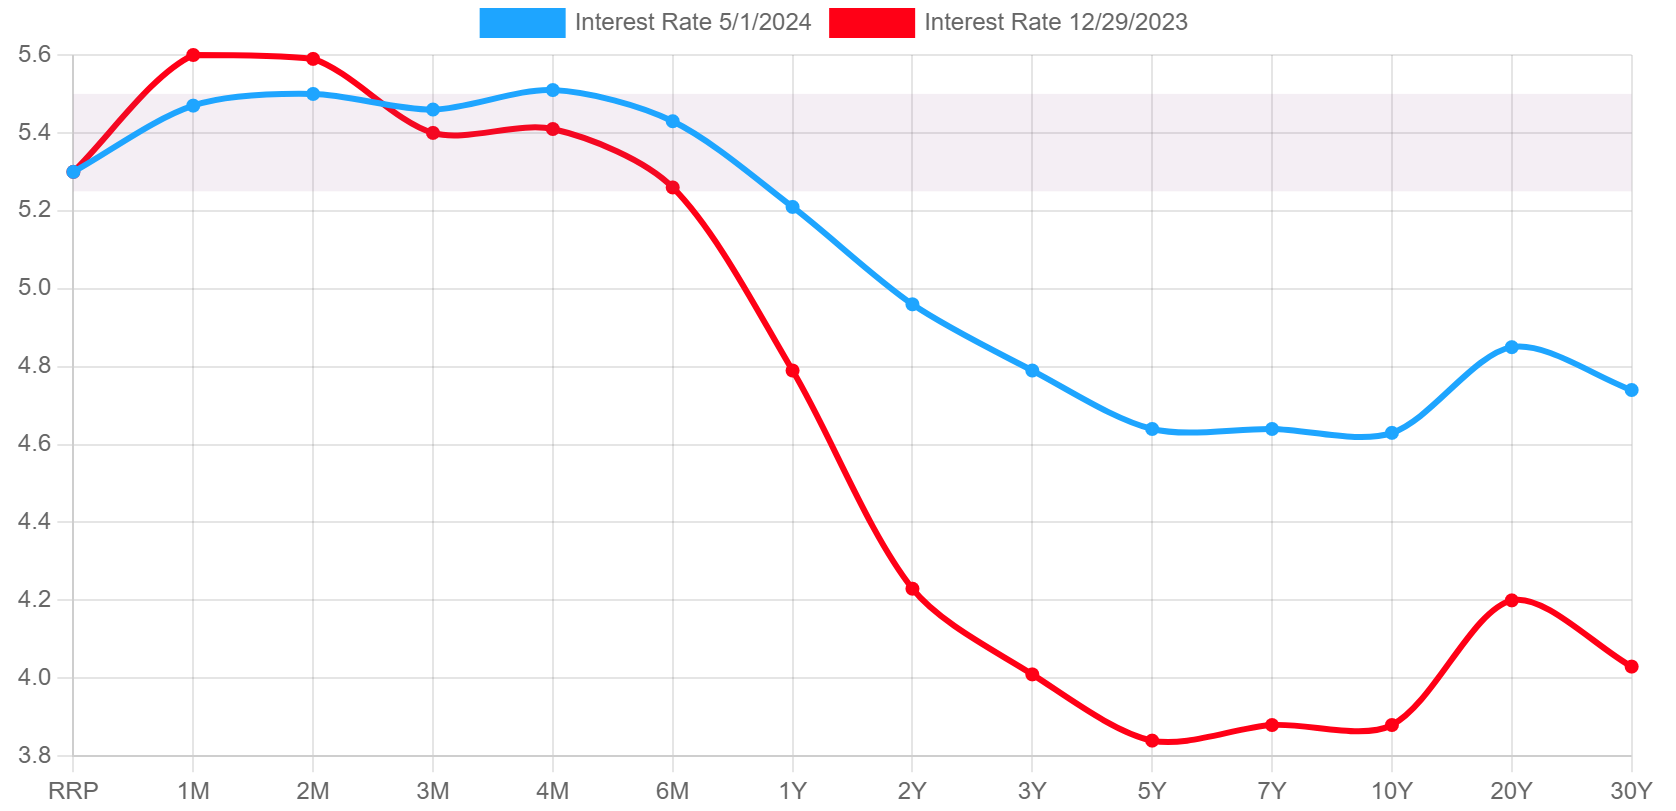
Current Yield Curve Vs Begining of 2024
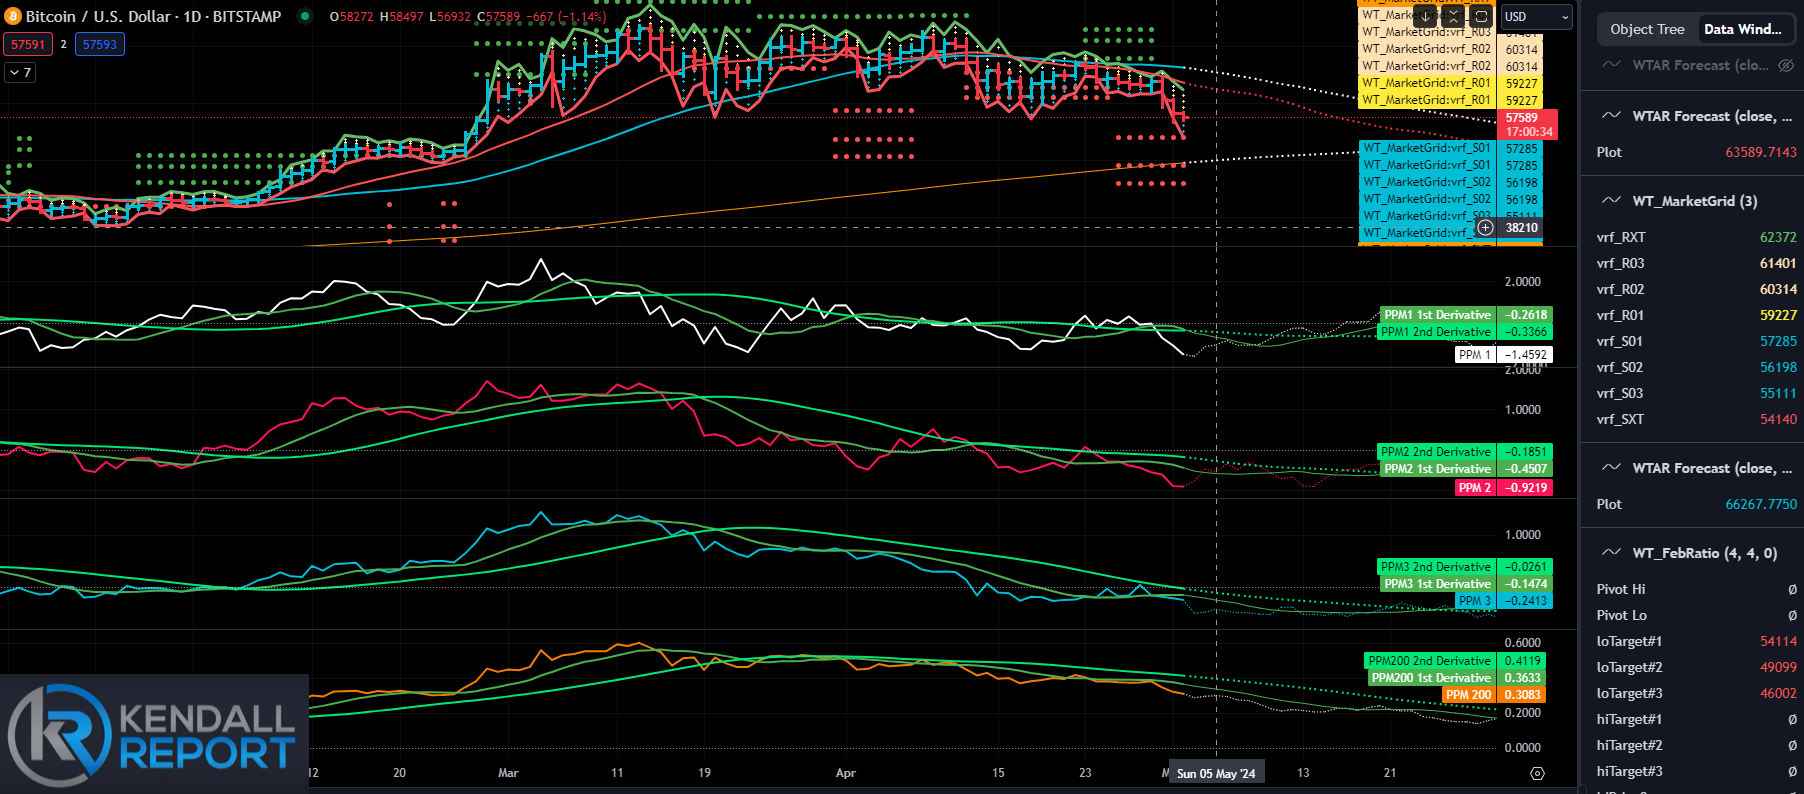
Bitcoin
Bitcoin continues to face significant downward pressure on its prices. As I've mentioned before, there was a widespread consensus—nearly 90%—that the halving event, which had been anticipated for three years, would trigger a market rally.
This type of consensus is common in the cryptocurrency markets, which often exhibit a meme-like environment where the echo of popular sentiments can drown out rational analysis. However, technical indicators provide a clearer and more reliable picture, so I focus on them rather than the noise.
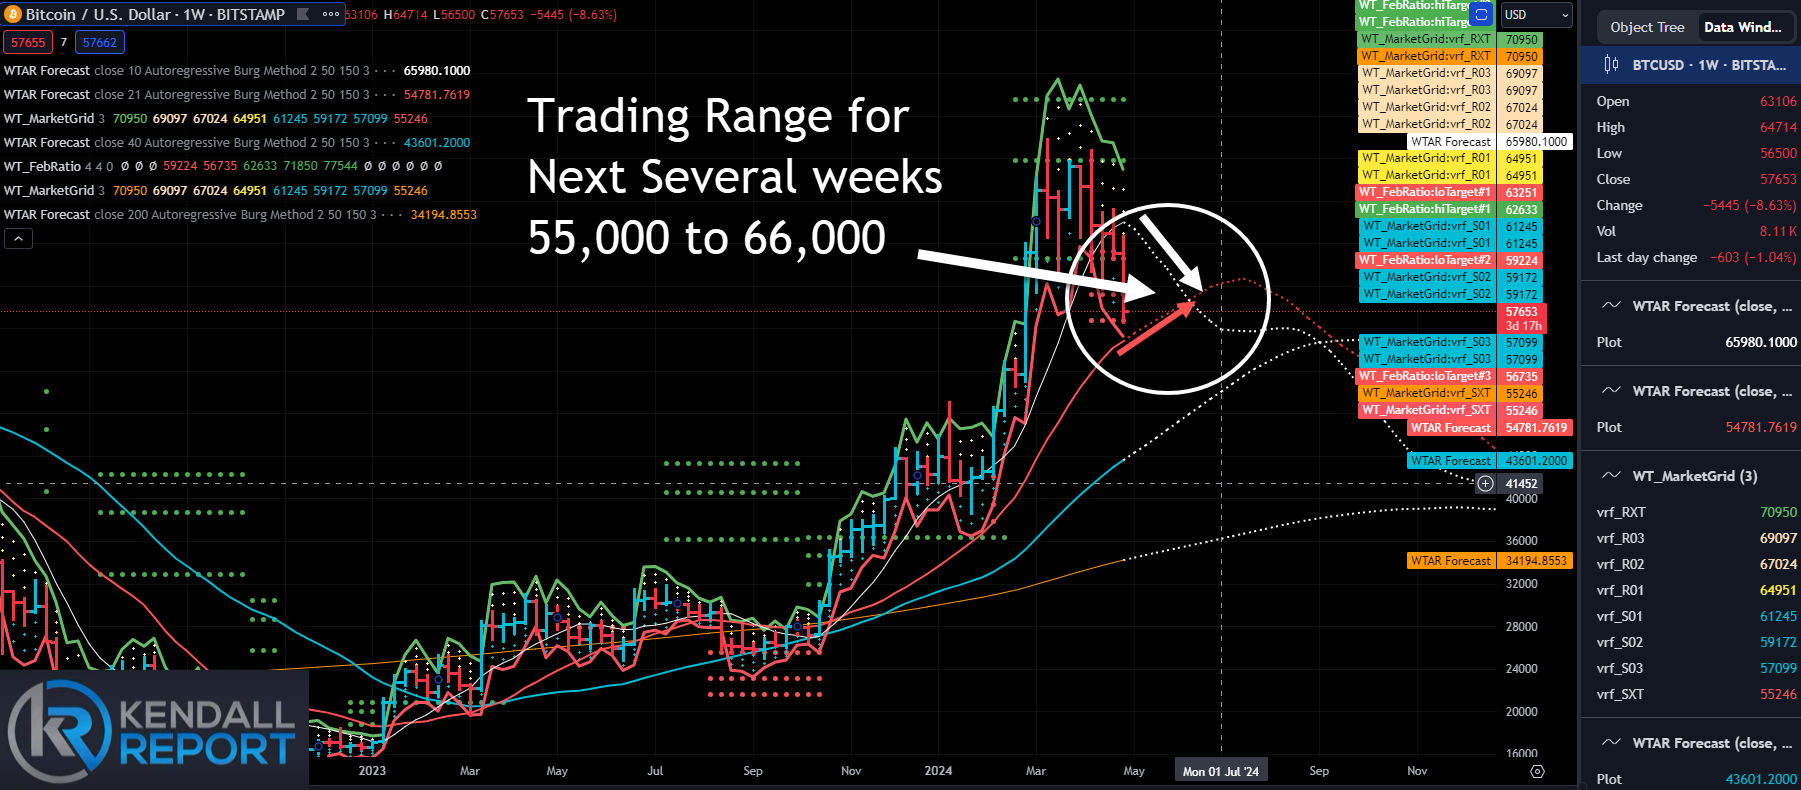
From a technical perspective, we may currently be at the low point of this downward trend. There's potential for movement to an extreme level between 54,100 and 55,100, which marks the likely target range for a low of this sequence. We should see a bounce from this range, although weekly trends suggest significant challenges.
The weekly chart indicates that despite the downward trend, we still have a robust PPM 2 at a level of 1.21, suggesting a 90% probability that Bitcoin will hold at the 21-day moving average of 54,779. A rebound from the recent sell-off is likely as many investors are looking to buy in, but this rebound may not signify the end of the current negative pattern.
Bitcoin would need to rally back to at least 61,200 for a positive shift in the weekly market trend. If it reaches this level on the weekly chart, there is hope that it will continue to trade around the 21-day moving average. The trading range is expected to remain below the 10-day moving average and above the 21-day moving average for the next four to six weeks. The chart provided below illustrates the expected trading range.
Robert Kendall
Chief Analyst
Disclaimer for “The Kendall Report
The information provided in "Th Kendall Report" is for general informational and educational purposes only. The opinions, analyses, and forecasts included in this newsletter are based on the author's personalviews and experiences and are provided as is without warranty of any kind.
While we strive to provide accurate and up-to-date information, we do not guarantee the accuracy, completeness, reliability, or timeliness of any information contained in this newsletter. The information presented should not be construed as financial, investment, legal, or other professional advice. It does not constitute a recommendation or endorsement of any particular investment strategy, financial instrument, product, or service.
Investors should consider their financial situation, objectives, and risk tolerance before making investment decisions based on the information provided. The financial market is subject to high risk and volatility. Past performance is not indicative of future results. Investing in the financial market involves the risk of loss, including the loss of principal.
"The Kendall Report" and its contributors will not be liable for any direct, indirect, incidental, consequential, or exemplary damages arising from the use or inability to use the information provided in this newsletter, including but not limited to losses or missed gains.
By accessing and using "The Kendall Report," you acknowledge and agree to this disclaimer and assume full responsibility for the use of the information provided. We reserve the right to make changes to the content of this newsletter at any time without notice.
This disclaimer is subject to change at our discretion, and it is the reader's responsibility to review it regularly for any updates.
Thank you Bob. What do you think of my speculation that the reduction in QT is to help our Japanese friends sell more of their US treasury holdings to support the Yen. Full bore QT plus Japanese dumping of US treasuries would drive up longer term interest rates in the US, impacting banks, small business, housing and the overall economy. Cutting QT makes sense from this perspective and no other, to me. Your reasoning for QT? Powell did not answer the question asked on why the QT cut.
Thanks Bob , late one last night , thank you for your dedication.