


Free Edition! "Fed's Quantitative Tightening: The Hidden Strategy Behind Powell's Economic Balancing Act"
"Decoding Trump's Trade Strategy: From 'Deals Are Coming' to 'Deals Aren't Necessary'"

KR Opinion
As we approach today's Federal Reserve announcement, market expectations remain subdued. While analysts typically dissect every word from the Fed, we are witnessing perhaps the most independent Federal Reserve in recent memory. The notable tension between Chairman Powell and President Trump effectively eliminates any possibility of politically motivated decisions from the central bank. Moreover, current economic conditions do not necessitate any significant policy shifts.
Overnight markets show positive movement following news that Chinese and American representatives will begin negotiations. Although we remain far from a comprehensive trade agreement, the mere announcement of talks generated an initial 1% market increase, which has since settled to approximately 0.5% overnight. It's worth noting that markets have essentially returned to their pre-tariff announcement levels from three weeks ago.
It seems fitting that the Federal Open Market Committee meeting concludes today with a conference call. Based on Powell's remarks after the tariff announcement, he appeared somewhat pessimistic regarding the inflationary impact of tariffs, yet he refrained from suggesting any immediate policy response would be necessary.
We should remember that the Fed continues implementing its Quantitative Tightening (QT) program, selling securities while maintaining elevated rates at the longer end of the yield curve. This approach appears deliberate - selling treasuries through QT can keep long-term interest rates elevated while gradually allowing mortgage securities to diminish naturally through regular payment schedules. This creates a balanced effect where new money enters the market while the ongoing QT exerts contractionary pressure.
Given these circumstances, the Fed is unlikely to make significant policy adjustments. Although recent employment figures have declined slightly, we've also witnessed a reduction in immigration and other shifting economic indicators. For instance, the most recent employment report showed that private sector job creation outpaced government positions for the first time in four years. Previously, government employment expansion and immigration had bolstered economic statistics, creating what some perceive as an artificially positive impression of economic strength. While many individuals express skepticism about the economy's true health relative to reported figures, market participants generally respond to official statistics rather than challenging their validity.

I want to expand on a thought experiment: What if the tariff strategy had never been announced? Some tariffs remain in place, and specific measures have been implemented, but nothing substantial has materialized yet. This connects to the Fed's position—they lack sufficient data to determine how economic conditions evolve. The potential impact of proposed tariffs isn't particularly relevant since they haven't been implemented. Looking back to the economic landscape before these announcements, markets were already showing signs of decline during the first few months following Trump's inauguration.
What we're experiencing now may continue that earlier trajectory. Suppose we remove the noise of tariff discussions and ask what we would expect from markets had nothing changed. In that case, we might conclude we're merely witnessing the natural progression that was already underway. Despite ongoing negotiations and considerable rhetoric, no concrete agreements have materialized, and we remain uncertain whether any deals will eventually be reached. President Trump recently stated that deals may never materialize, shifting dramatically from earlier proclamations of successful agreements to suggesting they might be unnecessary. This inconsistency in messaging from the White House creates confusion that is difficult to interpret charitably.
The fundamental economic situation remains essentially unchanged, though perhaps slightly softer than before - a direction it was already heading as we entered the year. I've been discussing this trend for approximately five months now. Essentially, markets are behaving predictably amid considerable background noise. While a positive development in trade negotiations with Treasury Secretary Mnuchin might generate a market rally, such outcomes remain speculative.
We're primarily observing market noise, which lacks substantive economic developments to provide clear direction. Until concrete developments emerge, we should expect continued market fluctuations and relatively high volatility. Should volatility spike, we may need to reset and normalize market conditions yet again. Over the past three weeks, markets have finally normalized with robust order books and strong liquidity; however, this stability could rapidly disappear depending on tomorrow's Fed announcement. Although expectations remain minimal, a single comment could trigger significant market movements, potentially causing price spikes, erratic behavior, and diminished liquidity – elements we've witnessed repeatedly in recent weeks.
I expect markets to maintain current patterns until more conclusive data becomes available. Given that we're in May, we likely won't see meaningful economic indicators until July. In the interim, we will continue facing considerable rhetoric as the administration's position has shifted from pursuing deals to suggesting they're unnecessary— a puzzling transition complicating any attempt to discern the administration's actual strategy. Perhaps generating confusion before providing clarity through an eventual agreement represents the intended approach, but this remains purely speculative. In truth, no one can confidently predict how these events will unfold.
WaveTech Database
The WaveTech Database is showing strong bullish momentum. We've moved decisively above the critical 42% threshold, now registering 54.28% long positions. This significant upward movement places us firmly in sustainably bullish territory, with eight sectors now positioned long. As we've surpassed the 52% marker, our attention turns to the next critical resistance range of 58-62%, indicating whether we're approaching full investment mode.
The daily metrics from the WaveTech models reveal compelling activity, with 7,918 total positions in play. Of particular note is the robust ratio of new entries to exits, with the Daily 1.2s Long showing 81 new entries against 137 exits, while the Daily 3.2s Long recorded 1,554 entries against 139 exits. This substantial net inflow into the 3.2s models suggests increasing conviction in longer-duration positions.
Looking at sentiment indicators, all daily models are registering bullish readings. The Daily 1.2s Long maintains a moderate ratio of 0.59, while the Daily 3.2s Long shows a more robust 10.84 ratio, clearly indicating a stronger bullish commitment in longer-timeframe positions. Current profit metrics are also encouraging, with Average Profit figures of 11,095 for Daily 1.2s and 41,994 for Daily 3.2s, demonstrating healthy returns on existing positions.
Sector analysis shows particularly strong performance in Basic Materials (+2.944%), Capital Goods (+2.472%), and Transportation (+7.175%), all maintaining "Accumulate" status. These sectors are showing signs of approaching maturity in their current cycles, but have enough upside momentum to continue their advance. With its +3.969% gain and 88 days held, the Technology sector appears poised for a potential acceleration phase if broader market strength continues.
One concerning signal comes from the Energy sector, showing a -0.971% decline. This underperformance bears watching as energy often serves as a leading indicator for broader market shifts. However, with only 2 of 40 positions at risk, this appears contained for now rather than systemic.
Based on probability analysis of the daily data, there's approximately a 70% likelihood that the market will test the 58% level within the next 10-15 trading days. If macroeconomic conditions remain supportive, we could see an accelerated move toward the 62% threshold, signaling a transition into a complete investment phase, potentially reaching the 70-78% range.
The WaveTech models suggest maintaining long positions with selective new entries on minor pullbacks. With total daily symbols optimization at 12,333 positions and a bullish percentage of 58.80%, the database indicates continued upside bias for the next 15-20 trading days. This configuration supports a firm market stance, though traders should remain vigilant for any deterioration in the Energy sector as a potential early warning sign.

S&P 500 Futures
Based on the overnight S&P 500 Futures (ES1!) data, the market shows strong bullish momentum, with eighty-five percent of WaveTech indicators signaling strongly bullish sentiment. The futures experienced a significant rebound from yesterday's decline, registering a positive gain of 0.80% (+44.75 points) to reach 5659.75, with a high volume of 111K contracts traded. This price action represents a bullish reversal signal that could indicate further upside potential.
Futures spiked overnight as news of upcoming China meetings this weekend encouraged market participants, suggesting continued US-China dialogue. The market has been consolidating in a tight range over the last four to five sessions, with 5837 emerging as a key level—trading above this would negate near-term downside pressure and establish a tone for higher prices.
WaveTech's technical structure assessment shows a primary trend characterized as "Bullish With Strong Bounce" with a robust trend strength rating of 7/10. Momentum is classified as "Strongly Positive," while volatility remains high with two divergences detected. The price has broken above the R02 resistance level (5655) with upside momentum, forming a higher low pattern at 5608 above the previous close.
The Price Pressure Momentum indicators (PPMs) display strong positive readings, with PPM1 at 0.44 and PPM2 at 0.47, confirming the bullish bias. The second derivatives are also positive, at 0.45 for PPM1 and 0.05 for PPM2, indicating acceleration in the upward momentum. Having crossed the critical 0.25 threshold, these PPMs have entered trend mode, suggesting that the bullish configuration should be maintained as long as they remain above 0.15.
Support and resistance probabilities indicate R02 at 5655 with a ninety-five percent probability of holding, while the R03 target at 5676 has a seventy-five percent chance of being reached. The current price at 5659 rests at the pivot point, with first support at 5634. The Fibonacci projection identifies 5676 as a seventy-five percent probability target level.
WaveTech's Trading Opportunity Forecast indicates that the highest-probability trade is an R03 breakout target at 5676, with a sixty-five percent probability and a risk/reward ratio of 11.5. The alternative scenario suggests a potential pullback to 5623 (fifty-five percent probability), with strong support at 5595.
This overnight price action, combined with the positive Price Pressure Momentum indicators and bullish technical structure, suggests continued upward momentum with the 5676 level as the next significant target. However, traders should remain cautious of the high volatility environment, with careful attention to the critical 5655 support, which must hold to maintain the bullish outlook.

NASDAQ Futures
The NASDAQ futures (NQ1!) are displaying strong bullish sentiment overnight, with the market direction indicator at 88%, which is considered strongly bullish. The current price is 20,009, up 162.25 points (+0.82%) on a high volume of 79.05K. WaveTech Market Analytics data suggests a significant overnight rebound from yesterday's decline, resulting in a bullish reversal signal.
The futures have broken above the critical R01 breakout level of 19,930, demonstrating upside momentum. This breakout is particularly significant as it occurred with high trading volume, reinforcing the bullish bias. The primary trend remains bullish with strong momentum, scoring 8/10 on trend strength according to WaveTech Models.
Price pressure momentum indicators (PPMs) confirm the bullish outlook, with PPM1 at 0.5898 and PPM2 at 0.5965, both in strong trend mode and well above the critical 0.25 threshold. The first derivatives are also positive, at 0.5914 and 0.1476, respectively; however, PPM3 shows a maintenance reading of 0.0788 with a negative first derivative of -0.0774, suggesting that some resistance may develop in the intermediate term.
The technical structure assessment indicates the market is in an R01 breakout with an R02 test configuration. Price has created a higher low pattern at 19,799, above yesterday's close. The current cycle is set for a potential test of the R02 level at 20,023. Volatility remains high, with two divergences detected in the WaveTech Models.
The support/resistance probability grid indicates strong confidence in the key levels, with the R02 target at 20,023 showing an 85% probability. The most critical resistance level (vr_RXT) is at 20,200 with a 90% probability threshold. The current price at 20,009 exhibits a 100% support probability, with the pivot point precisely at this level.
Fibonacci projection analysis targets 20,116 (70% probability), with potential pullback targets at 19,885 (60% probability) and 19,818 (50% probability). These levels align closely with the support/resistance grid, reinforcing their significance as key technical markers.
The trading opportunity forecast from WaveTech Analytics suggests the highest probability trade is an R02 breakout target at 20,023 with a profit target of 20,116 (risk/reward ratio 1:1.9). At the same time, the alternative scenario shows a pullback to 19,885 targeting 19,763 (risk/reward 1:0.9).
With overnight price already testing the R02 level and PPM1/PPM2 readings strongly positive, the immediate outlook appears favorable for additional upside, though traders should be prepared for potential short-term volatility given the high oscillation in the momentum measurement system.

Gold
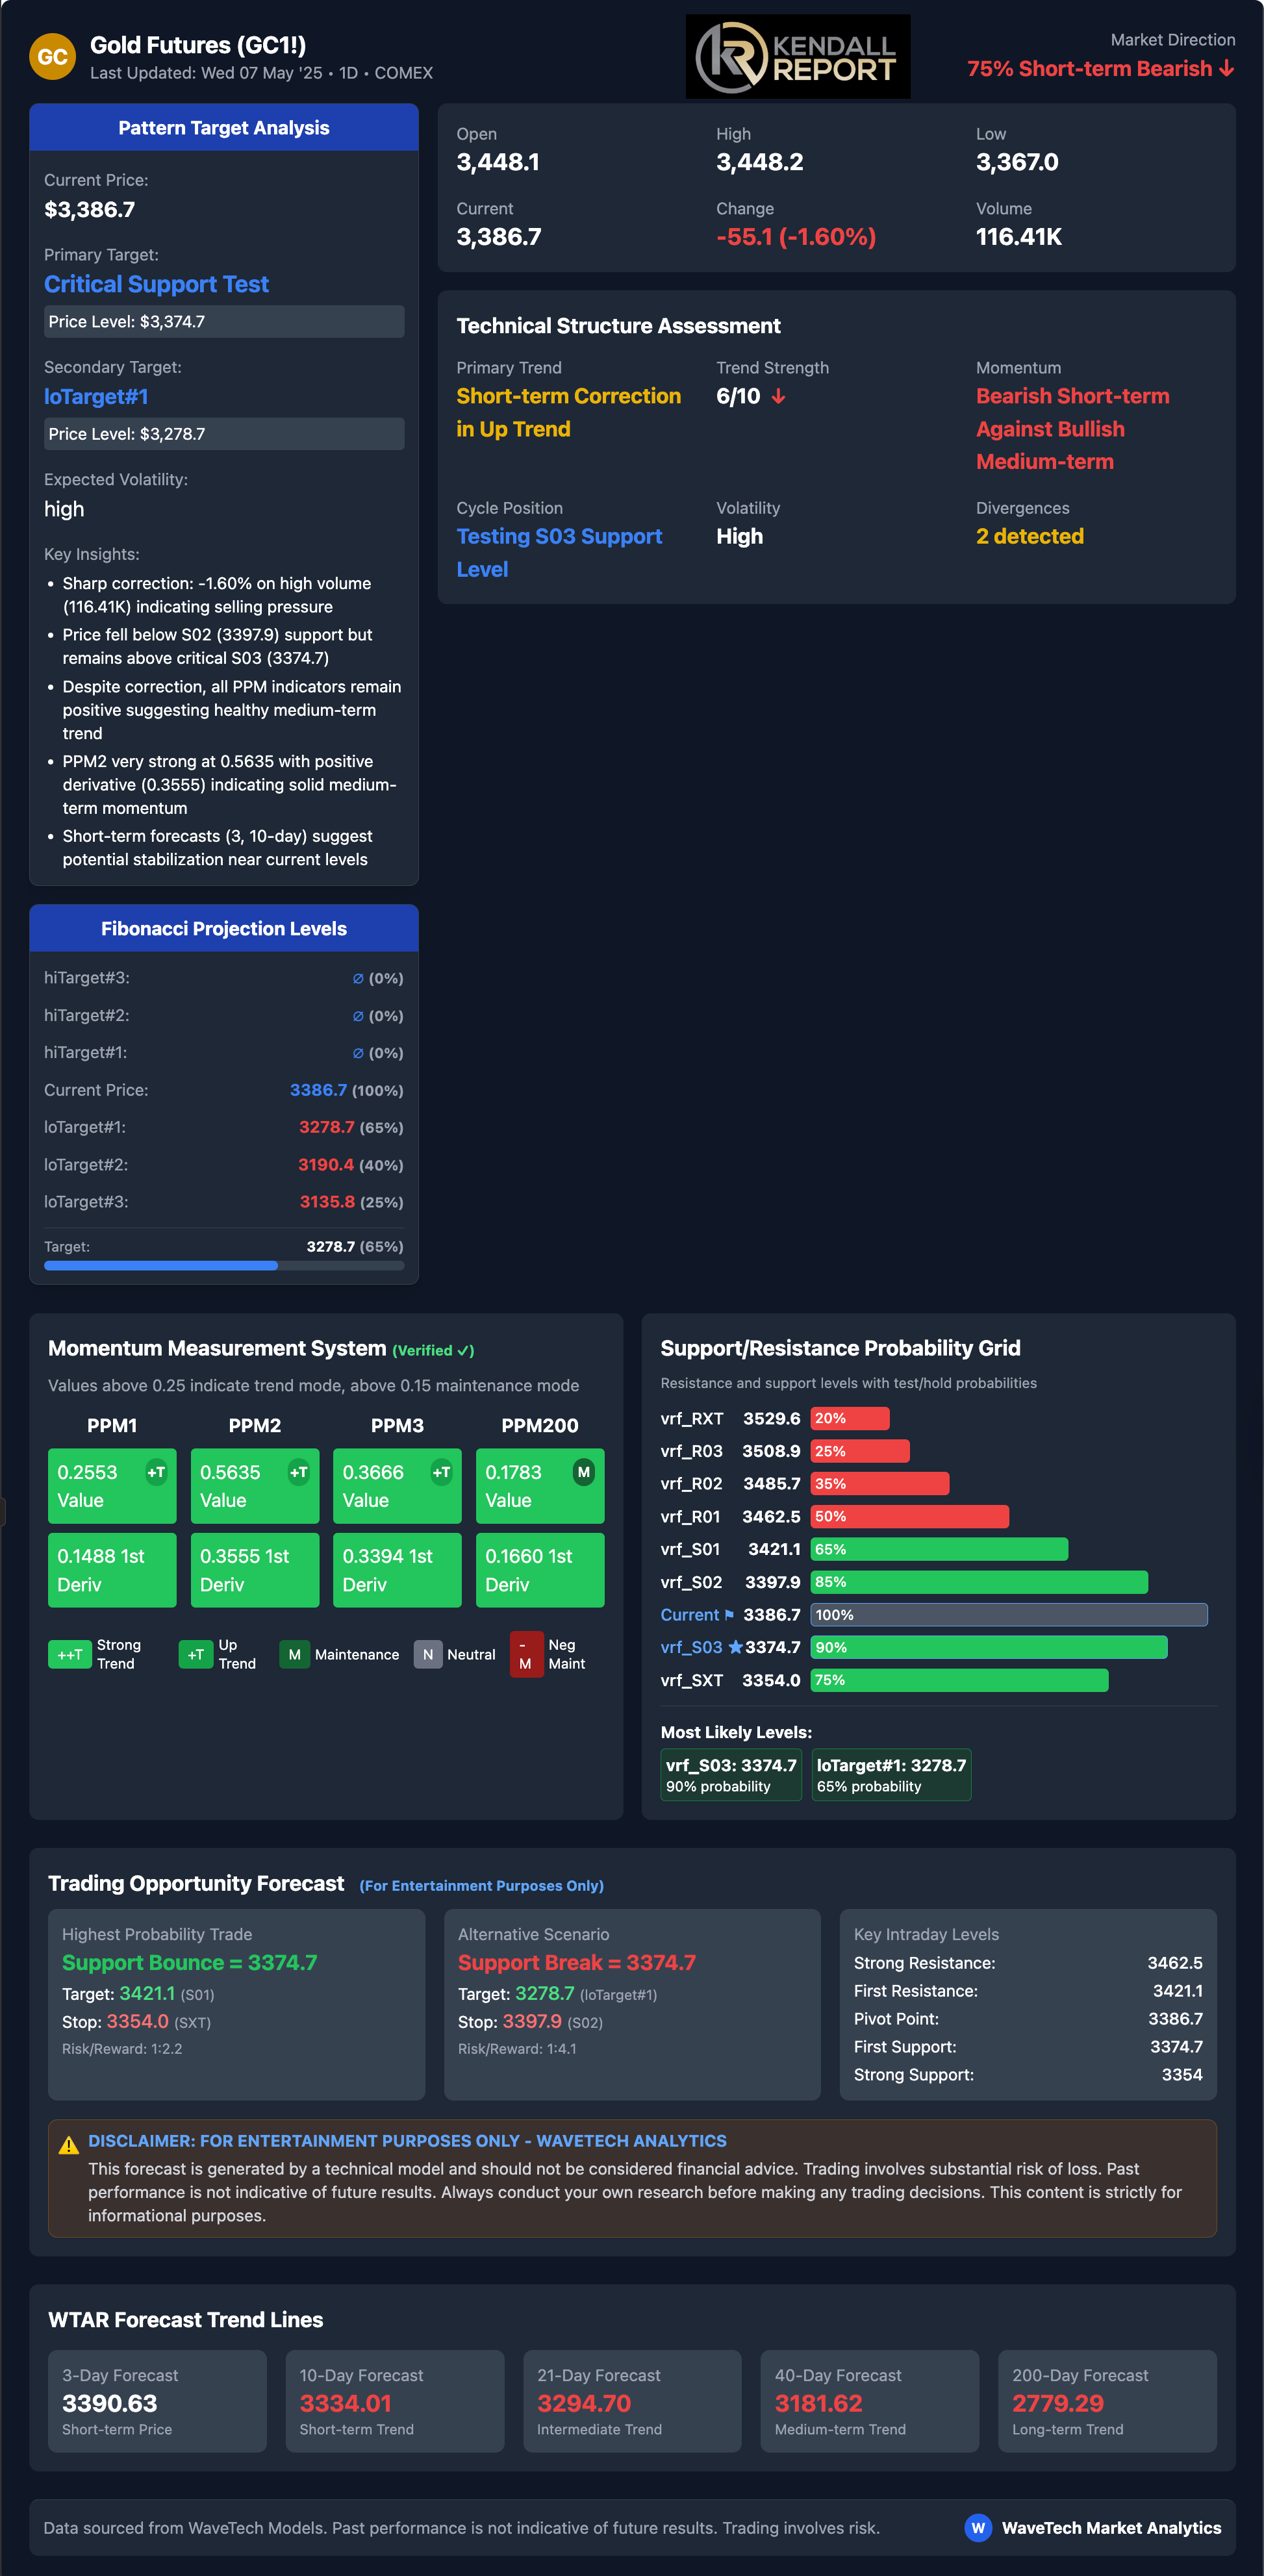
Gold futures experienced a sharp correction of -1.60%, accompanied by a high volume of 116,410 contracts overnight, indicating significant selling pressure. The price fell below the 3397 support level but remains above the critical 3374 mark. Despite this correction, all price pressure momentum (PPM) indicators remain positive, suggesting a healthy medium-term trend. PPM2 is particularly strong at 0.5635, with a positive derivative of 0.3555, indicating solid medium-term momentum. Short-term forecasts (3-10 days) from WaveTech models suggest potential stabilization near the current level of 3386.
The primary trend indicates a short-term correction in an overall uptrend, with trend strength rated 6/10. Momentum is bearish in the short term against bullish in the medium term, with two technical divergences identified. Volatility remains high as the price currently tests the S03 support level. Analyzing the Fibonacci projection levels, the current price of 3386 (100%) tests Target#1 at 3278 (85% probability). The WaveTech support/resistance grid shows vrf_S03 at 3374, which has a 90% probability of being the most critical support level now under examination.
Despite this correction, all PPM indicators remain in trend mode (above 0.25) with solid maintenance levels (above 0.15), suggesting that the overall uptrend structure remains intact. The WaveTech ML models indicate that the 3374 support level has approximately a 90% probability of holding, which would maintain the primary uptrend configuration.
Bitcoin
The Bitcoin market is exhibiting strong bullish momentum in premarket trading, with the current price at 96979, up 165 points (+0.17%). Technical analysis from WaveTech Models indicates that we are at a critical juncture, with the price approaching the key R01 resistance level at 97388, which, according to support/resistance grid measurements, carries an 85% probability of interaction.
All three price pressure momentum indicators (PPMs) are firmly in uptrend territory above 0.25, confirming strong technical strength. PPM2 is particularly robust at 0.6686, with a potent second derivative of 0.7130, confirming the acceleration in trend momentum. The current price is within striking distance of the R01 resistance level, setting up a potential breakout scenario that could trigger significant upside if successfully breached.
Short-term forecasts from the WaveTech ML project suggest possible pullbacks, suggesting caution despite the bullish bias. The 3-day forecast shows a price target of 96172, while the 10-day and 21-day forecasts project lower values at 95571 and 92728, respectively. However, the medium to long-term outlook remains constructive with 40-day and 200-day forecasts at 87837 and 90938.
Fibonacci projection levels highlight essential targets with hiTarget#1 at 104505 (25% probability), hiTarget#2 at 108859 (15%), and hiTarget#3 at 111710 (10%). On the downside, loTarget#1 is positioned at 95151 (45% probability), with further support at 94086 (20%) and 93429 (20%).
The most likely price scenarios based on WaveTech's probability grid indicate R01 at 97388 with an 85% probability, R02 at 98031 with a 60% probability, and S01 at 96240 with a 65% probability. Market direction indicators suggest an 82% bullish sentiment, exhibiting a strongly positive short-term bias and showing no divergences detected.
Key intraday levels to monitor include strong resistance at 98031, first resistance at 97388, a pivot point at 96979, first support at 96240, and strong support at 95597. As WaveTech forecasts indicate, each level has a significant probability of interaction and should be closely monitored during today's session.
The market is approaching a key breakout attempt with solid momentum and strong technical structure. The trend strength registers 8/10 with cycle position approaching key R01 resistance. Traders should remain aware of the moderate to high expected volatility as this pattern resolves.

Robert Kendall
Chief Analyst
"Disclaimer for “The Kendall Report
The information provided in "The Kendall Report" is for general informational and educational purposes only. The opinions, analyses, and forecasts included in this newsletter are based on the author's personal views and experiences and are provided as is without warranty of any kind.
While we strive to provide accurate and up-to-date information, we do not guarantee the accuracy, completeness, reliability, or timeliness of any information contained in this newsletter. The information presented should not be construed as financial, investment, legal, or other professional advice. It does not constitute a recommendation or endorsement of any particular investment strategy, financial instrument, product, or service.
Investors should consider their financial situation, objectives, and risk tolerance before making investment decisions based on the information provided. The financial market is subject to high risk and volatility. Past performance is not indicative of future results. Investing in the financial market involves the risk of loss, including the loss of principal.
"The Kendall Report" and its contributors will not be liable for any direct, indirect, incidental, consequential, or exemplary damages arising from the use or inability to use the information provided in this newsletter, including but not limited to losses or missed gains.
By accessing and using "The Kendall Report," you acknowledge and agree to this disclaimer and assume full responsibility for the use of the information provided. We reserve the right to make changes to the content of this newsletter at any time without notice.
This disclaimer is subject to change at our discretion, and it is the reader's responsibility to review it regularly for any updates.