

Free for All... Market Defies Gravity
Free for All... Market Defies Gravity
Bitcoin to move higher

Special Offer: Seminar Replay Available Now!
Before diving into tonight's report, I'm excited to announce the release of the replay of the seminar I conducted last fall. If you own the indicators, this presentation is a must-watch. It's six hours of in-depth content, including edited videos and numerous illustrations for trades, understanding PPMs, and much more. We've substantially reduced the cost, so don't miss out. Click on the graphic below to access the review page and take advantage of this offer. I hope you find it incredibly useful!

KR Opinion
Thursday evening's presidential debate seems to have delivered a significant dose of reality. Tomorrow's White House daily briefing promises to be a must-watch TV, potentially the weekend's highlight. Despite the media frenzy, market reactions have been positive.
The markets have been fluctuating within a sideways, sloppy range, almost reaching new all-time highs but lacking the momentum for a decisive breakout.
In yesterday's report, I explored the possibility of the markets rolling over, and that remains a solid probability, though the market is currently defying gravity.
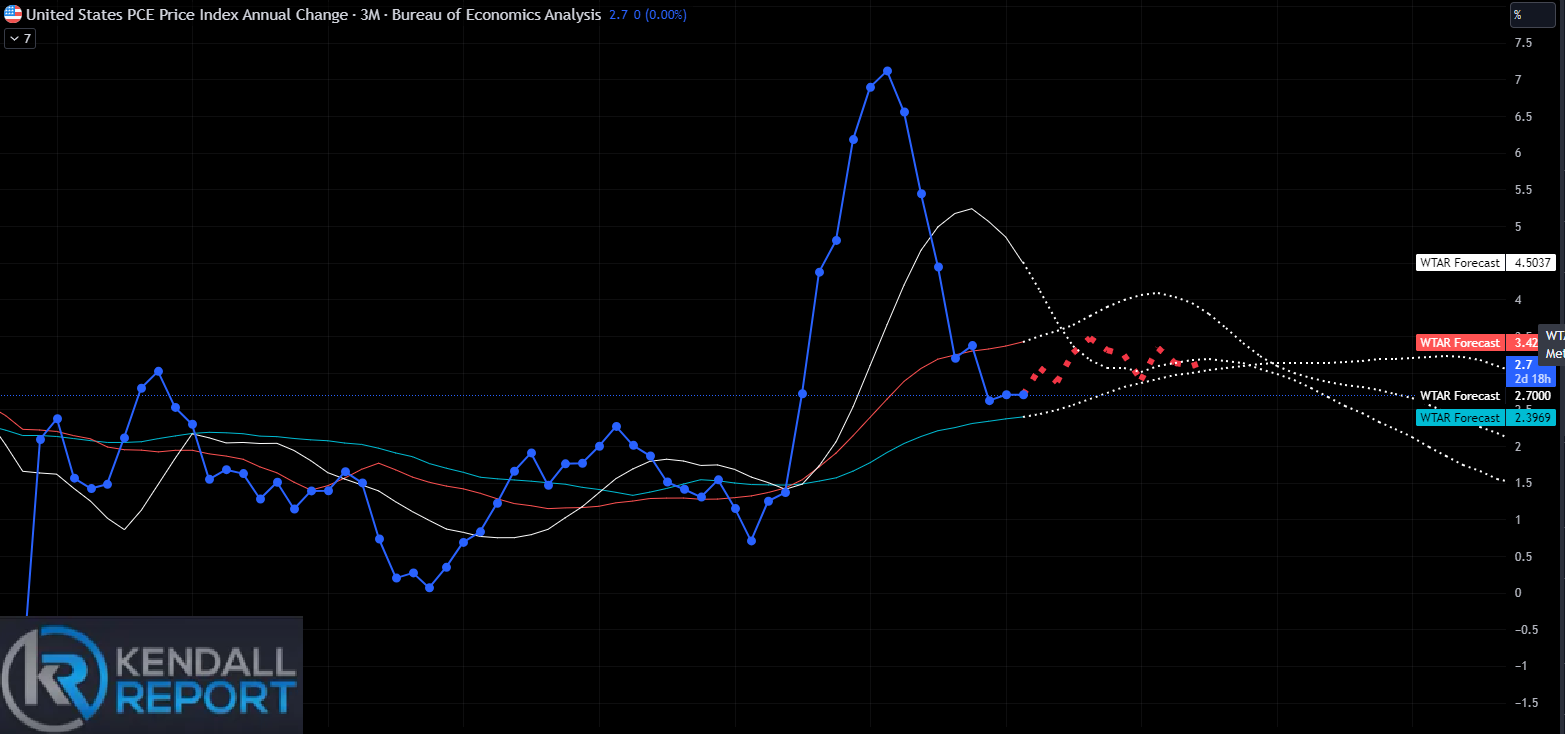
Tomorrow morning’s PCE numbers will be influential; my analysis suggests they will come in as expected. However, looking down the road, I am still expecting a slight rebound in inflation from August through October. It is not drastic, but an increase of about 0.5% to 0.75%, moving the rate to around 3% YOY.
The Russell's sharp rebound yesterday may relate to a turnaround in treasuries and the bank stress test results that were benign primarily, highlighting some stress in credit card debt but nothing major.
As we wrap up the week, we will use algorithms to indicate a sideways to a slightly positive market trend.
Several reports yesterday were more positive than expected. The GDP revision reached 1.4%, slightly above the expected 1.3%. However, the housing market was weaker than anticipated. On the other hand, orders for durable goods exceeded expectations. This pattern highlights the ongoing bifurcation in the economy, with negative manufacturing data contrasted by positive sales figures.
This back-and-forth dynamic continues to characterize our economy, creating two distinct worlds within the same economic landscape.
Looking back on Thursday’s action
It was a somewhat lackluster session in the stock market. The S&P 500 (+0.1%), Dow Jones Industrial Average (+0.1%), and Nasdaq Composite (+0.3%) edged slightly higher, while the Russell 2000 outperformed, rising by 1.0%.
Market breadth was positive, but neither side was strongly convinced. Advancers led decliners by roughly 3-to-2 at both the NYSE and Nasdaq.
The lack of conviction stemmed from a wait-and-see attitude ahead of the May Personal Income and Spending report, scheduled for release tomorrow at 8:30 ET. This report includes the Fed's preferred inflation measures, the PCE and core-PCE price indexes.
Ongoing interest in mega-cap stocks significantly influenced index performance. Amazon.com (AMZN 197.85, +4.24, +2.2%) reached a new record, crossing a $2 trillion market cap. The Vanguard Mega Cap Growth ETF (MGK) gained 0.3%.
Conversely, following Micron's (MU 132.26, -10.13, -7.1%) earnings report, semiconductor stocks dragged on the broader market. NVIDIA (NVDA 123.99, -2.41, -1.9%) was a notable detractor in the sector.
Some bank stocks traded higher after the Fed's stress test indicated that the 31 large banks tested had sufficient capital. The SPDR S&P Bank ETF (KBE) closed up 1.0%, and the SPDR S&P Regional Banking ETF (KRE) gained 1.1%. However, the S&P 500 financial sector fell by 0.3%.
Treasury yields settled lower in response to this morning's data and a strong $44 billion 7-year note sale. Economic releases included an upward revision to Q1 GDP, the highest level of continuing jobless claims since November 2021, and better-than-expected growth in May's durable orders.
The 10-year note yield, which was at 4.33% shortly before 8:30 ET, settled at 4.29%, three basis points lower than yesterday. The 2-year note yield, at 4.76% before 8:30 ET, settled at 4.72%.
·Nasdaq Composite: +19.0% YTD
·S&P 500:+15.0% YTD
·S&P Midcap 400: +5.1% YTD
·Dow Jones Industrial Average: +3.9% YTD
·Russell 2000: +0.6% YTD
Reviewing Thursday’s Economic Releases:
• May Advanced International Trade in Goods: -$100.6 billion (previously revised from -$99.4 billion to -$98.0 billion)
• May Advanced Retail Inventories: 0.7% (previous 0.7%)
• May Advanced Wholesale Inventories: 0.6% (previous 0.2%)
• Weekly Initial Claims: 233K (KR Forecast consensus 238K); previous revised from 238K to 239K; Weekly Continuing Claims: 1.839 million (previous revised from 1.828 million to 1.821 million)
- Key takeaway: The elevated level of continuing jobless claims suggests laid-off workers face longer wait times before finding new employment, indicating a softening labor market.
• May Durable Orders: 0.1% (KR Forecast consensus -1.2%); previous revised from 0.7% to 0.2%; May Durable Orders excluding transportation: -0.1% (KR Forecast consensus 0.2%); previous 0.4%
Key takeaway: New orders for nondefense capital goods, excluding aircraft, a proxy for business spending, declined 0.6% month over month.
• Q1 GDP - Third Estimate: 1.4% (KR Forecast consensus 1.3%); previous 1.3%; Q1 GDP Deflator - Third Estimate: 3.1% (KR Forecast consensus 3.1%); previous 3.0%
- Key takeaway: While the report is dated with the end of Q2 approaching, the slowdown in personal spending is noteworthy, given recent anecdotal evidence suggesting consumers are reducing discretionary spending.
• May Pending Home Sales: -2.1% (KR Forecast consensus 2.3%); previous -7.7%
Friday's economic calendar includes the Fed's preferred inflation gauge in the May Personal Income and Spending report. Other data for tomorrow include:
• 9:45 ET: June Chicago PMI (previous 35.4)
• 10:00 ET: Final June University of Michigan Consumer Sentiment (KR Forecast consensus 65.6; previous 65.6)
WaveTech Database
Another week has passed, and as we approach the end of the week, we will run our intermediate models on the weekly charts on Friday after the close. These models have been holding steady at around 62% bullish for several weeks. I expect some selling to occur in the intermediate trades, but we’ve only seen rotation so far. I still anticipate a slight pullback in the bullish percentage, but it should remain above 56% over the next several weeks.
As we enter July, we’re likely to see further rotation. Based on my commentary on technicals and market trends, I expect a slight softening, which suggests the intermediate models will back off a bit from their current levels.
The short-term models continue to show substantial volatility. Yesterday, we saw over 1,000 exits; today, we have 830 new entries and 392 exits. Although we haven't regained everything we lost yesterday, we remain 50.69% bullish. Currently, the short-term models show three sectors in a long position: consumer non-cyclical, healthcare, and services.
There’s no significant trend change in the current database configuration except for the expectation of more sideways trading with a slight upward bias. However, as we move into early July, I expect a softening of the bullish percent across the board.

S&P 500 Futures
As we approach the end of the week, major news is affecting our algorithms, indicating a negative configuration. We also have downward Fibonacci targets suggesting a move down to 5443. However, the daily price projection algorithm indicates that prices will likely move sideways along the 10-day moving average, currently at 5538.
Yesterday, we saw significant volatility as prices traded down to the S3 level, which I discussed as the extreme, and then moved up to the resistance at R1. Overnight, we've seen continued volatility, trading up to R2 at 5563.25. We are now looking at the potential to reach R3 at 5572, which would likely be today's extreme, with support in the range of 5537-5528.
There is still a slight upward bias, as PPM 2 remains in trend mode, suggesting that we will see a bounce if the support level is hit. A classic wedge pattern is forming, indicating that prices will likely fall within this range. We are less than 20 points away from reaching an all-time high, but PPM2 and PPM3 are setting up for an inverted V trade, which needs to be closely monitored.
Today's action will be heavily influenced by the PCE numbers released before the market opens, which will be this session's primary driver of sentiment.

NASDAQ Futures
As I have been discussing, the NASDAQ has a slightly more negative formation than the S&P, indicating more substantial downside risk. We are potentially setting up a right shoulder on the chart, suggesting we could at least test the 21-day moving average at the 19,507 level. There is also a potential to go as low as the 40-day moving average at 19,017. These moving averages are rising, so these levels will continue to adjust as days pass. Use the simple 21-day and 40-day moving averages to calculate these support levels or targets.
Additionally, there are Fibonacci targets on the downside, confirming a range of 19,589, 19,290, and 19,105, aligning with these moving averages and support levels. On the upside, we can refer to today's market grid, which indicates resistance at 20,150 with the potential to reach 20,209. This should provide substantial resistance; I would expect a rejection around that level if the market trades up to it.
The overnight action reflects a positive reaction to the possibility of lower taxes and a different economic environment, driven by speculation about the upcoming presidential election. However, we are still far from the election, so this bounce will not likely be material. The market sentiment could change substantially based on the news media's rhetoric over the next week or two.

Russel Cash
The daily Russell chart is noteworthy due to the sharp jump it experienced yesterday. This movement was driven by the reversal in treasuries and positive reports from the bank stress tests. Since the Russell includes a substantial number of bank stocks, this has likely boosted positive sentiment toward these stocks.
However, we are still far from seeing any significant breakout. Three Fibonacci targets are worth mentioning, indicating potential moves to 2150, 2210, and 2247. Additionally, the algorithms suggest that the Russell will likely move back towards the 2050 level over the subsequent two to four sessions.

Treasuries
While treasuries experienced a slight downward reversal after reaching 4.34%, the algorithms suggest a continued upward trend in yields over the next several days. We should remain within the range I've been discussing, with a low of around 4.25% and a high of around 4.4%. I do not foresee yields moving significantly out of this range.
The PCE prices coming out in the morning could lead to a slight rise in yields if they come in higher than expected. However, as mentioned earlier in this report, I expect they will align with predictions. Even if the PCE prices are lower than expected, I don't anticipate any significant yield changes.
This range has been very stable for the last ten days, and I don't see that changing anytime soon.
Bitcoin
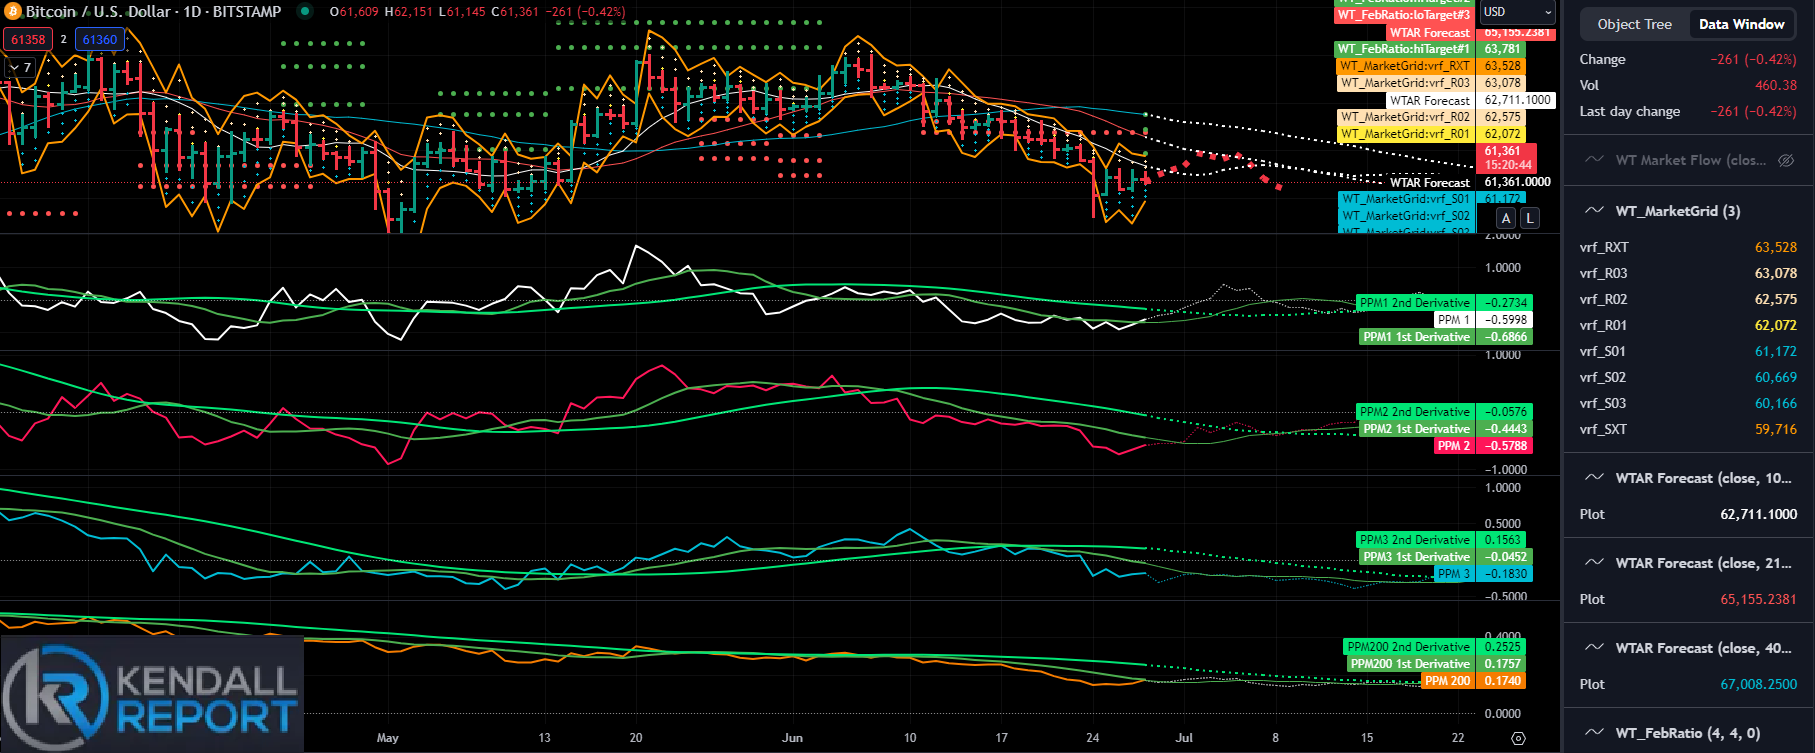
Bitcoin has remained stable in a narrow sideways range following Monday's significant downward surge and the subsequent STX buy signal. Despite the volatility earlier in the week, the price has settled, creating an opportunity to analyze potential future movements as we head into the weekend.
Three new Fibonacci targets to the upside have been issued: 63,781, 65,815, and 67,072. If Bitcoin can break through the current resistance levels, these targets provide a roadmap for potential price levels.
The first critical resistance level is at the 10-day moving average, currently at 62,710. A break above this level would strongly indicate bullish momentum and confirm a minimum move to the first Fibonacci target at 63,781. This would represent a significant shift from the recent sideways trading pattern and could attract additional buying interest.
Beyond the 10-day moving average, there is another critical pivot point at 65,155. Breaking above this level would confirm the initial bullish signal and suggest that Bitcoin could move toward the higher Fibonacci targets of 65,815 and 67,072.
These levels would represent a considerable recovery from the earlier downward movement and could signal a return to a more sustained upward trend.
On the downside, monitoring the support levels to gauge the potential risks is essential. The immediate support level is at 60,669, which has provided a floor for the recent trading range.
If Bitcoin were to break below this level, it would signal a potential move towards the next support level, 59,716. This level represents extreme downside support and would be a critical area to watch for any further declines.
In summary, Bitcoin's price action in the coming days will be crucial in determining its short-term direction. The resistance at the 10-day moving average and the pivot point at 65,155 are key levels to watch for signs of a bullish breakout.
Conversely, the support levels at 60,669 and 59,716 will be important indicators of potential downside risks. As we move into the weekend, traders should monitor these levels and be prepared for potential volatility in either direction.

Robert Kendall
Chief Analyst
"Disclaimer for “The Kendall Report
The information provided in "The Kendall Report" is for general informational and educational purposes only. The opinions, analyses, and forecasts included in this newsletter are based on the author's personal views and experiences and are provided as is without warranty of any kind.
While we strive to provide accurate and up-to-date information, we do not guarantee the accuracy, completeness, reliability, or timeliness of any information contained in this newsletter. The information presented should not be construed as financial, investment, legal, or other professional advice. It does not constitute a recommendation or endorsement of any particular investment strategy, financial instrument, product, or service.
Investors should consider their financial situation, objectives, and risk tolerance before making investment decisions based on the information provided. The financial market is subject to high risk and volatility. Past performance is not indicative of future results. Investing in the financial market involves the risk of loss, including the loss of principal.
"The Kendall Report" and its contributors will not be liable for any direct, indirect, incidental, consequential, or exemplary damages arising from the use or inability to use the information provided in this newsletter, including but not limited to losses or missed gains.
By accessing and using "The Kendall Report," you acknowledge and agree to this disclaimer and assume full responsibility for the use of the information provided. We reserve the right to make changes to the content of this newsletter at any time without notice.
This disclaimer is subject to change at our discretion, and it is the reader's responsibility to review it regularly for any updates.