
"GDP Crushes Expectations at 3.3% While Media Pushes Doom"
Free Edition!

KR Opinion
The financial press continues to push narratives about inflationary scenarios, with companies such as Hormel and Ace Hardware discussing rising costs for household staples. However, they remain notably vague about actual price increase estimates. They seem determined to maintain this storyline despite contradictory economic data emerging from multiple sources.
Today's GDP report registered a solid 3.3%, aligning closely with my earlier estimate using the GDP calculator, which indicated a 3.1% GDP growth rate. When combined with the new tariff policies, this growth path could significantly cut the national debt within the next three to five years, potentially transforming the economic landscape. The press is now recognizing that the administration is citing national security as a justification for additional tariffs, and it's becoming harder to argue against the effectiveness of this strategy.
After spending much of the period from April through the summer discussing potential economic slowdowns, the narrative has shifted considerably. Federal Reserve officials, such as Waller, are now discussing a series of rate cuts over the next six to nine months, indicating a dovish shift in monetary policy. Meanwhile, markets continue hitting new highs, making it harder to maintain pessimistic outlooks.
As we approach the PCE numbers, estimates suggest a possible uptick, though whether it's 0.2% or 0.3% remains to be seen. Either way, this is far from material when compared to the 9% inflation prints we saw during the Biden administration. The situation presents an interesting contrast to those earlier periods.
There's ongoing speculation about various personnel matters, including discussions about job security that seem more like political theater than substantive concerns. Some of these conflicts resemble high-stakes court battles over presidential authority, although the legal basis for such challenges appears to be weak. If certain officials are creating smokescreens to hide potential financial improprieties, such as mortgage fraud, their defensive posturing becomes more strategic.
The 3.3% GDP growth figure is particularly notable when considered in the context of history. During the 1980s, the decade averaged 3.1% growth, with a standout year in 1986, when GDP growth reached 6.7%. However, this was followed by the 1987 crash, which had its own unique triggers. The new tariffs on low-cost imports could bring in an additional $10 billion annually, with Scott Bessent discussing potential tariff revenues reaching up to $8 trillion. Combined with expected tax cuts for middle America, these policies could further boost economic growth.
Click Here for Interactive GDP Model

Despite rhetoric from various industries about fighting tariff implementations, the reality is that if Americans are working, paying down debt, and experiencing improving economic conditions, few will complain about paying slightly more for certain products. The weekly jobless claims data support this optimistic view, with a 5,000 drop in claims and continuing claims also moderating. We're nowhere near the concerning threshold of 2 million that would signal economic softening. Instead, metrics remain stable or are improving, with no indicators suggesting economic weakness.
Markets are currently pricing in a 25-basis-point rate cut, which should support an underlying bullish trend as markets drift sideways to higher levels. Cash markets are hitting new highs, and futures are nearing a breakout. All data sheets confirm the ongoing bullish sentiment, with the NASDAQ being the only exception, likely due to recent developments in NVIDIA.
Looking ahead to the PCE data release tomorrow morning, no material negative surprises are expected, though vigilance is warranted. Market sentiment remains supported by resilient economic data and ongoing optimism surrounding artificial intelligence developments. Even though NVIDIA delivered mixed results, most analysts expect higher prices across AI stocks. While many commentators have discussed an AI bubble, none have identified a catalyst to burst it at present.
As we conclude another positive week, the optimism appears likely to continue flowing into next week. The combination of strong GDP growth, moderating inflation concerns, stable employment data, and technological innovation creates a compelling narrative for continued market strength, despite the persistent attempts by some in the financial press to paint a more pessimistic picture.
WaveTech Database
The WaveTech Database shows a strong bullish stance across the market today, with daily models indicating 585 new entries compared to only 266 exits. This solid entry-to-exit ratio of about 2.2:1 highlights the current market's strong momentum.
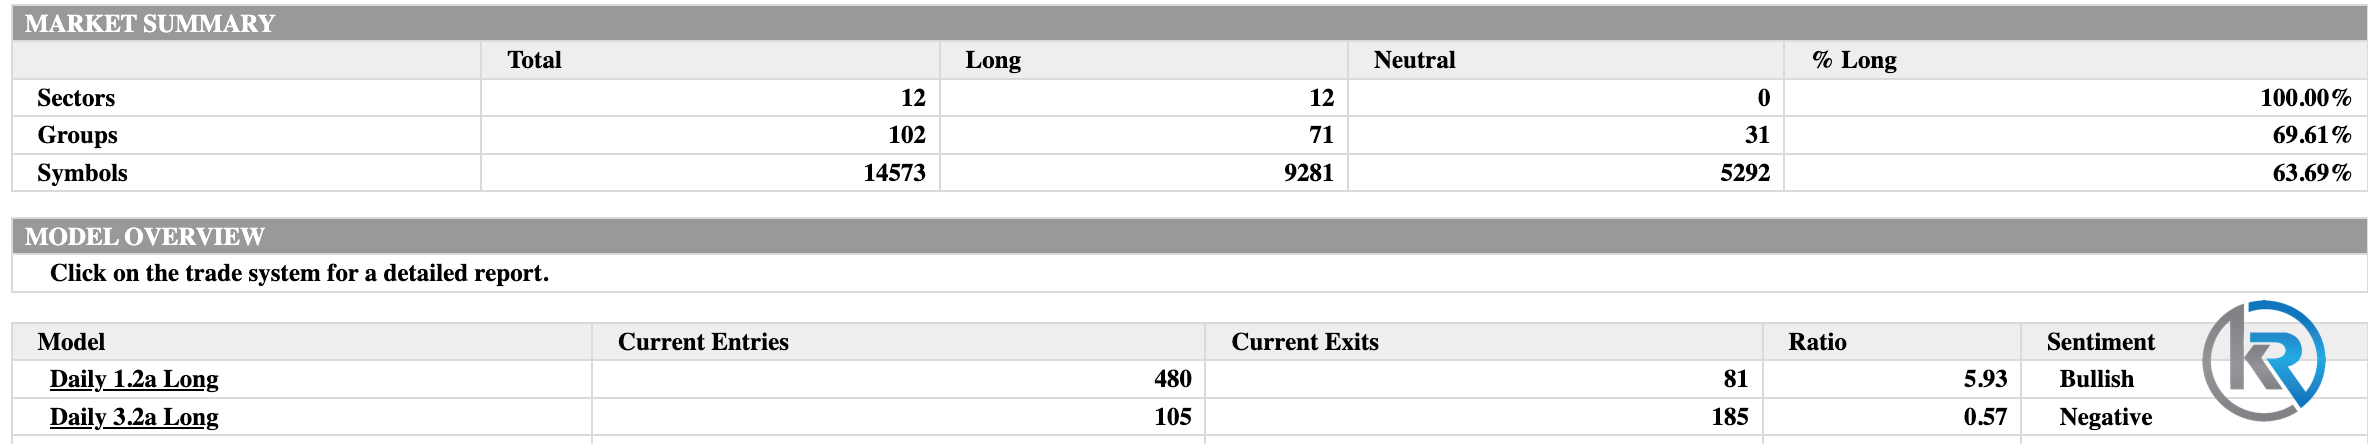
At 63.69% long positioning, the WaveTech models have exceeded the critical 62% threshold, entering what we identify as the full investment zone. This range usually falls between 70-78%, although the database can reach into the 90th percentile during exceptional market conditions. The current reading indicates we're in the early stages of this full investment phase, with potential for further growth if momentum persists.
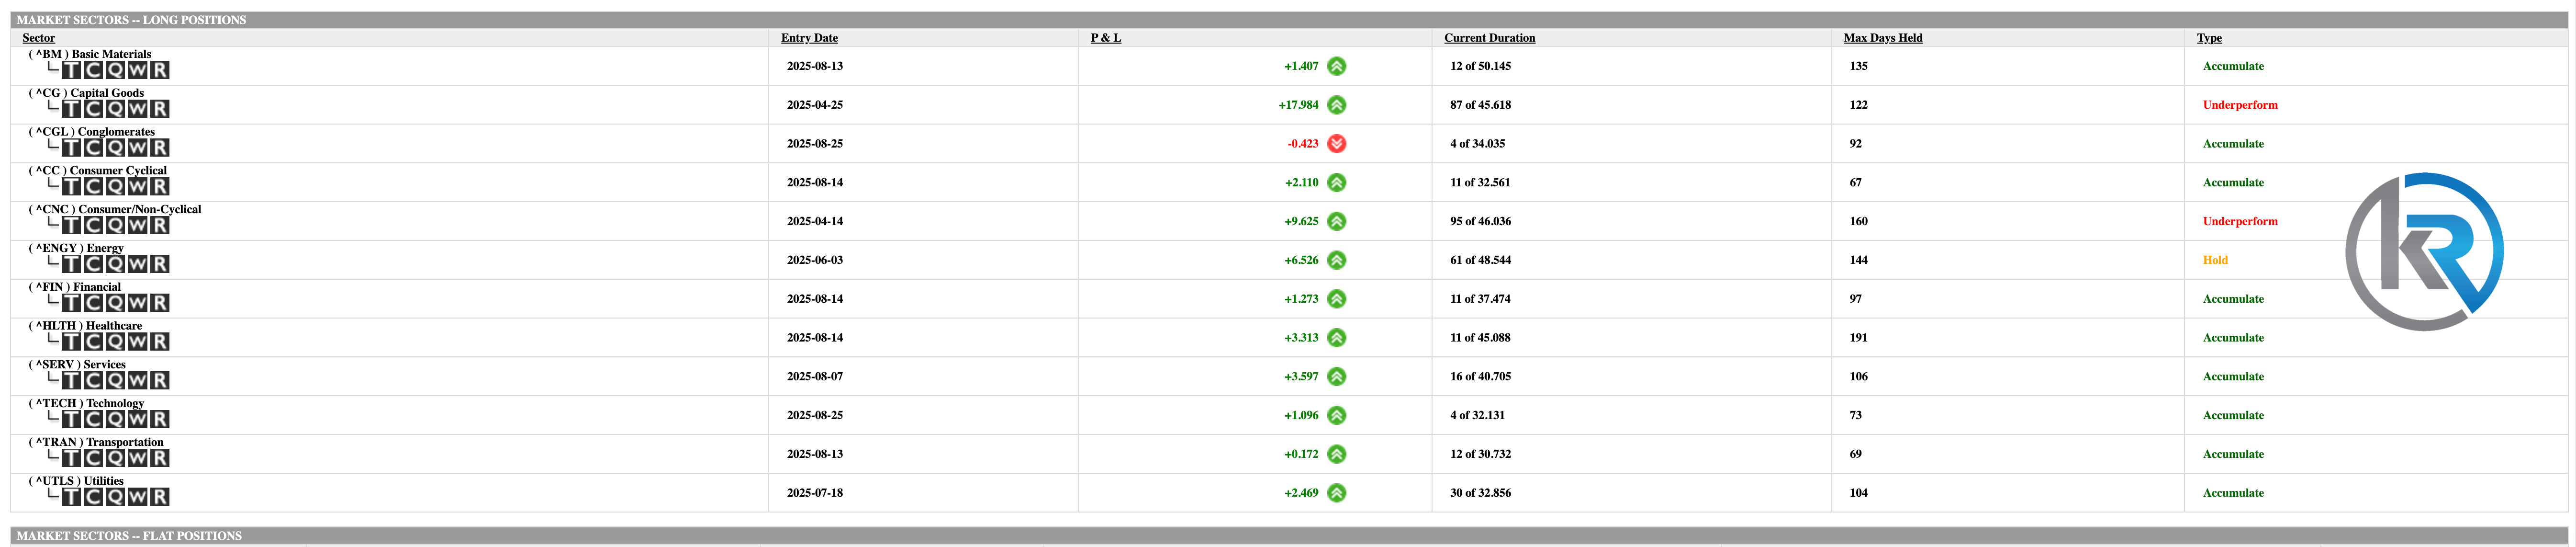
The sector analysis shows a unanimous bullish outlook, with all 12 sectors holding long positions and none in neutral territory. This full sectoral alignment at 100% long is especially significant and often indicates periods of strong trending activity. Out of the 102 groups monitored, 71 hold long positions while 31 are neutral, resulting in a healthy 69.61% long rate at the group level.
Examining the WaveTech Database's daily models specifically, the Daily 1.2a Long model displays 480 current entries against 81 exits, resulting in an impressive 5.93 ratio with bullish sentiment. The Daily 3.2a Long model contributes 105 entries versus 185 exits, generating a 0.57 ratio with negative sentiment. This divergence between the two daily models suggests the shorter-term momentum (1.2a) remains significantly stronger than the intermediate-term positioning (3.2a).
Several symbols appear to be approaching maturity phases based on their extended durations at current levels. The concentration of new entries suggests fresh capital deployment is occurring across multiple sectors simultaneously, rather than rotating between them. This broad-based participation typically supports sustained moves higher, though it also raises the stakes for any eventual consolidation phase.
The lack of any sectors in a neutral position creates an interesting dynamic where the next move will likely be decisive. Either we'll see continued expansion toward the 70-78% full investment range or a sharp reversion as some sectors start rotating to neutral. Since the current entry flow greatly exceeds exits, the odds favor continued expansion in the near term. However, traders should watch for any slowdown in entry or increase in exits as early signs of a potential change in market behavior.
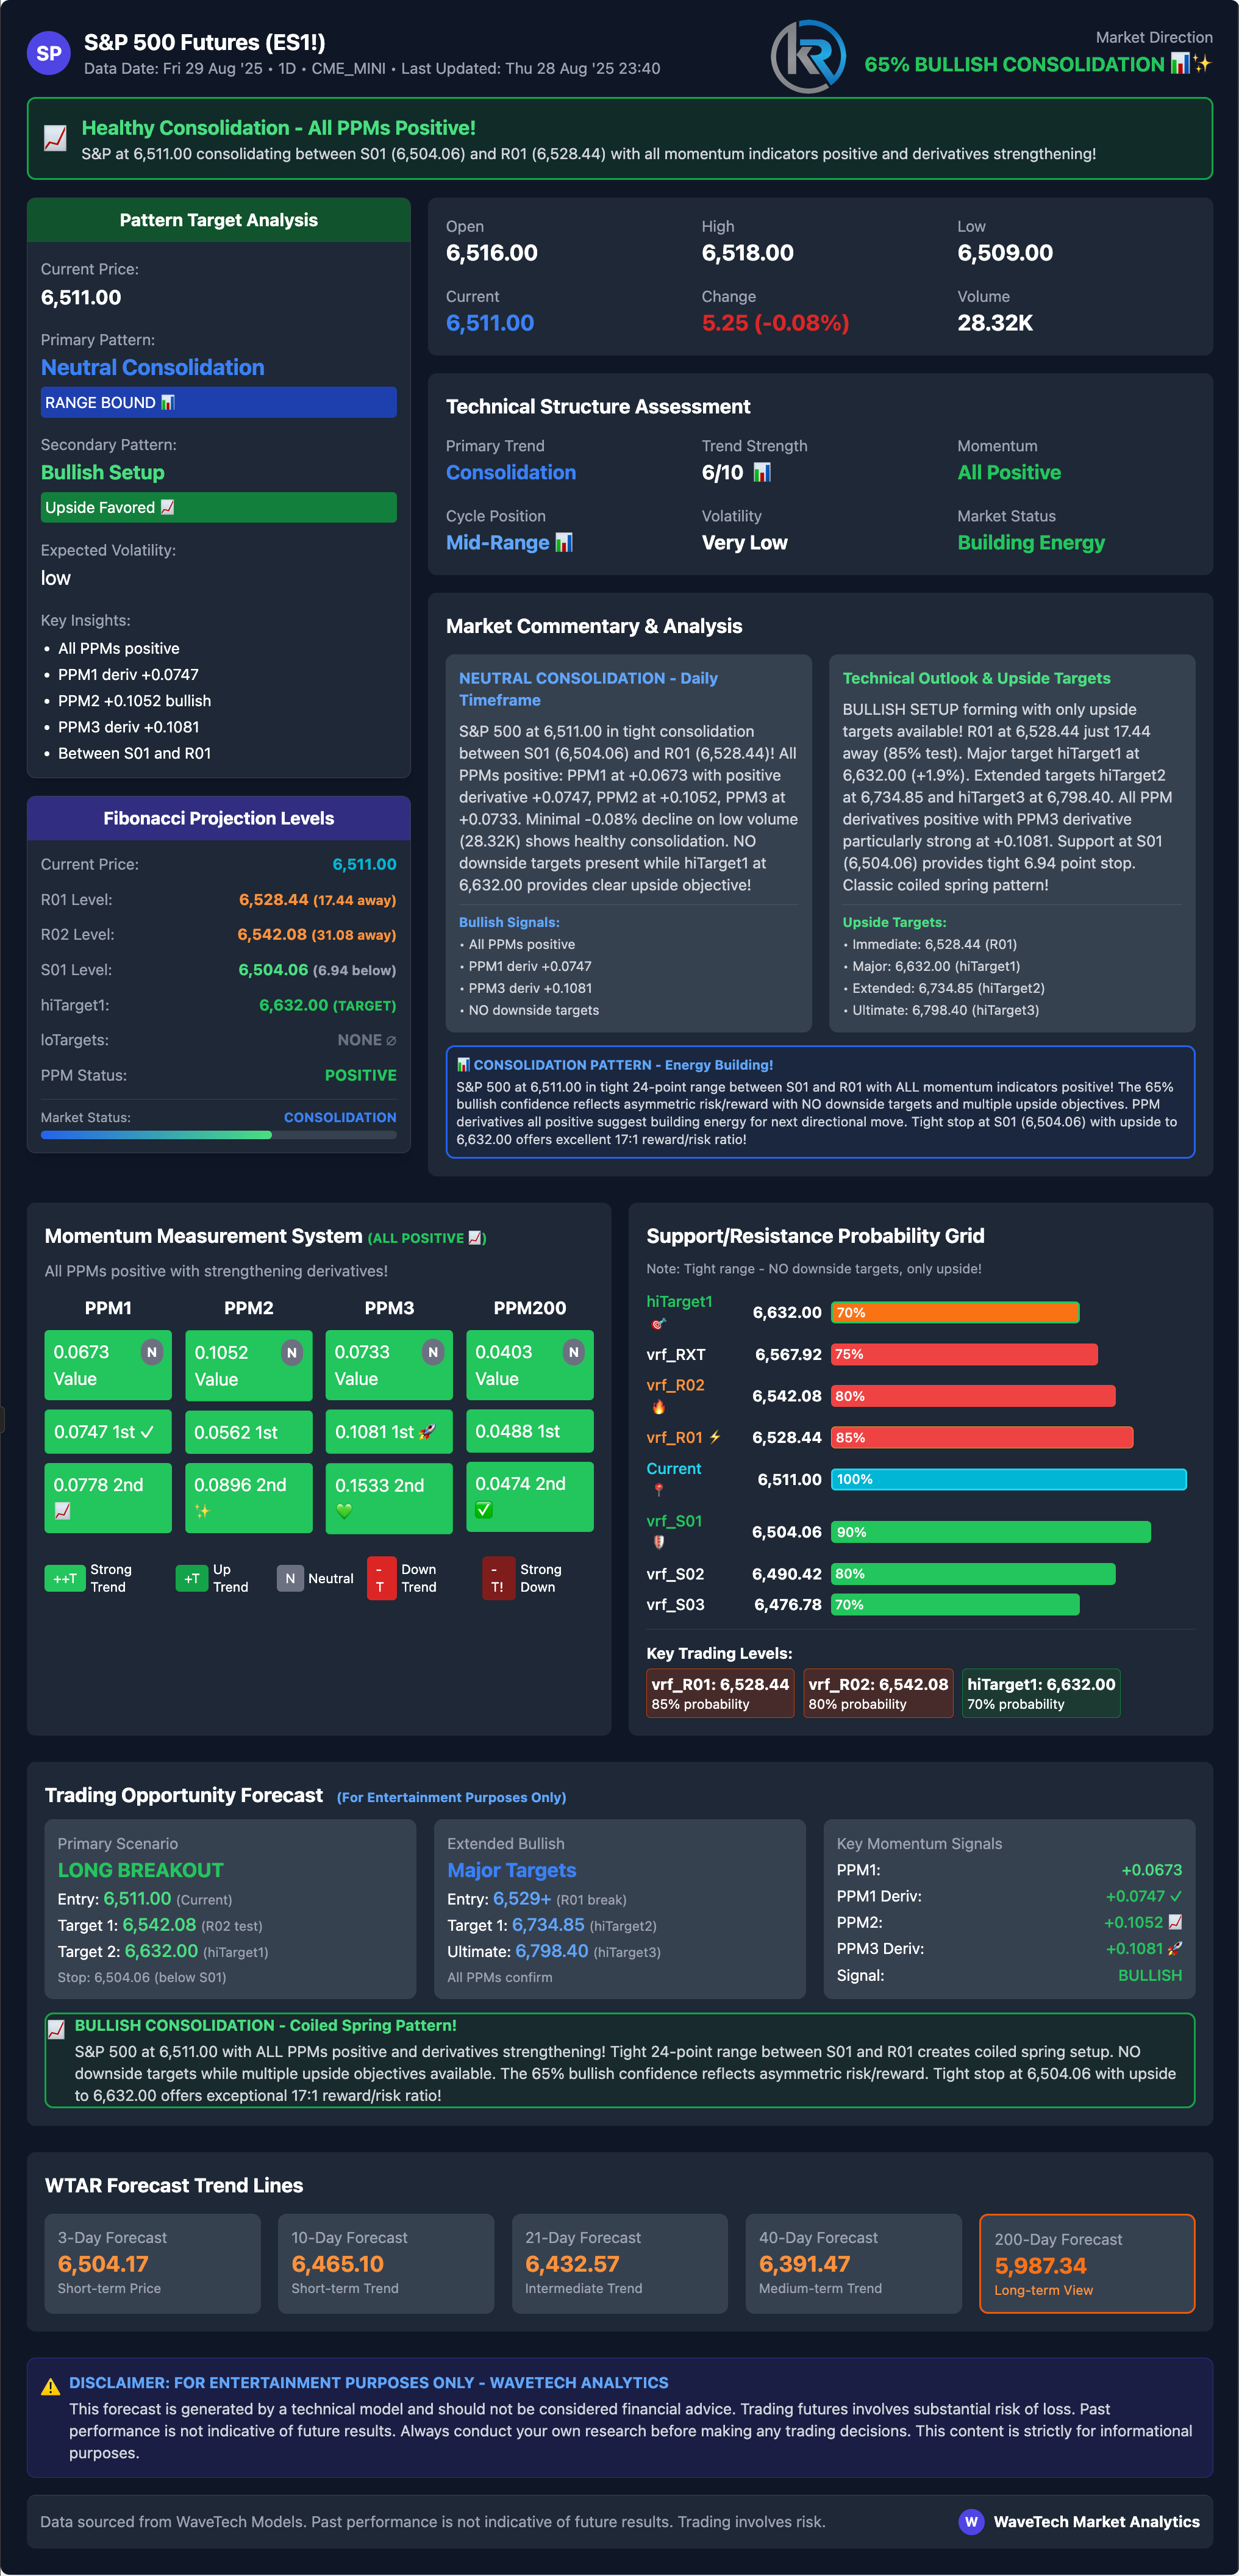
S&P 500 Futures
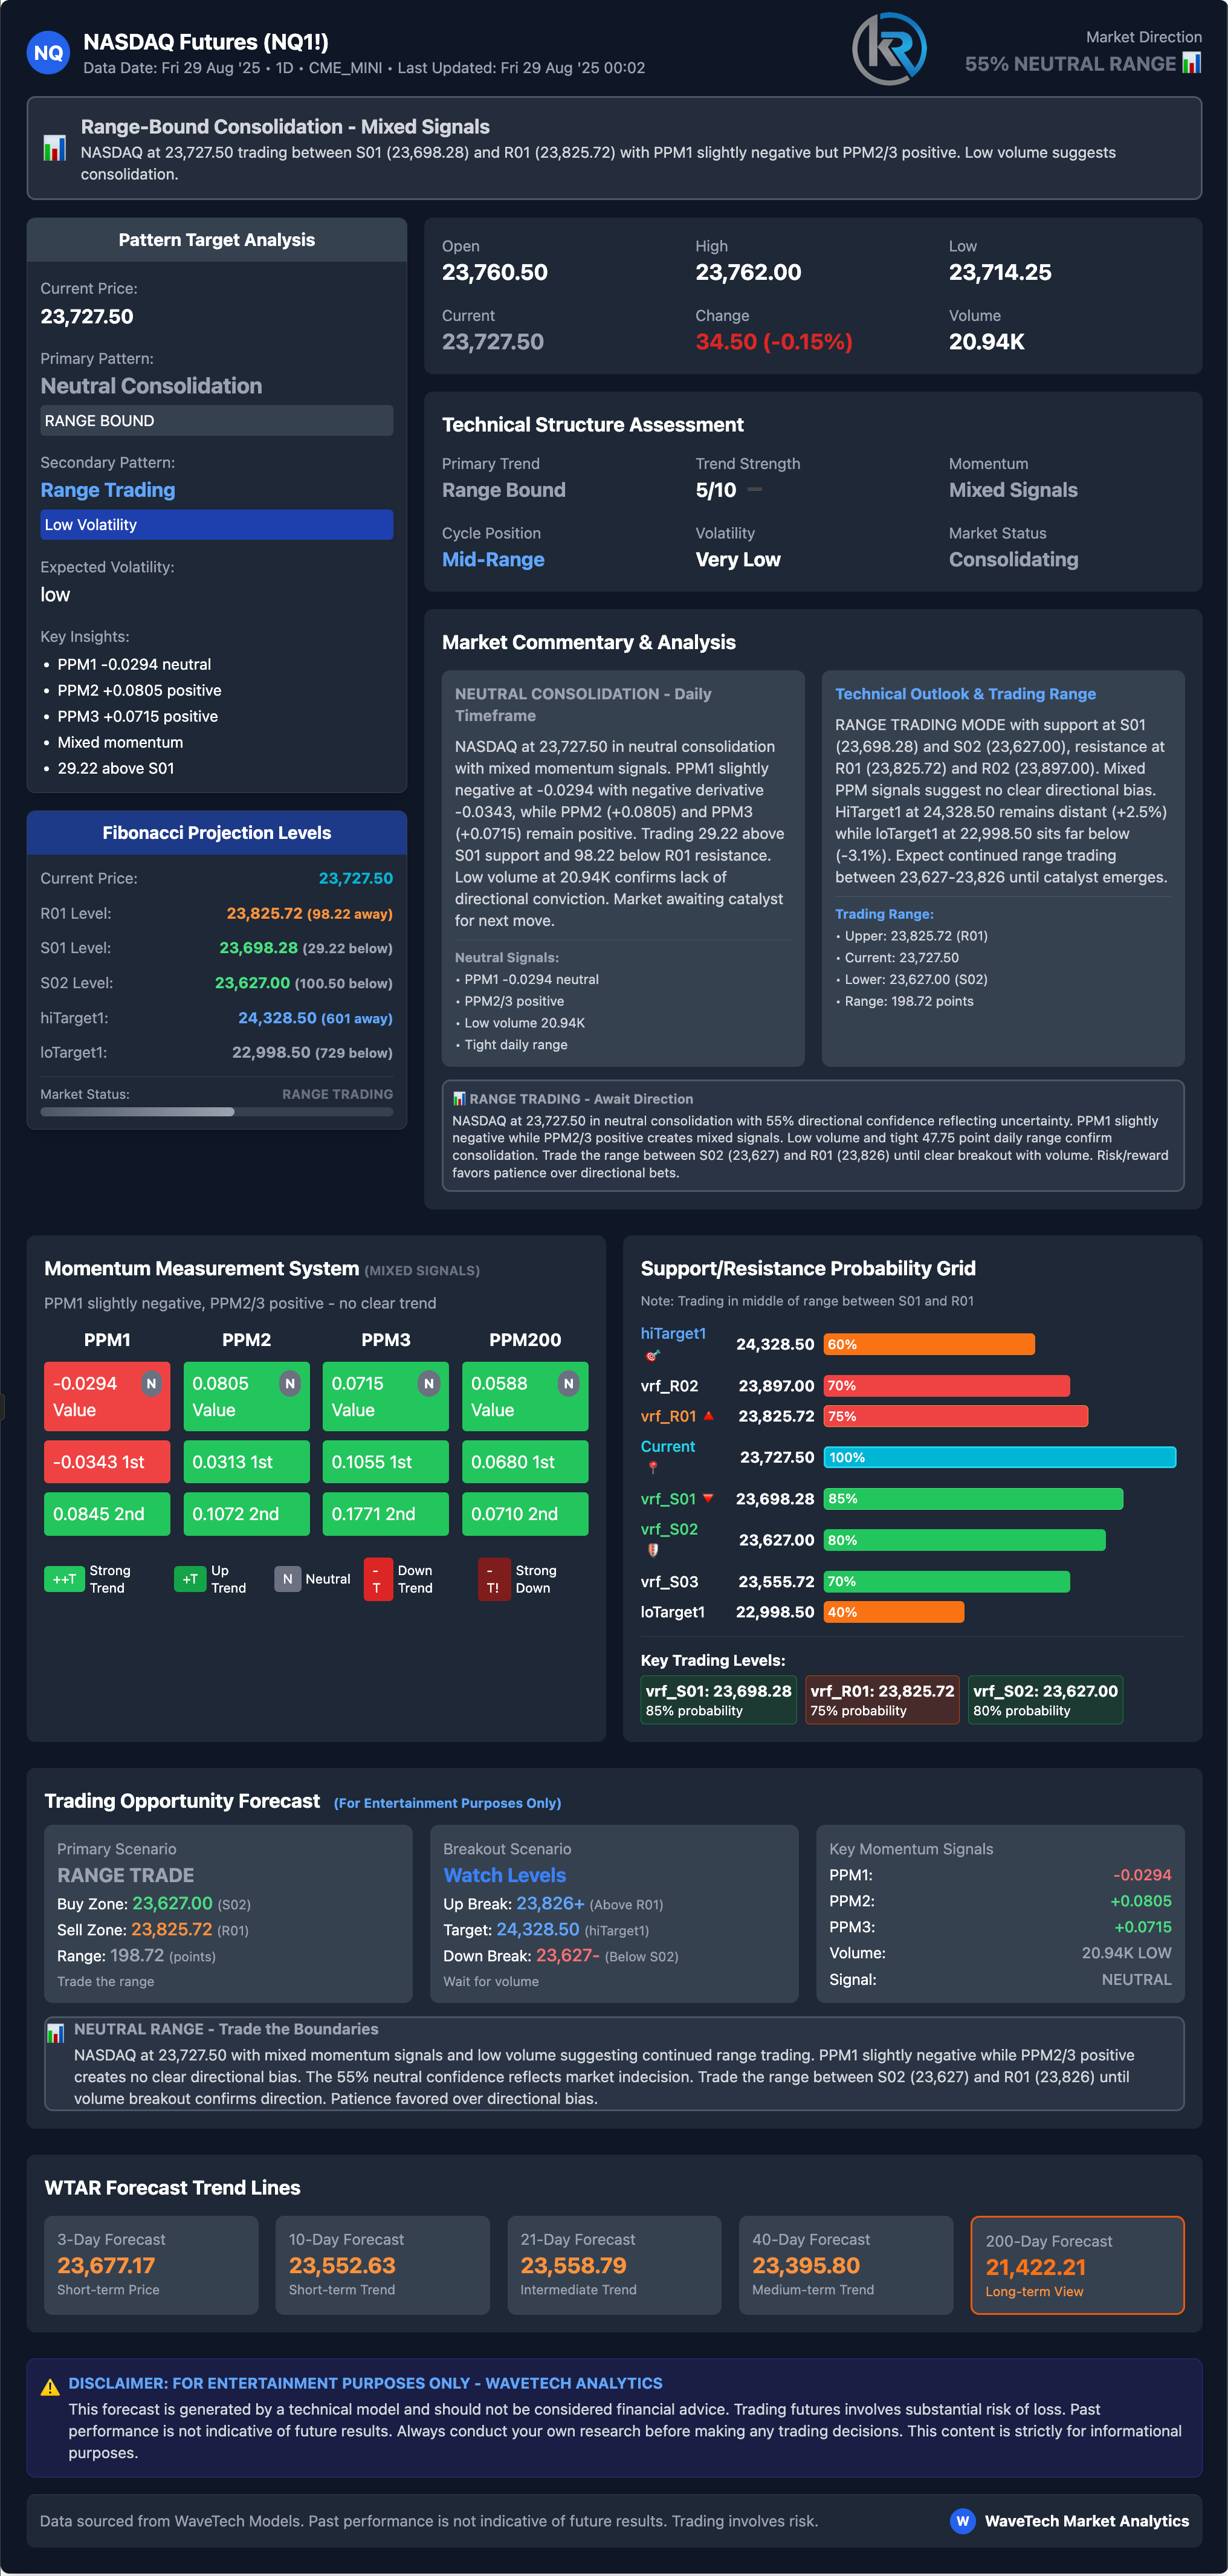
NASDAQ 100 Futures
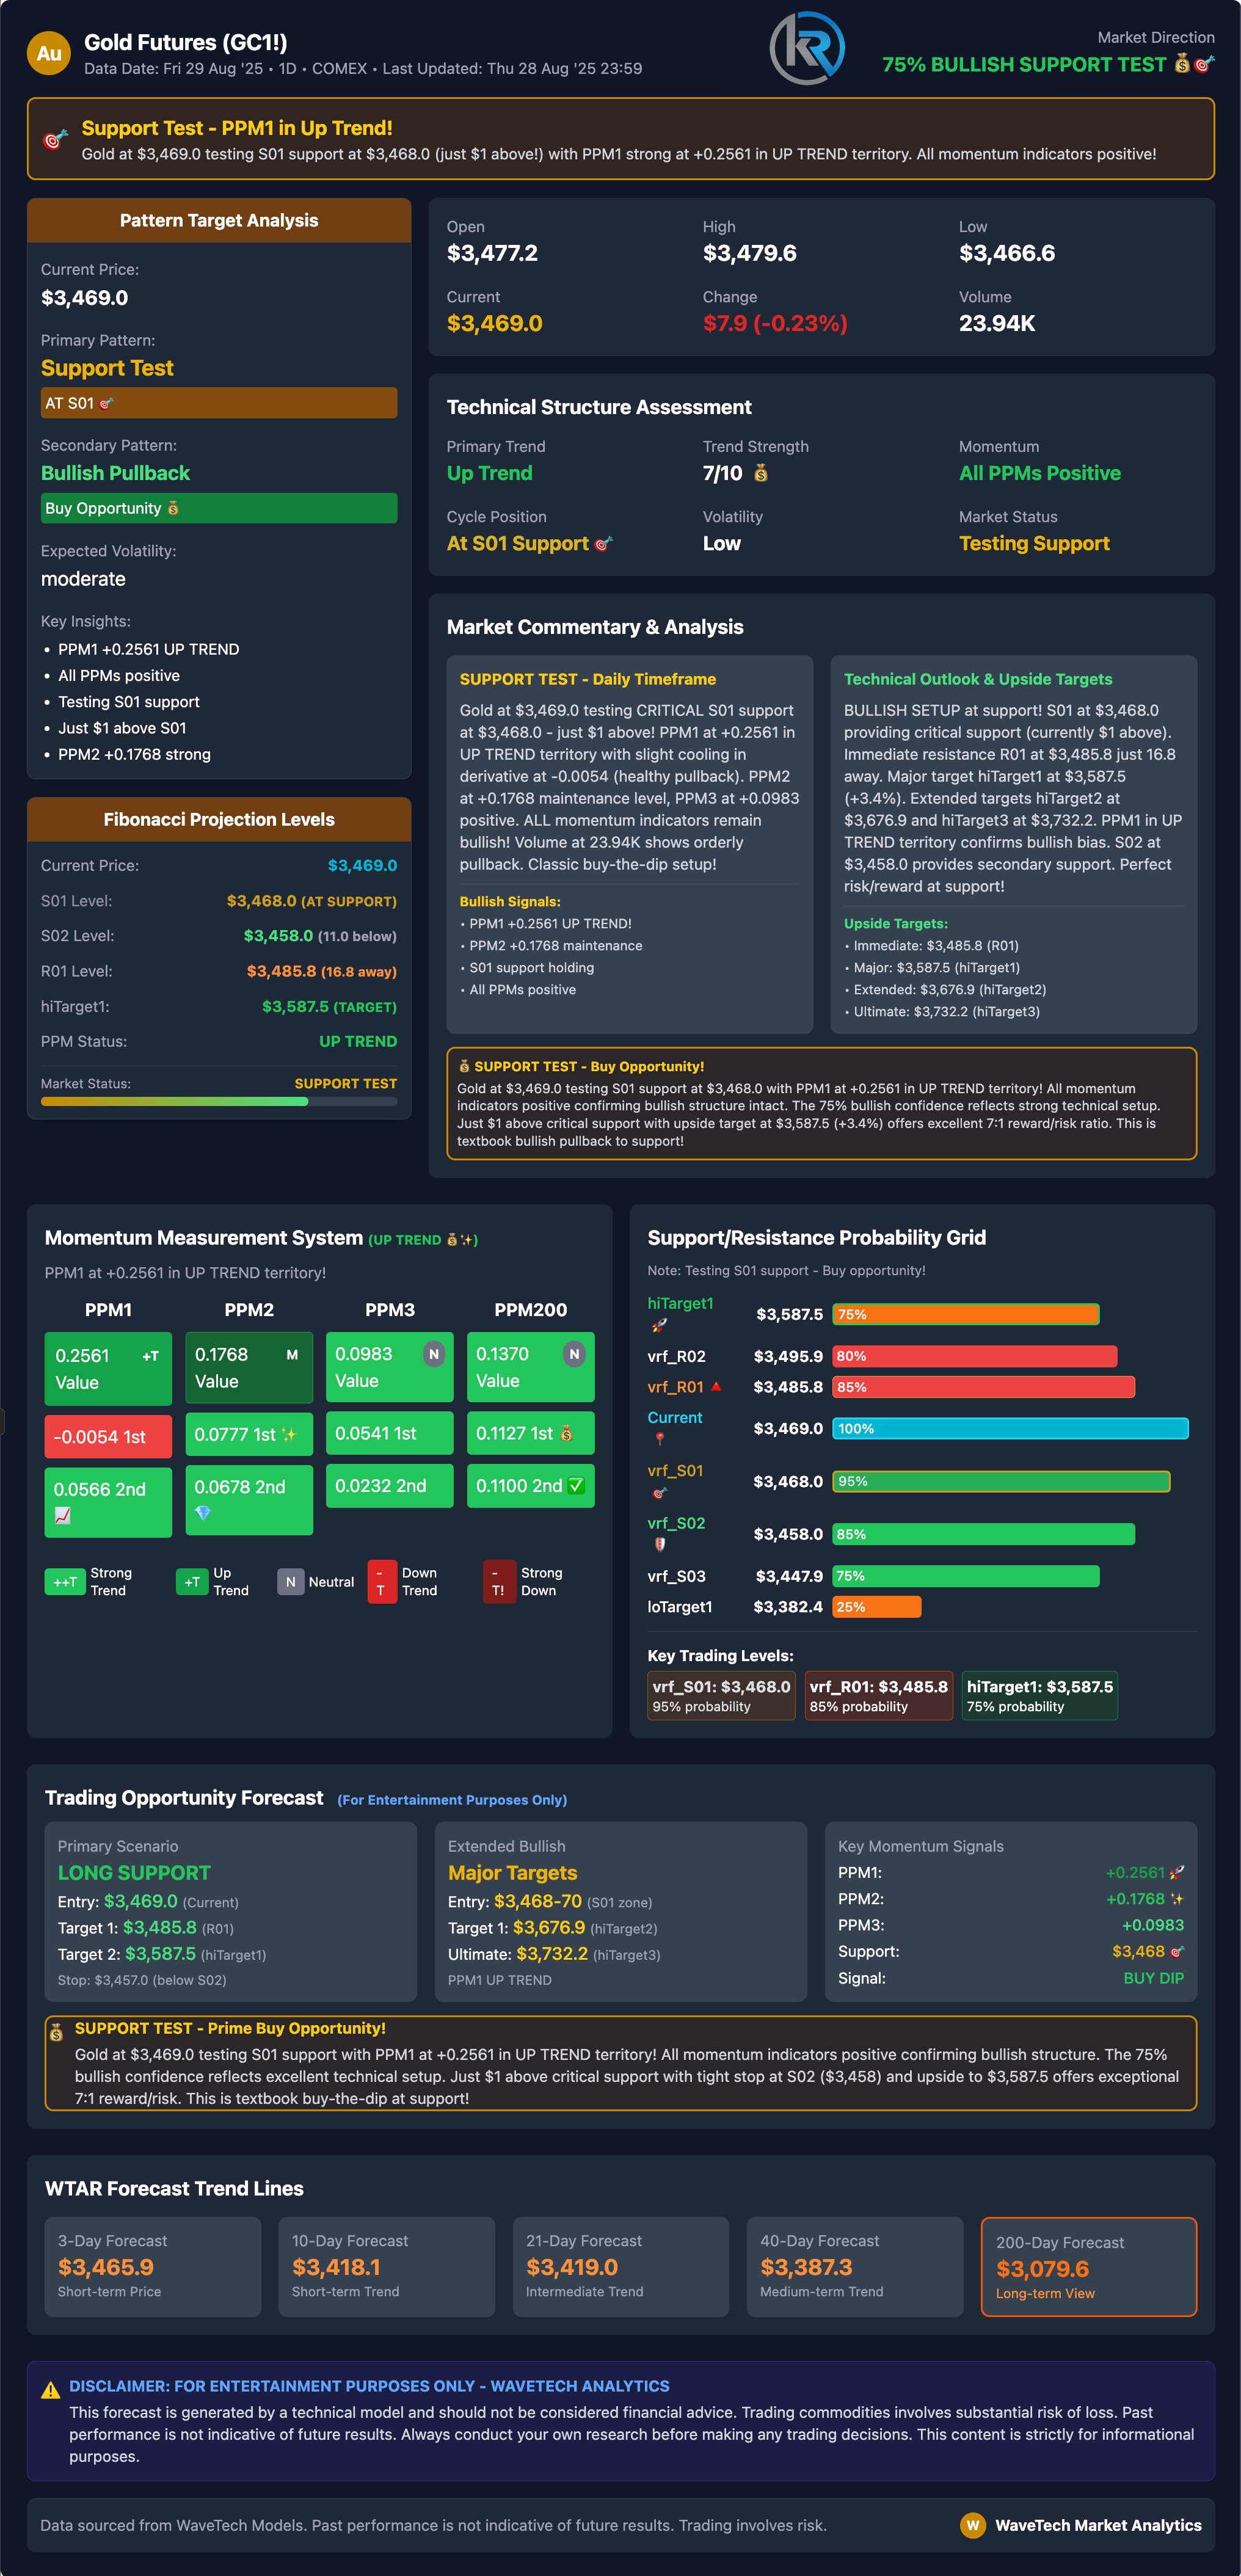
Gold
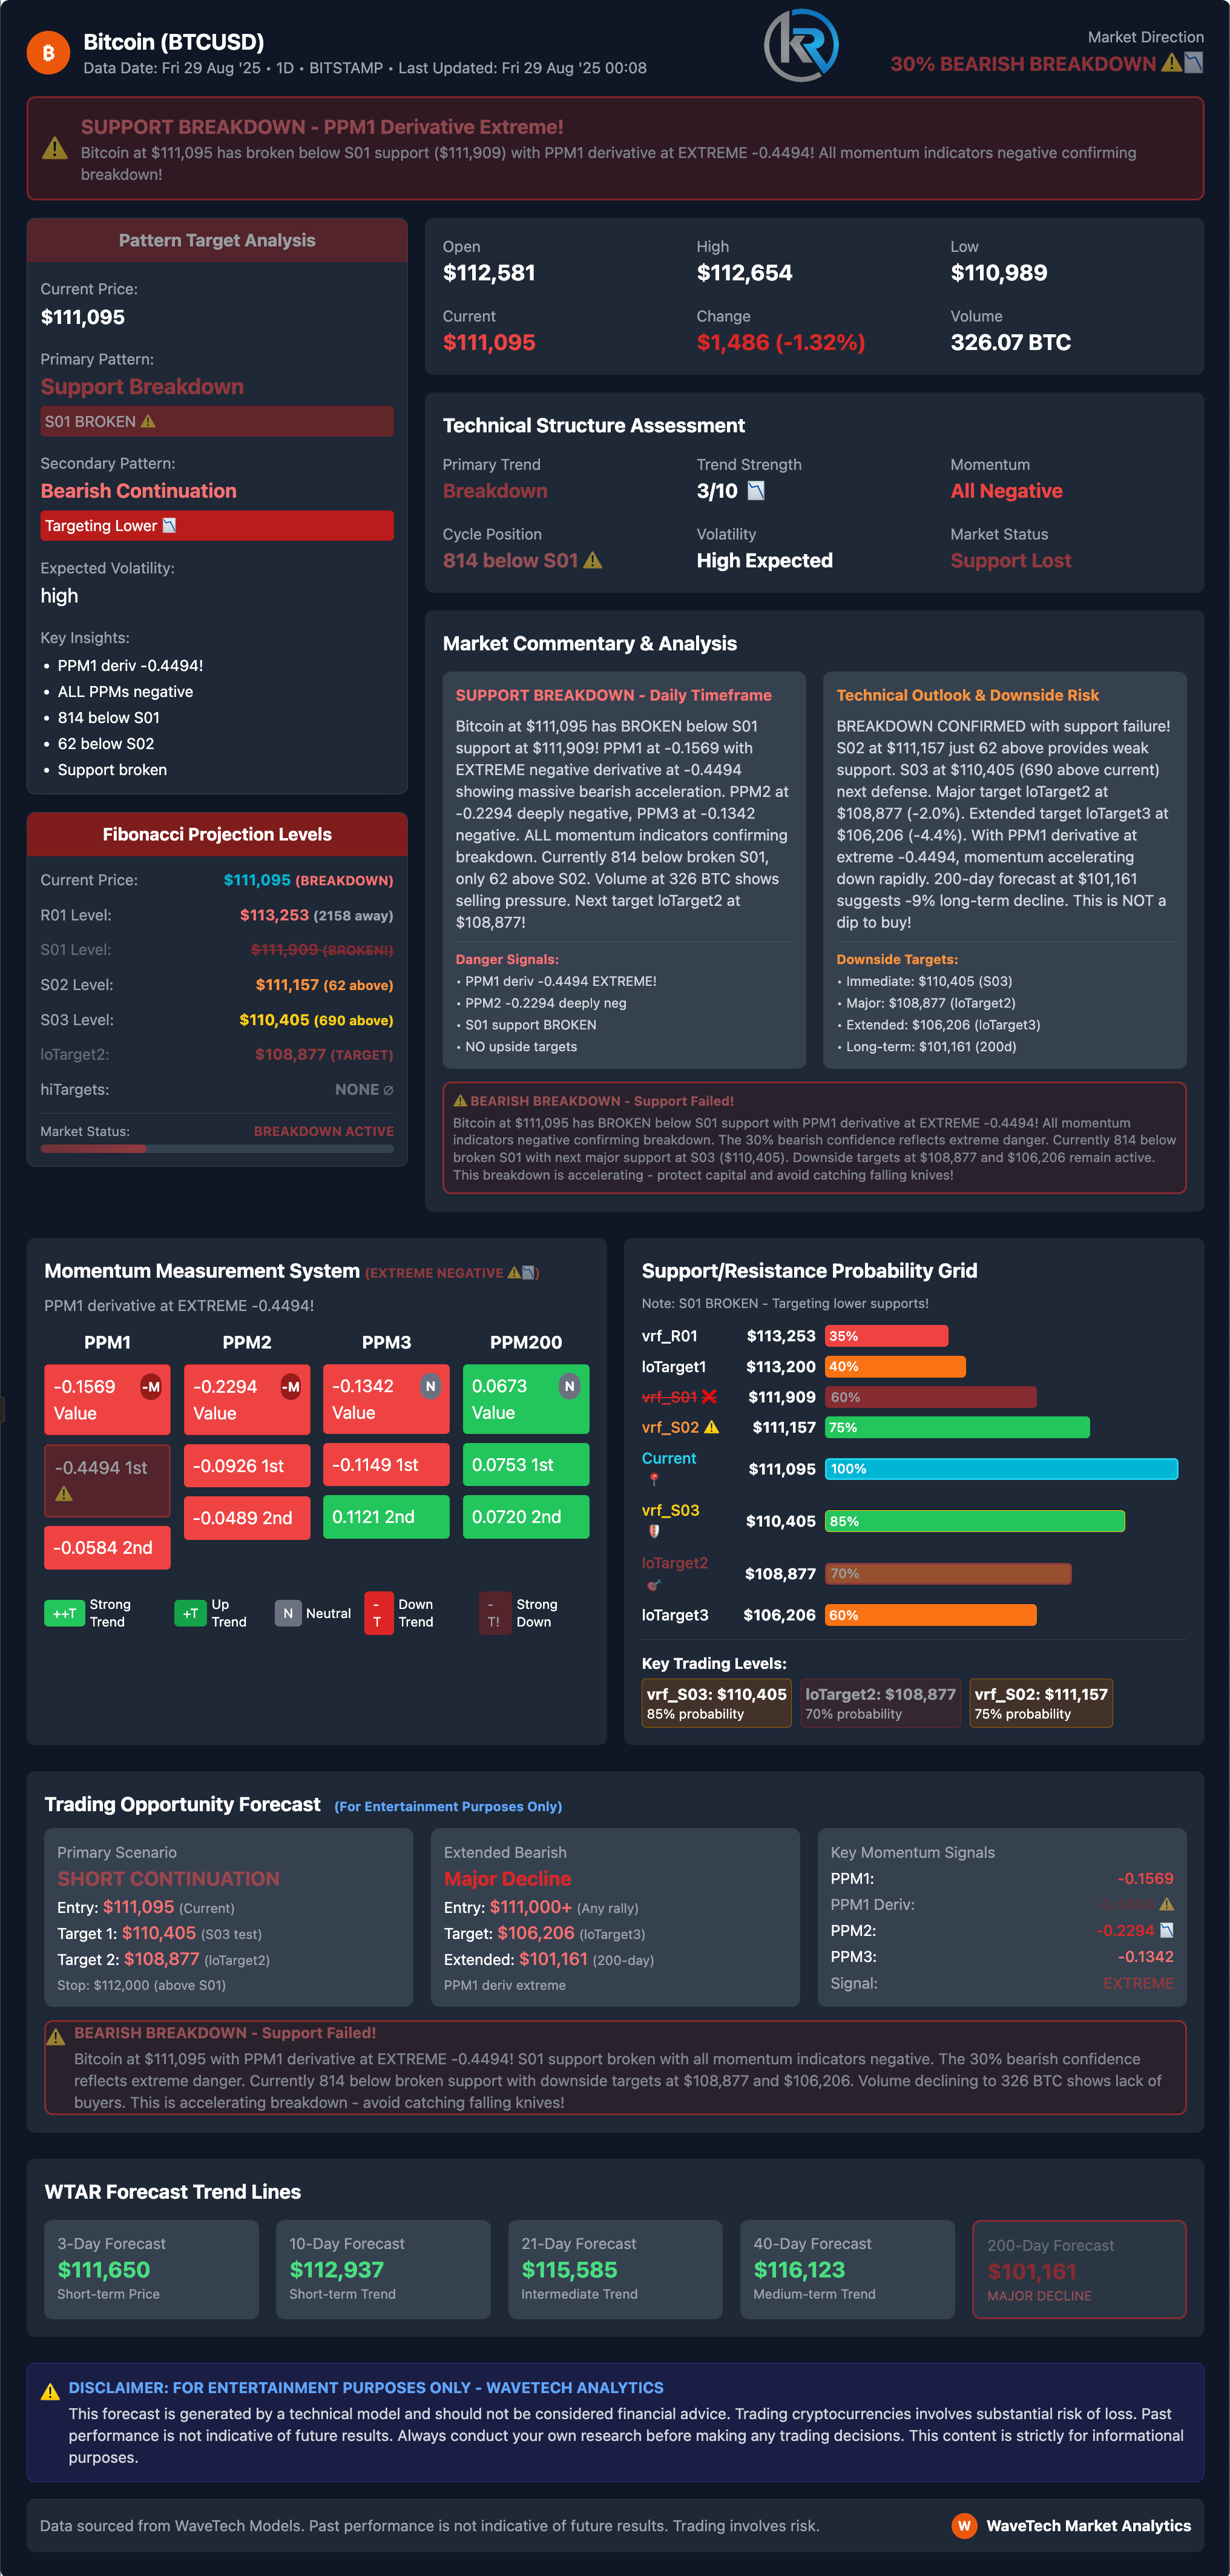
Bitcoin
Economic releases for the week of August 25.
Aug 29
08:30 ET: Personal Income For: Jul | Trading Impact: High | KR Forecast: 0.3% | KR Cons: 0.4% | Prior: 0.3%
08:30 ET: Personal Spending For: Jul | Trading Impact: High | KR Forecast: 0.4% | KR Cons: 0.5% | Prior: 0.3%
08:30 ET: PCE Prices For: Jul | Trading Impact: High | KR Forecast: 0.2% | KR Cons: 0.2% | Prior: 0.3%
08:30 ET: PCE Prices - Core For: Jul | Trading Impact: High | KR Forecast: 0.3% | KR Cons: 0.3% | Prior: 0.3%
08:30 ET: Adv. Intl. Trade in Goods For: Jul | Trading Impact: Low | KR Forecast: NA | KR Cons: NA | Prior: -$96.4B
08:30 ET: Adv. Retail Inventories For: Jul | Trading Impact: Low | KR Forecast: NA | KR Cons: NA | Prior: 0.3%
08:30 ET: Adv. Wholesale Inventories For: Jul | Trading Impact: Low | KR Forecast: NA | KR Cons: NA | Prior: 0.2%
09:45 ET: Chicago PMI For: Aug | Trading Impact: Low | KR Forecast: 48.5 | KR Cons: 46.0 | Prior: 47.1
10:00 ET: Univ. of Michigan Consumer Sentiment - Final For: Aug | Trading Impact: Low | KR Forecast: 59.0 | KR Cons: 58.6 | Prior: 58.6
Robert Kendall
Chief Analyst
"Disclaimer for “The Kendall Report
The information provided in "The Kendall Report" is for general informational and educational purposes only. The opinions, analyses, and forecasts included in this newsletter are based on the author's personal views and experiences and are provided as is without warranty of any kind.
While we strive to provide accurate and up-to-date information, we do not guarantee the accuracy, completeness, reliability, or timeliness of any information contained in this newsletter. The information presented should not be construed as financial, investment, legal, or other professional advice. It does not constitute a recommendation or endorsement of any particular investment strategy, financial instrument, product, or service.
Investors should consider their financial situation, objectives, and risk tolerance before making investment decisions based on the information provided. The financial market is subject to high risk and volatility. Past performance is not indicative of future results. Investing in the financial market involves the risk of loss, including the loss of principal.
"The Kendall Report" and its contributors will not be liable for any direct, indirect, incidental, consequential, or exemplary damages arising from the use or inability to use the information provided in this newsletter, including but not limited to losses or missed gains.
By accessing and using "The Kendall Report," you acknowledge and agree to this disclaimer and assume full responsibility for the use of the information provided. We reserve the right to make changes to the content of this newsletter at any time without notice.
This disclaimer is subject to change at our discretion, and it is the reader's responsibility to review it regularly for any updates.