
Market Respond But...
Is Inflation Really Under Control

KR Opinion
As expected, the equity markets demonstrated increased volatility with a general upward trend. We witnessed what I often call a "stampede market," characterized by waves of buying that pushed most indexes up over 1%+ for the session.
Typically, Consumer Price Index (CPI) and Producer Price Index (PPI) numbers align closely. However, the CPI will be released tomorrow morning before the market opens, which is likely to trigger further volatility.
Market sentiment suggests that inflation is under control, leading to expectations of Federal Reserve rate cuts as soon as September. However, a conflicting narrative is emerging: some analysts interpret lower inflation as a signal of an impending recession, suggesting weakening demand is driving prices down.
Interestingly, we're observing a disconnect between market commentators' thoughts and market participants' actions. While pundits debate the implications of lower inflation, we've seen the market surge vertically on these numbers. This divergence between analysis and action is a classic scenario in such market conditions.
Despite the upward trend of the last four sessions and the likelihood of further gains over the next 5 to 8 sessions as we approach key resistance levels, the market is still searching for a clear direction. Based on the Government metrics, inflation appears to decreasing, even if this isn't readily apparent in everyday expenses like groceries, gasoline, and other staples.
This discrepancy might be due to reduced corporate price gouging, normalization of supply chains, or increases in economic activities that previously contributed to inflation. The exact cause is less important than the trend toward stabilization.
I'm reconsidering my earlier predictions about a potential inflation uptick in September and October. We won't see September's numbers until October and October's until November.
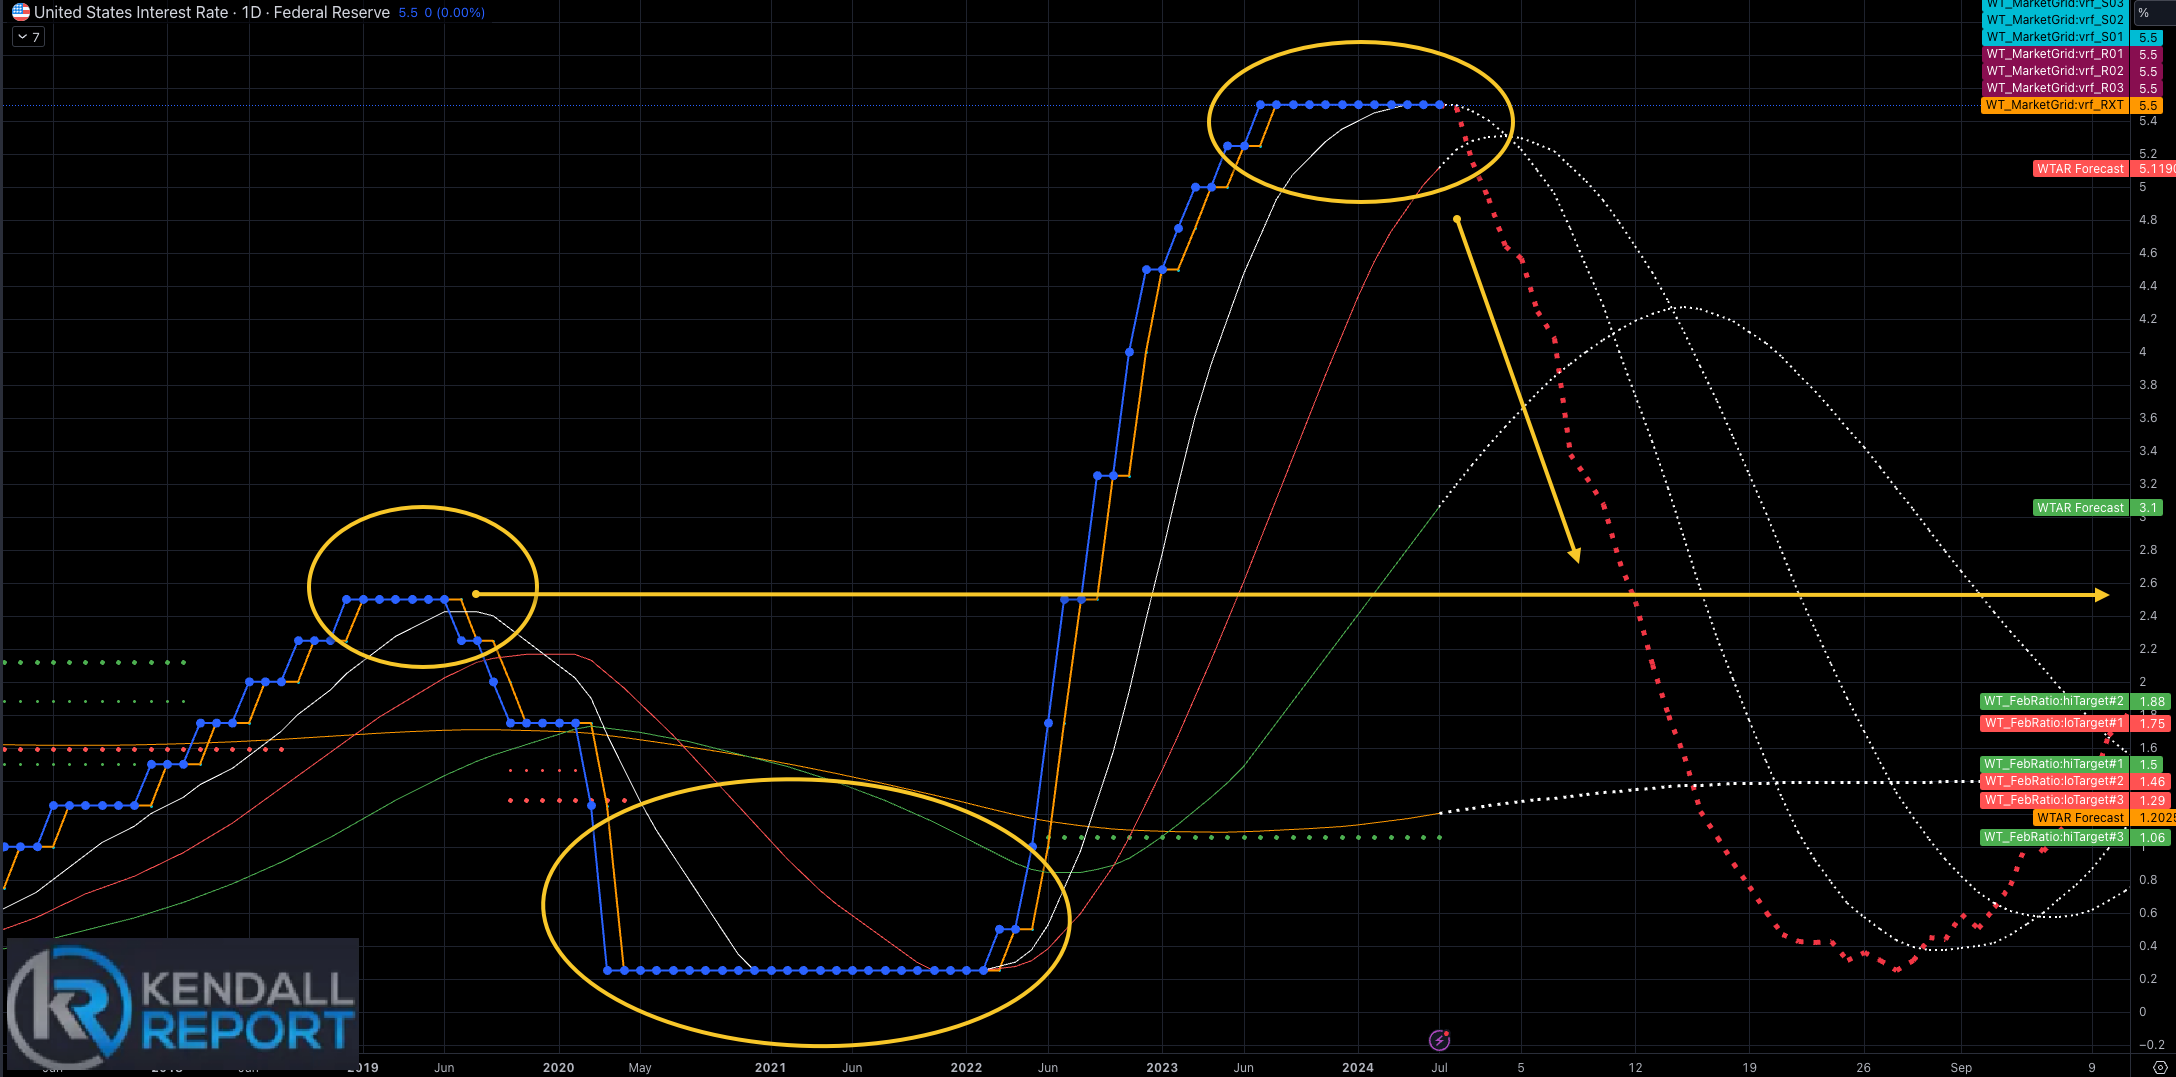
The Federal Reserve will analyze these trends as it approaches its September meeting. While a quarter-percent drop in the front end of the yield curve might not be significant, market participants seem to be pricing in expectations of such moves.
As we progress through the week, we'll get the CPI numbers before the market opens and additional employment data, including claims and continued claims, on Thursday. I'll provide more details on these in tomorrow's report.
Overall, the market has stabilized. The perceived risk of the carry trade, which dominated market narratives for about three sessions last week, has subsided as reality set in.
Expectations now lean towards maintaining the status quo, with markets likely to remain in a broad sideways trading range. This range could represent a 7%+ (high-low) swing for the NASDAQ, with other indexes potentially seeing even wider fluctuations.
In conclusion, while we may see some continuation of the current trend, we're still in a corrective phase following the overblown carry trade narrative that briefly suggested a market crash. The key is to watch for confirmation or contradiction of these trends in the upcoming economic data releases.
Looking Back on Tuesday’s action
The stock market surged today, with all major indices climbing at least 1.0%. The rally was broad-based, advancing stocks outnumbering decliners by 4-to-1 on the NYSE and nearly 3-to-1 on the Nasdaq. This positive momentum was fueled by encouraging July Producer Price Index (PPI) data.
July's PPI figures showed signs of cooling inflation, with total PPI rising just 0.1% month-over-month, which aligns with expectations. Core PPI, which excludes volatile food and energy prices, remained flat, below the anticipated 0.2% increase. Year-over-year, total PPI growth slowed to 2.2% from June's 2.7%, while core PPI eased to 2.4% from 2.9%.
This welcome disinflation boosted optimism about potential Federal Reserve rate cuts, lowering yields and lifting equities. The upward trend may persist if the July Consumer Price Index, set for release tomorrow at 8:30 ET, aligns with market expectations.
Treasury yields, already depressed by weak economic data from China and the eurozone, fell further following the PPI report. The 10-year note yield dropped six basis points to 3.85%, while the 2-year note yield, typically more responsive to changes in the federal funds rate, declined eight basis points to 3.94%.
The S&P 500 closed above 5,400 for the first time since August 1, rebounding from last Monday's sharp selloff triggered by the jobs report. The rally was widespread, with ten of the eleven S&P 500 sectors gaining ground. Leading the charge were information technology (+3.0%), consumer discretionary (+2.4%), communication services (+1.5%), and health care (+1.2%).
The energy sector was the sole decliner, falling 1.0% amid dropping commodity prices. WTI crude oil futures settled 1.9% lower at $78.37 per barrel, while natural gas futures dipped 1.4% to $2.16 per MMBtu.
Home Depot (HD) closed up 1.2% among individual stocks despite initially trading down 1.9% on below-consensus guidance. Starbucks (SBUX) emerged as the S&P 500's top performer, soaring 24.5% following news of a CEO change, with Chipotle (CMG).
· Nasdaq Composite:+14.5% YTD
· S&P 500: +13.9% YTD
· S&P Midcap 400: +6.2% YTD
· Dow Jones Industrial Average: +5.5% YTD
· Russell 2000: +3.4% YTD
Reviewing Tuesday’s economic releases:
July Economic Data:
- NFIB Small Business Optimism Index: 93.7, up from 91.5 in June
- Producer Price Index (PPI):
- Total PPI: +0.1% month-over-month (matching KR Forecast)
- Core PPI (excluding food and energy): 0.0% (below KR Forecast of 0.2%)
- Note: June's Core PPI was revised down to 0.3% from 0.4%
Key Insight: The slowing inflation trend in total and core PPI is moving in a direction that could support a future rate cut by the Federal Reserve.
Upcoming Economic Reports (Wednesday):
- 7:00 ET: Weekly MBA Mortgage Index (previous reading: +6.9%)
- 8:30 ET: July Consumer Price Index (CPI)
- Total CPI: KR Forecast 0.2% (previous: -0.1%)
- Core CPI: KR Forecast 0.2% (previous: 0.1%)
- 10:30 ET: Weekly crude oil inventories (previous: -3.73 million barrels)
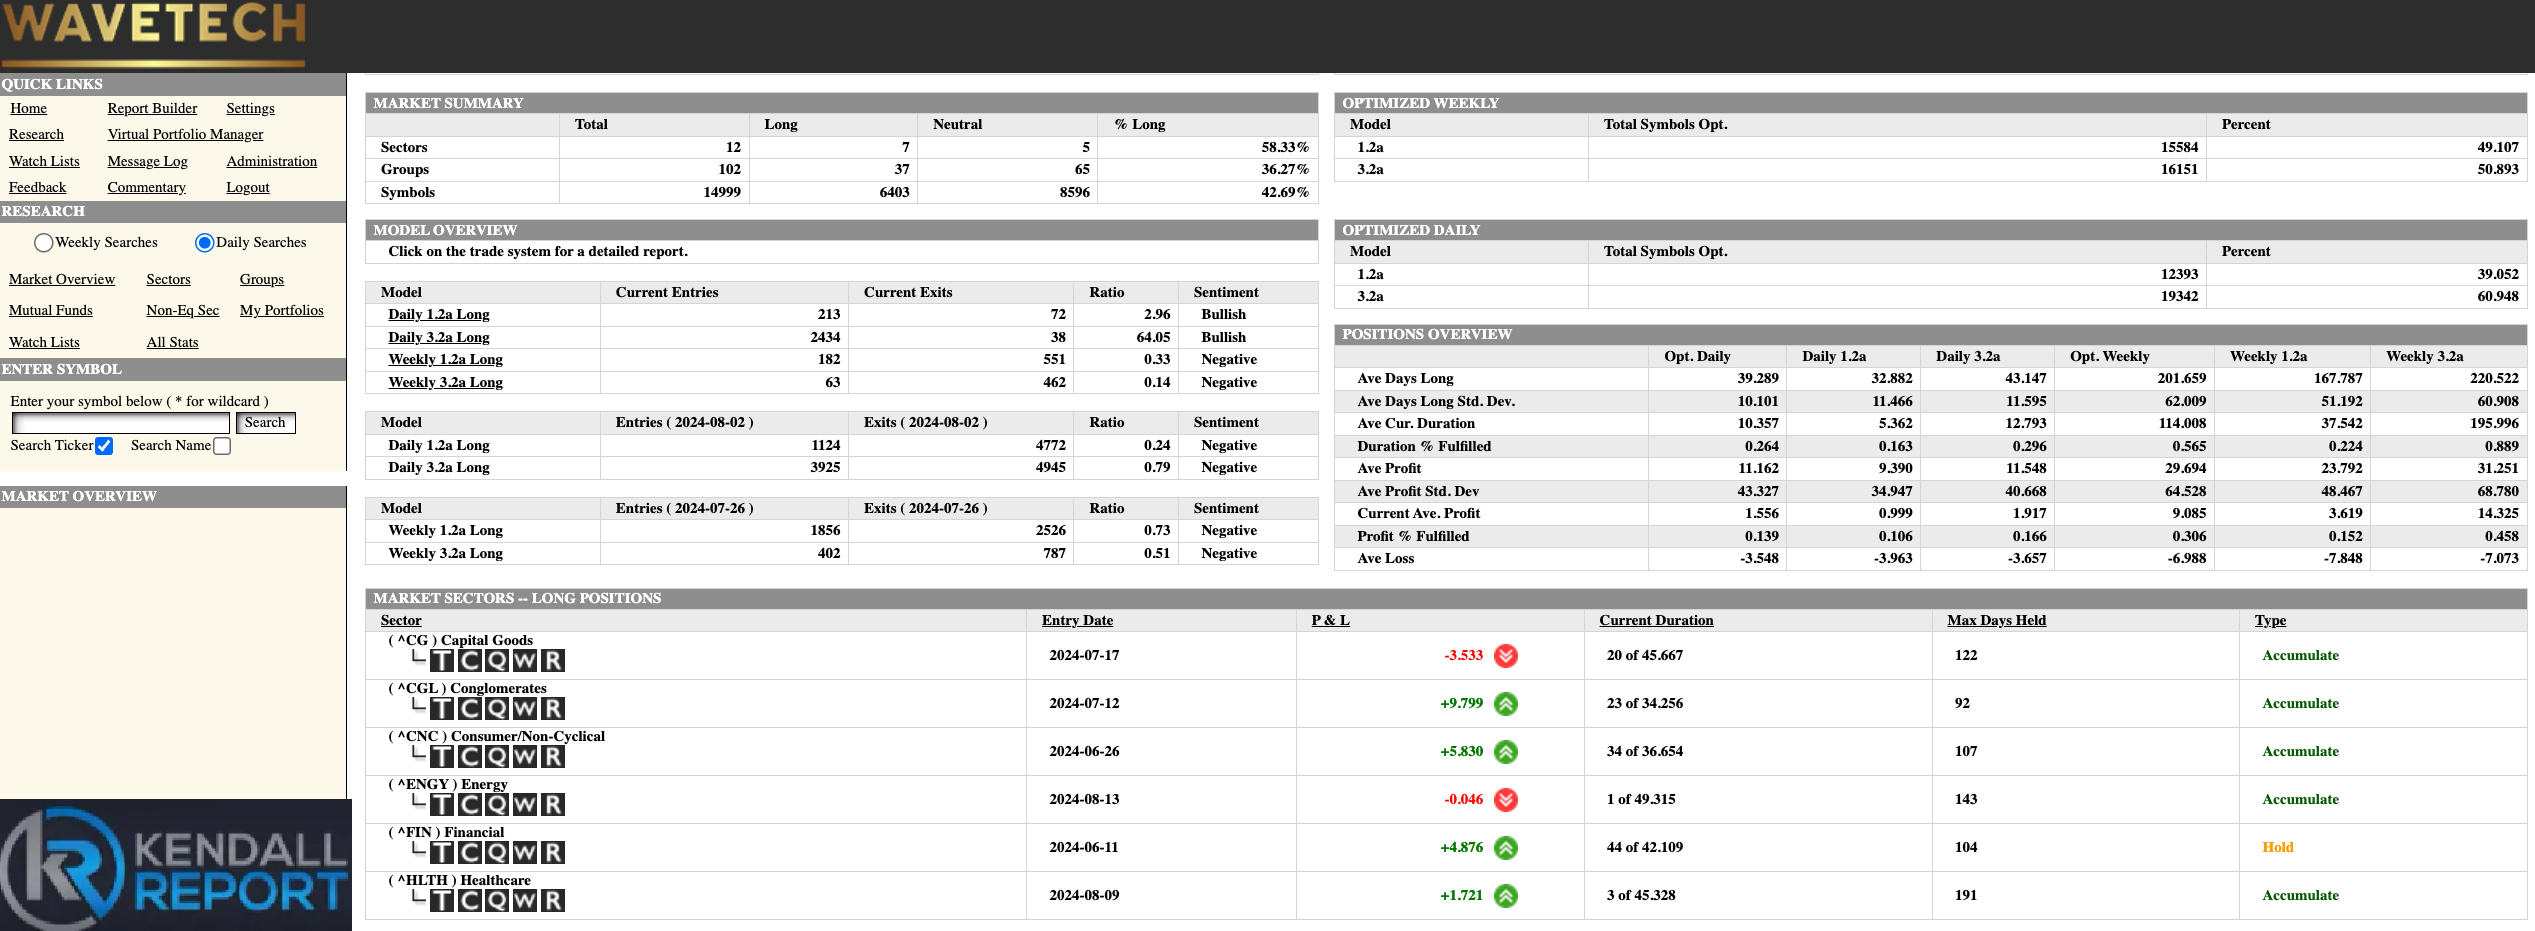
WaveTech Database
The Wave Tech database evidences that yesterday's market rally was notably broad-based. We issued 2,747 new entries and only 111 exits, pushing the short-term bullish percentage to 42.69%.
This significant level represents the minimum threshold needed to anticipate a stable to upward trend in the short term, typically lasting between 20 to 34 trading days.
It's important to note that we're already partway through this cycle, with approximately 25% of the expected holding period already behind us. Based on this statistic, we can anticipate another 15 to 20 sessions with an upward bias. However, the sustainability of this trend is crucial. We need to consistently maintain this bullish percentage above 42%. If market volatility causes this number to drop and fail to recover for several days, it could invalidate this bullish outlook.
Adding to the positive sentiment, we observed a new buy signal in the service sector. This development suggests an expansion in market participation across a broader base, further confirming the stabilization of the markets.
However, it's crucial to temper expectations. While we're seeing robust buying activity, this doesn't necessarily indicate that we're on the verge of setting new all-time highs.
As mentioned in the opening comments, the market will likely remain within a broad trading range for the next 8 to 12 weeks before we see any significant shift in this forecast.
This range-bound behavior is typical during market consolidation when investors digest recent gains and await further economic data or catalysts to drive the next major move. The broad participation we're seeing suggests a healthy market but one that's still seeking direction for its next significant trend.
In summary, while the short-term outlook appears bullish based on current metrics, the medium-term picture suggests a period of consolidation within a wide trading range.
S&P 500 Futures
