
Market Sentiment Unbreakable?
Bitcoin Stalls Again!

KR Opinion
This week marks an important transition as we approach significant economic data releases, particularly beginning with Wednesday's ADP employment numbers. While the labor market will be a crucial focus, other economic indicators will also be forthcoming. However, current analysis suggests we shouldn't expect any major shifts in the overall economic outlook. While there might be minor adjustments to expectations, no material changes appear likely.
An interesting pattern has emerged regarding the NASDAQ's performance. When I identify a slightly weaker NASDAQ profile, I've noticed that the index often outperforms expectations. This phenomenon appears linked to the strong correlation between the S&P and NASDAQ indexes. The NASDAQ's higher beta characteristics result in amplified returns on these particular days. It's worth noting that this occurs within the context of an overall upward trend, as both the NASDAQ and S&P continue to reach new all-time highs. The day-to-day metrics between these indices continue to show dynamic relationships despite their shared upward trajectory.
A recent in-depth analysis of the database, conducted sector-by-sector, has revealed potential maturity dates for current bull cycles. While some cycles may conclude later this year, most projected completion dates fall between February and March of next year or even later. This timing analysis is becoming a crucial focus, as it significantly influences the information presented in the Kindle report. I will continue developing and refining metrics around these expectations due to their importance in understanding market cycles.
These maturity projections are particularly significant as they help frame our understanding of sector-specific momentum and potential transition points in the market. The analysis provides valuable context for understanding how different market segments might evolve over the coming months, which is essential for strategic planning and risk assessment.
Looking Back on Monday’s Action
The financial markets kicked off December with a mixed performance, as evidenced by divergent moves in major indices. While the S&P 500 and Nasdaq Composite reached new record heights with gains of 0.2% and 1.0% respectively, the Dow Jones Industrial Average moved in the opposite direction, falling 0.3%. This split performance reflected a lack of solid market conviction, with trading volume relatively balanced between buyers and sellers.
The semiconductor sector gained notable momentum after news of less severe than-expected export restrictions to China boosted confidence. This positive sentiment in chipmakers and strength in mega-cap stocks helped drive the broader market higher. The impact was obvious in specific sectors, with communication services leading the way up 1.5%, followed by consumer discretionary and information technology sectors posting gains of 1.1% and 1.0%, respectively. However, the remaining eight sectors of the market ended the day in negative territory, with utilities experiencing the steepest decline of 2.1%.
An interesting development emerged in the semiconductor space when Intel made headlines. The stock initially surged nearly 6% on news of leadership changes, with CEO Pat Gelsinger's departure and the appointment of interim co-CEOs, but ultimately closed down 0.5% at $23.93 as investors digested the implications of this transition.
Despite new developments in the Middle East, including President-elect Trump's warnings regarding hostages and reports from The New York Times about exchanges of fire between Israel and Hezbollah, financial markets showed limited reaction. Treasury yields increased slightly, with the 10-year yield rising two basis points to 4.20%, while oil prices remained relatively stable, closing at $68.07 per barrel, up just 0.3%.
The day also brought significant commentary from Federal Reserve officials. Atlanta Fed President Bostic, a voting member of the FOMC, expressed satisfaction with economic conditions, while Fed Governor Waller indicated support for a potential rate cut at the December meeting. This led to a notable shift in market expectations, with fed funds futures now indicating a 79.0% probability of a December rate cut, up significantly from 66.0% just a day earlier and 52.3% from the previous week.
The U.S. dollar strengthened considerably in currency markets, with the Dollar Index climbing 0.7% to 106.46. This move came in response to President-elect Trump's statement about implementing 100% tariffs on countries attempting to abandon the dollar as the global reserve currency.
Nasdaq Composite: +29.3%
S&P 500: +26.8%
S&P Midcap 400: +20.7%
Russell 2000: +20.1%
Dow Jones Industrial Average: +18.8%
Monday's economic data painted a mixed but generally improving picture of the U.S. economy. The final reading of the November S&P Global US Manufacturing PMI was 49.7, improving from the previous mark of 48.5 but still below the 50.0 threshold that separates expansion from contraction.
The November ISM Manufacturing Index also showed signs of improvement, rising to 48.4% versus the KR Forecast consensus of 47.6% and moving up from October's reading of 46.5%.
While overall manufacturing activity remains in contractionary territory, there was an encouraging development in the new orders component, which expanded for the first time after seven consecutive months of contraction.
Construction spending for October exceeded expectations, increasing 0.4% compared to the KR Forecast consensus of 0.1% and the previous month's 0.1% gain. The residential construction sector showed particular strength, with single-family home construction leading the improvement.
Looking ahead to Tuesday's economic calendar, market participants will focus on the October JOLTS Job Openings report, scheduled for release at 10:00 ET. This report will provide important insights into labor market dynamics and job availability across various sectors of the economy.
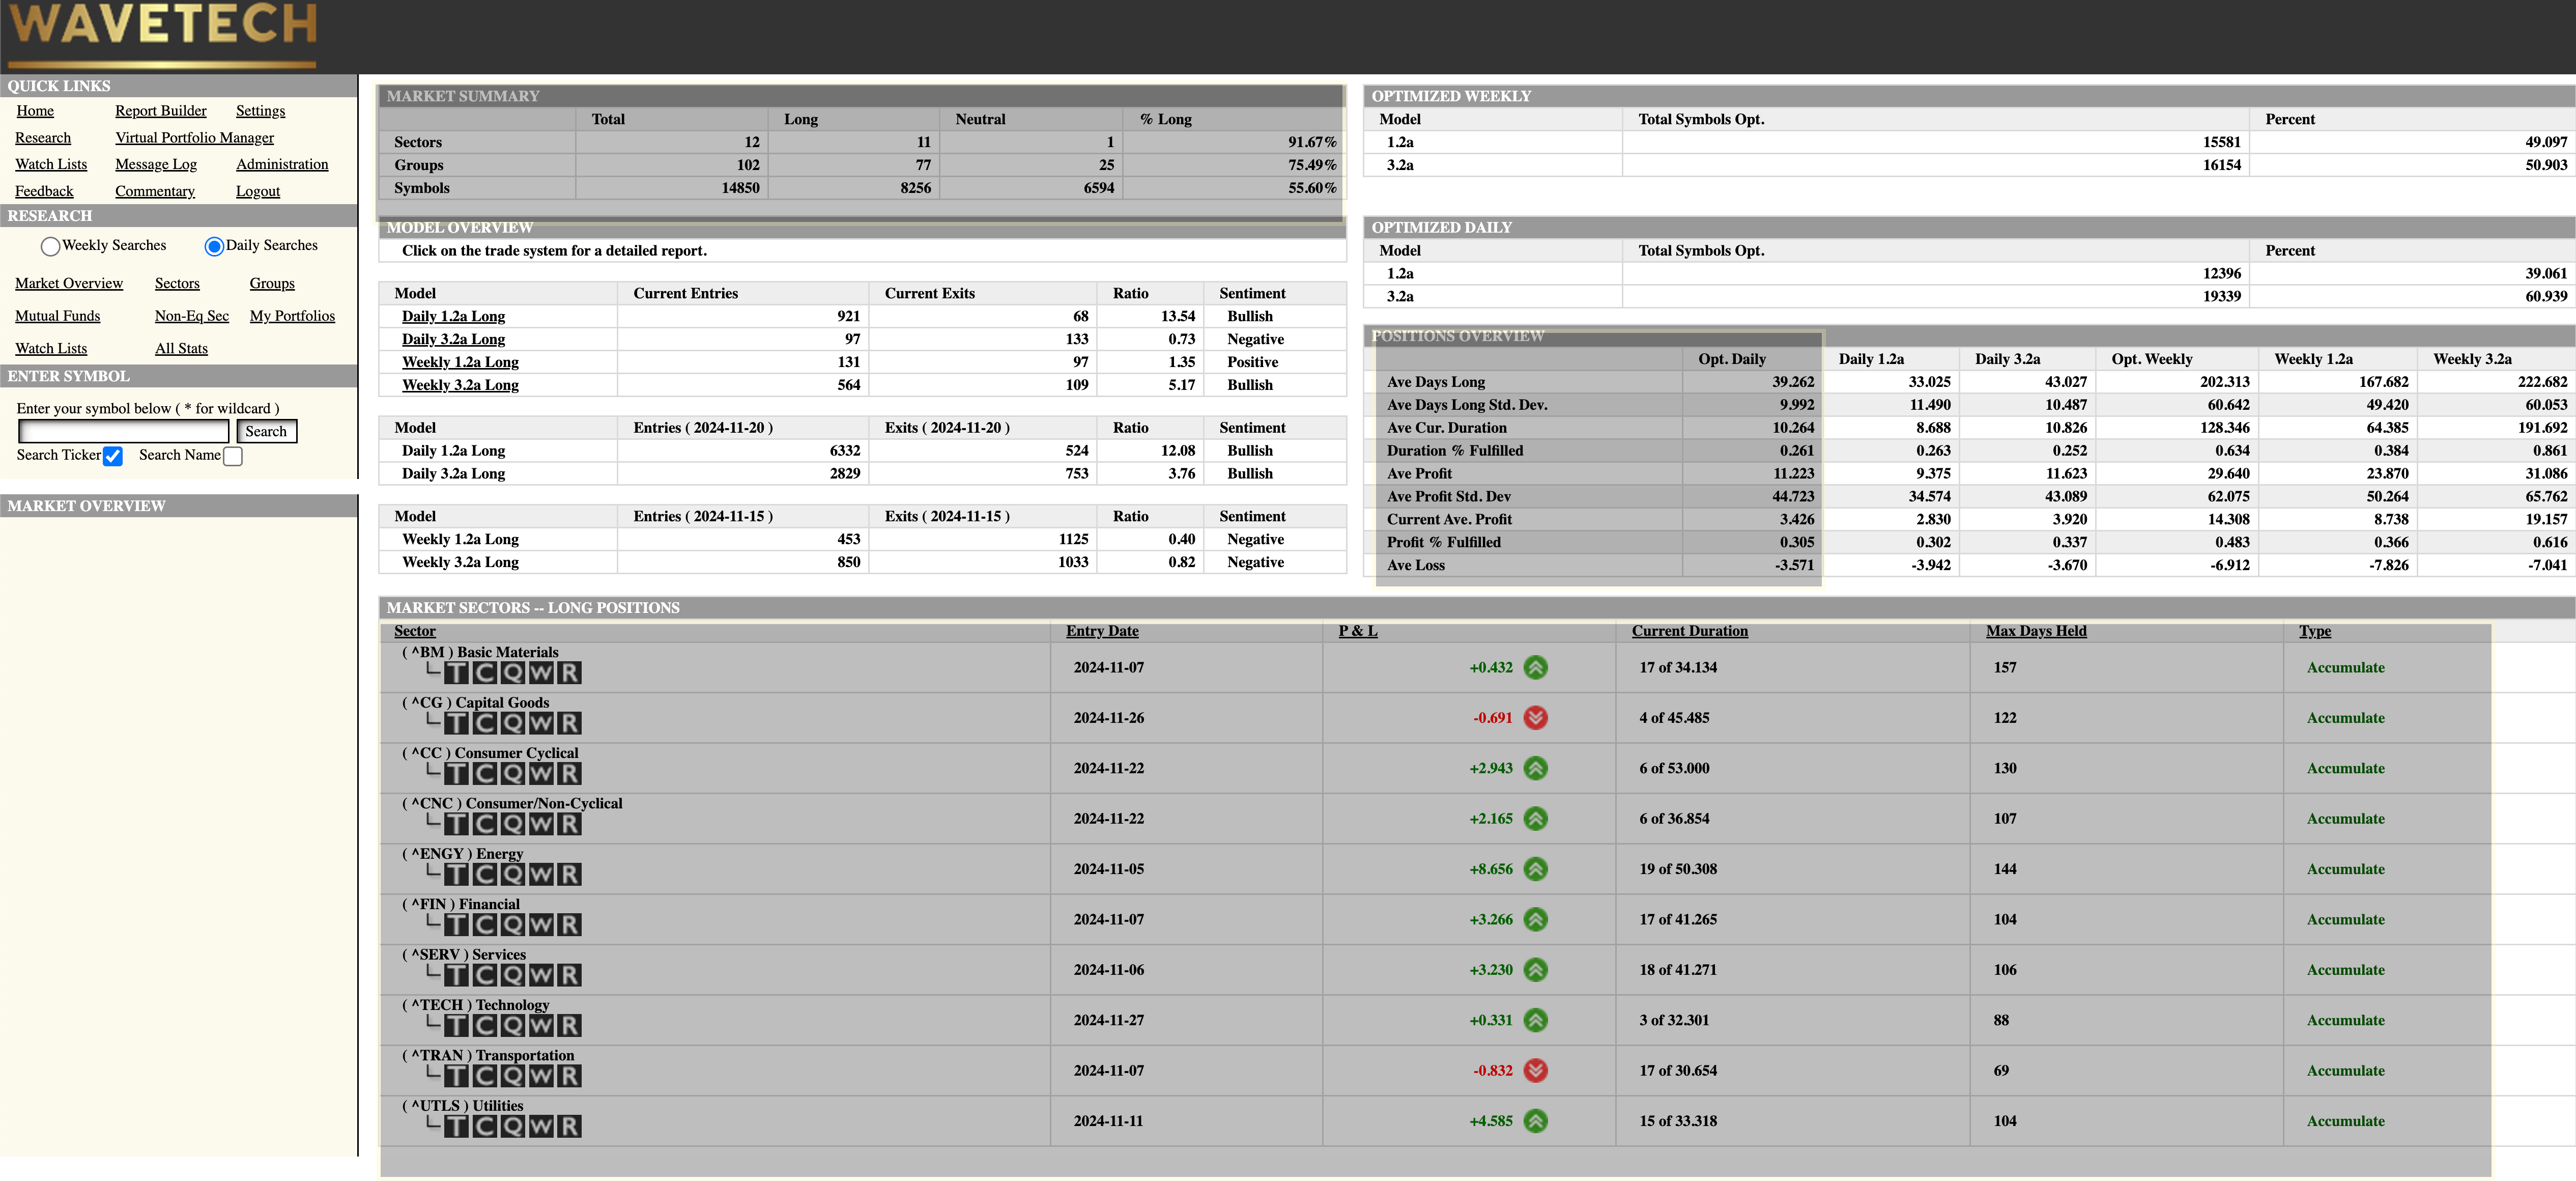
WaveTech Database
The short-term database shows significant momentum, with 1,018 new entries and 201 exits recently recorded. The bullish sentiment has reached 55.60%, and the underlying market trends demonstrate increasing strength as we progress.
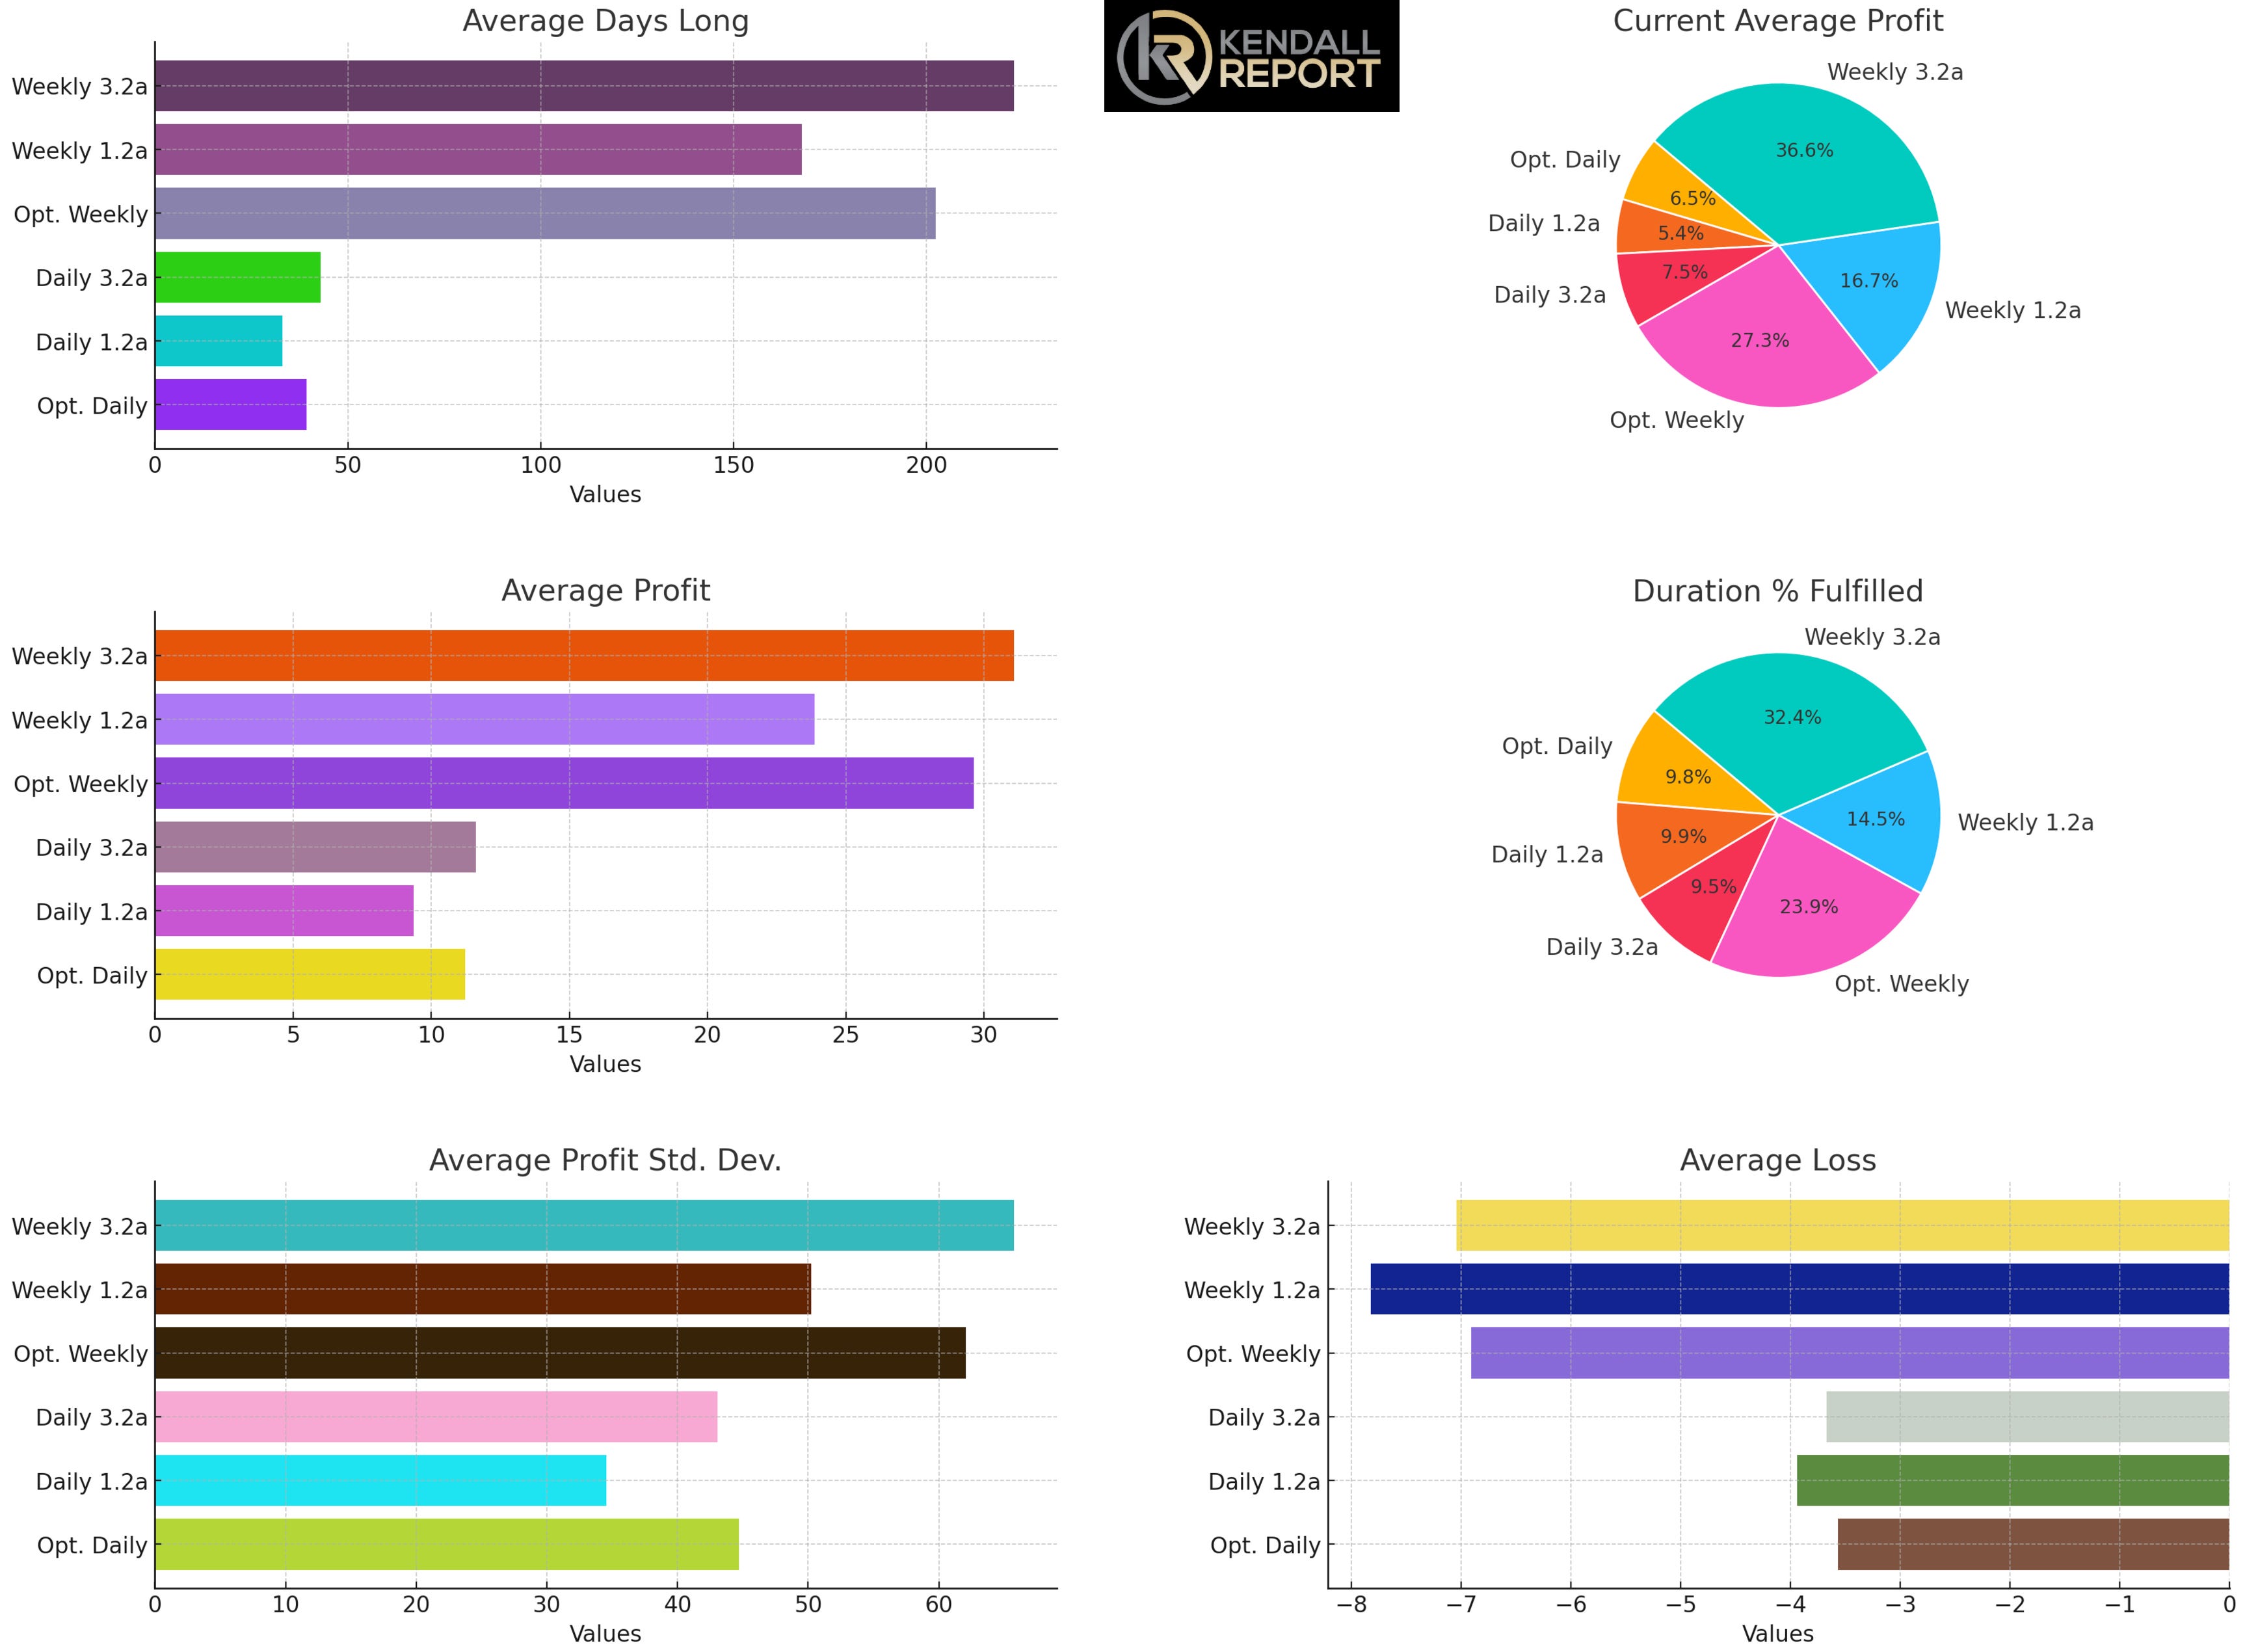
Looking at the current market cycle through our dashboard metrics, several essential patterns emerge. The weekly 1-2 models currently have only 36% of their typical duration, while the daily models show meager participation rates. These indicators suggest we're still in the early stages of this market cycle, and forward-looking analysis points to substantial potential for further development.
Regarding maturity expectations across sectors, it's essential to understand that we typically use a 70% threshold of maximum duration as our benchmark rather than waiting for 100% completion. This approach is based on historical data showing that most sector movements typically mature between 68% and 72% of their theoretical maximum duration. While some sectors occasionally exceed these parameters, this 70% threshold has proven to be a reliable indicator for estimating cycle completion.
The 70% yield factor we employ suggests that while we have projected end dates for various sectors, these timelines could extend further. However, it's crucial to note that not all trades will reach even the 70% duration mark – some may conclude earlier, which affects our statistical models. This framework provides a general guideline for understanding where each market sequence is likely to conclude, though actual results may vary based on market conditions and sector-specific factors.
These projections serve as a practical tool for understanding the broader market context while maintaining flexibility to adapt to changing conditions and early exits that might affect our statistical models. The database continues to serve as a valuable resource for tracking these patterns and adjusting our expectations accordingly.
Basic Materials:
- Entry: December 4, 2023
- 70% of Max Duration: 210 days
- Expected Maturity: January 20, 2025
- Current Status: 251 days elapsed, position mature
Capital Goods:
- Entry: September 16, 2024
- 70% of Max Duration: 113 days
- Expected Maturity: March 8, 2025
- Current Status: 55 days elapsed, 58 days remaining
Conglomerates:
- Entry: November 11, 2024
- 70% of Max Duration: 316 days
- Expected Maturity: December 23, 2025
- Current Status: 15 days elapsed, 301 days remaining
Consumer Cyclical:
- Entry: September 16, 2024
- 70% of Max Duration: 130 days
- Expected Maturity: March 25, 2025
- Current Status: 55 days elapsed, 75 days remaining
Consumer/Non-Cyclical:
- Entry: March 25, 2024
- 70% of Max Duration: 200 days
- Expected Maturity: February 10, 2025
- Current Status: 175 days elapsed, 25 days remaining
Energy:
- Entry: November 25, 2024
- 70% of Max Duration: 222 days
- Expected Maturity: August 4, 2025
- Current Status: 5 days elapsed, 217 days remaining
Financial:
- Entry: November 27, 2023
- 70% of Max Duration: 208 days
- Expected Maturity: January 15, 2025
- Current Status: 256 days elapsed, position mature
Services:
- Entry: November 20, 2023
- 70% of Max Duration: 111 days
- Expected Maturity: Past due
- Current Status: 260 days elapsed, exceeded duration
Technology:
- Entry: May 22, 2023
- 70% of Max Duration: 143 days
- Expected Maturity: Past due
- Current Status: 386 days elapsed, exceeded duration
Utilities:
- Entry: March 4, 2024
- 70% of Max Duration: 184 days
- Expected Maturity: January 24, 2025
- Current Status: 190 days elapsed, position mature
Database-Wide Analysis:
- Average Expected Duration (70% of max): 183.7 days
- Average Current Duration: 164.8 days
- Mean Expected Maturity Date: April 15, 2025
- Median Expected Maturity Date: March 8, 2025
Key Observations:
1. Three positions (Services, Technology) are significantly past their target maturity dates but showing strong returns
2. Three positions (Basic Materials, Financial, Utilities) are at or near maturity with positive performance
3. Five positions are still within their expected duration windows with varying levels of profitability
4. The spread of maturity dates from now through December 2025 provides good portfolio diversification
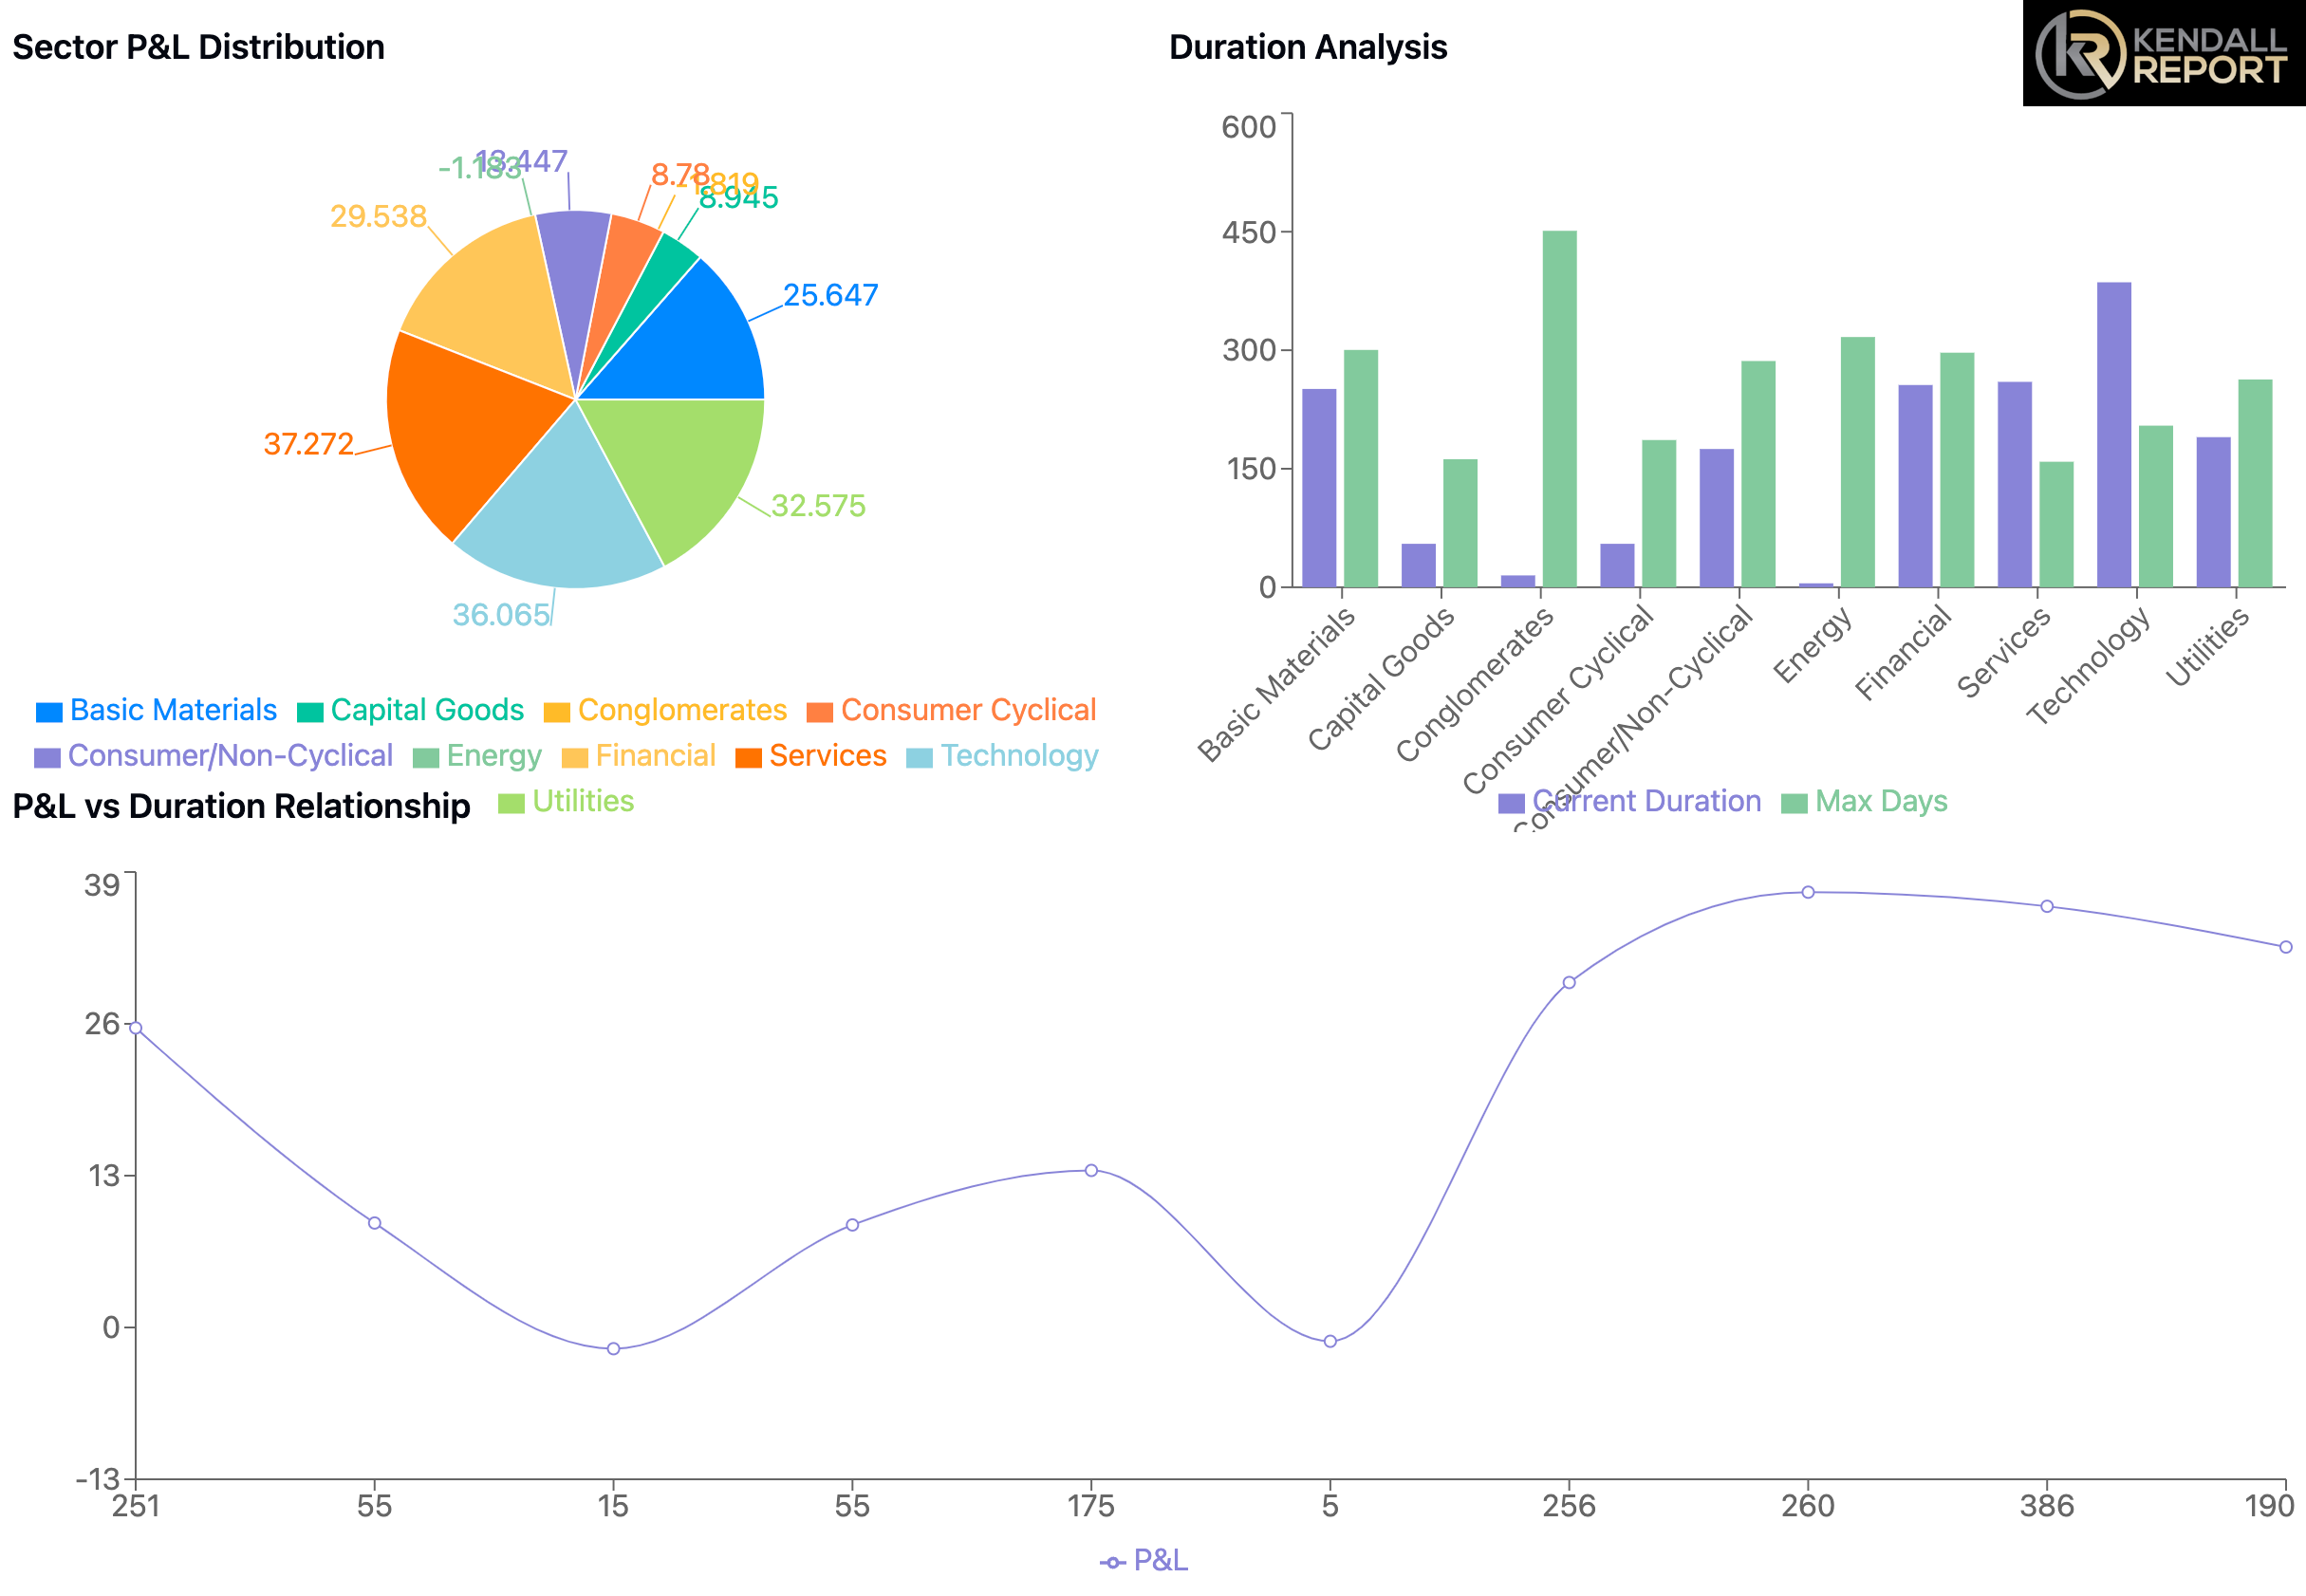
The database illustrates a healthy distribution of maturity dates, though attention may be needed for the overdue positions in Services and Technology. The clustering of several maturities in Q1 2025 suggests potential portfolio rebalancing opportunities.
Get WaveTech For $3.8/day Go Here
