


Market Signaling Intermediate Downward Reversal?

KR Opinion
The market demonstrated resilience in yesterday's trading session, failing to follow through on Tuesday's significant downturn. As highlighted in the previous night's report, hourly algorithmic indicators had suggested a potential rally to the 5565 level, which was realized with the market reaching 5564.
Overnight trading remained relatively pattern-free, but a noticeable bid emerged as the London market opened. This drove the market from about -10 to +8, marking a substantial rally at the London open.
With the Federal Reserve's decision approximately two weeks away, it's crucial to begin analyzing the current interest rate environment and other pertinent factors. The yield curve's recent steepening is a significant development, with the 2-year yield falling below the 10-year yield for the first time since 2023. This shift aligns with previously discussed expectations and will be explored in greater detail in the interest rate section of this report.
Market sentiment is increasingly leaning towards a 50-basis point rate cut in the coming two weeks. While my current stance maintains a 25-basis point cut prediction with 50/50 confidence, the report will outline expectations for four to six 25-basis point reductions in 2025. The recent JOLTS report revealed lower-than-expected job openings, which softened labor demand. The Fed will likely view this development favorably, supporting the case for at least a 25-basis point rate cut in September.
As we approach the end of this holiday-shortened week, the market is expected to continue its sideways, choppy pattern. Significant upside potential appears limited, with the market likely establishing a broad range of expectations. Equities are anticipated to test key levels that have been highlighted in recent days.
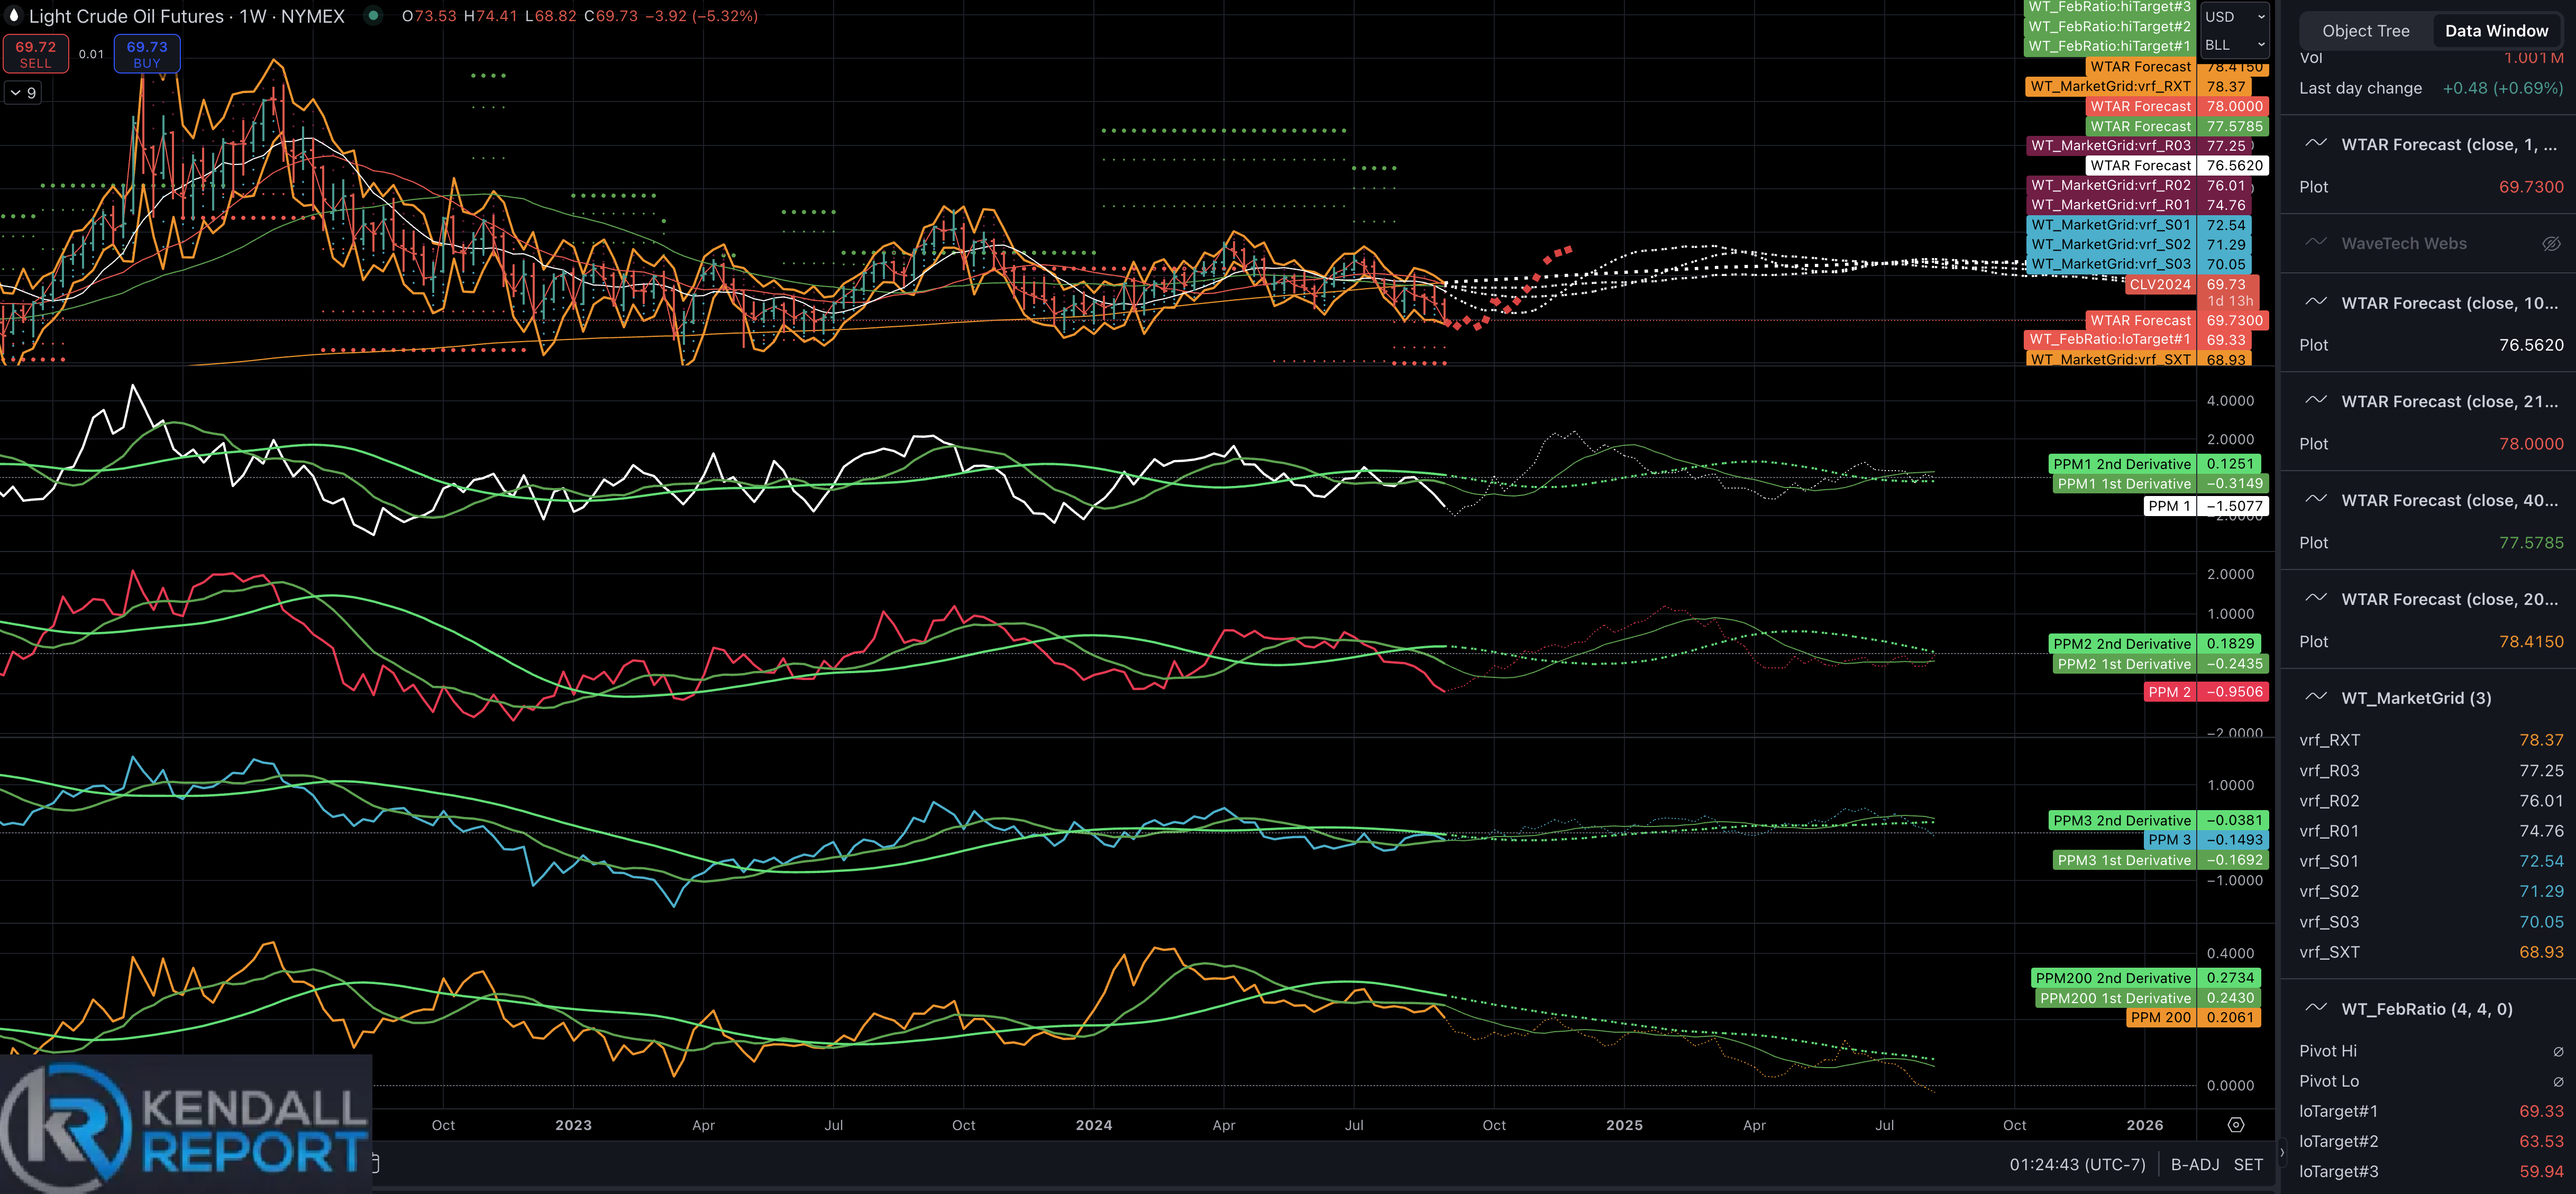
While crude oil is not the focus of tonight's report, it's worth noting that we may be approaching a bottom within the next week or so. Currently trading just below the 200-week moving average at $78.41, Fibonacci targets suggest a possible decline to the $63.53 level. However, having hit the first Fibonacci target to the downside, which coincided with the 200-day moving average, we expect the market to stabilize and potentially turn around next week.
The oil market has followed a pattern since 2023, bouncing off the 200-week moving average and trading within a range of approximately $70 to $84. The current setup doesn't indicate an imminent major decline in oil prices, which is significant for two reasons:
1. It suggests we're not entering a global recessionary period that would typically see a drop in demand and lower prices.
2. The market appears to maintain the pattern observed over the past year and a half.
While Wall Street has been concerned about a potential decline, and we have seen a couple of weak weeks, the expectation is for market stabilization. The chart provided below illustrates these expectations in greater detail.
Looking Back on Wednesday Action
The stock market concluded Wednesday's session with minimal changes from the previous day's close, showcasing a lack of decisive momentum in either direction. Early trading saw the S&P 500 briefly test its 50-day moving average of 5,506, a key technical indicator often watched by traders. While the index momentarily slipped below this level in the afternoon, it ultimately regained ground to finish above this short-term support line.
Market breadth, which measures the number of advancing stocks versus declining ones, reflected investors' need for conviction. This indecisive sentiment contributed to the day's lackluster performance at the index level. Adding to the day's choppy trading was volatility in several mega-cap stocks, notably NVIDIA (NVDA). The tech giant's shares fluctuated in response to reports of a Department of Justice subpoena, which the company subsequently denied. NVIDIA closed down 1.7% at $106.21, a decrease of $1.79.
Investors also digested the latest Job Openings and Labor Turnover Survey (JOLTS) report, which revealed that job openings fell to 7.673 million in July, down from 7.910 million the previous month. This marks the lowest number of job openings since early 2021, potentially signaling a cooling labor market. Market participants are now looking ahead to Thursday's economic calendar, which features additional labor market data, including weekly jobless claims and the ADP Employment Change report for August.
The softening labor market data prompted a decline in Treasury yields as investors began to price in a higher likelihood of Federal Reserve rate cuts. According to the CME FedWatch Tool, the Fed funds futures market now assigns a 45.0% probability of a 50-basis point rate cut at the September 17-18 Federal Open Market Committee (FOMC) meeting, up from 38.0% the previous day.
In the bond market, the 2-year Treasury note yield, particularly sensitive to near-term Fed policy expectations, dropped 12 basis points to 3.77%. The 10-year Treasury note yield also settled at 3.77%, representing an 8 basis point decline from Tuesday's close. This downward movement in yields benefited rate-sensitive sectors, with real estate and utilities outperforming, gaining 0.3% and 0.9%, respectively.
Conversely, the energy sector was the day's notable underperformer, declining 1.4% as oil prices retreated below the $70 per barrel mark. West Texas Intermediate (WTI) crude oil futures settled 1.8% lower at $69.13 per barrel. This decline reflects ongoing concerns about global economic growth prospects and their potential impact on oil demand.
The day's trading activity underscores the current market environment, where investors closely monitor economic data for clues about the Fed's future policy decisions while navigating company-specific news and broader economic concerns. As the week progresses, market participants will likely remain focused on incoming economic reports, particularly those related to the labor market, as they attempt to gauge the economy's strength and anticipate the Fed's next moves.
· S&P 500: +15.7% YTD
· Nasdaq Composite: +13.8% YTD
· Dow Jones Industrial Average: +8.7% YTD
· S&P Midcap 400: +8.0% YTD
· Russell 2000: +5.8% YTD
Reviewing Wednesday’s economic data:
The Weekly MBA Mortgage Applications Index increased by 1.6% from the previous 0.5% rise, indicating a slight uptick in mortgage application activity.
July's Trade Balance was—$78.8 billion, slightly wider than the KR Forecast consensus of—$78.5 billion. The prior month's figure was revised to—$73.0 billion from—$73.1 billion. The key takeaway from this report is the increase in imports. While this may negatively impact Q3 GDP forecasts, it also signals robust demand within the U.S. economy, which is generally seen as a positive indicator.
July Factory Orders increased significantly by 5.0%, surpassing the KR Forecast consensus of 4.5%. This is a marked improvement from the previous month's -3.3%. However, the report's key takeaway suggests that business spending remained sluggish in July despite the overall increase in orders.
The July JOLTS report revealed job openings at 7.673 million, down from the revised prior figure of 7.910 million. This decrease could indicate a gradual cooling in the labor market.
Looking ahead to Thursday's economic calendar:
The August ADP Employment Change report is expected at 8:15 ET. The KR Forecast consensus predicts 150,000 new jobs, up from the previous 122,000.
At 8:30 ET, we'll see the Weekly Initial Claims (KR Forecast consensus: 236,000; prior: 231,000) and Continuing Claims (prior: 1.868 million). The revised Q2 Productivity (KR Forecast consensus: 2.3%) and revised Q2 Unit Labor Costs (KR Forecast consensus: 0.9%) will also be released.
The Final August S&P Global U.S. Services PMI is scheduled for 9:45 ET, with the prior reading at 55.0.
The August ISM Non-Manufacturing Index will be released at 10:00 ET. The KR Forecast consensus is 51.0%, slightly below the prior 51.4%.
The weekly natural gas inventories report is due at 10:30 ET (prior: +35 bcf), followed by the weekly crude oil inventories at 11:00 ET (prior: -0.85 million barrels).
WaveTech Database
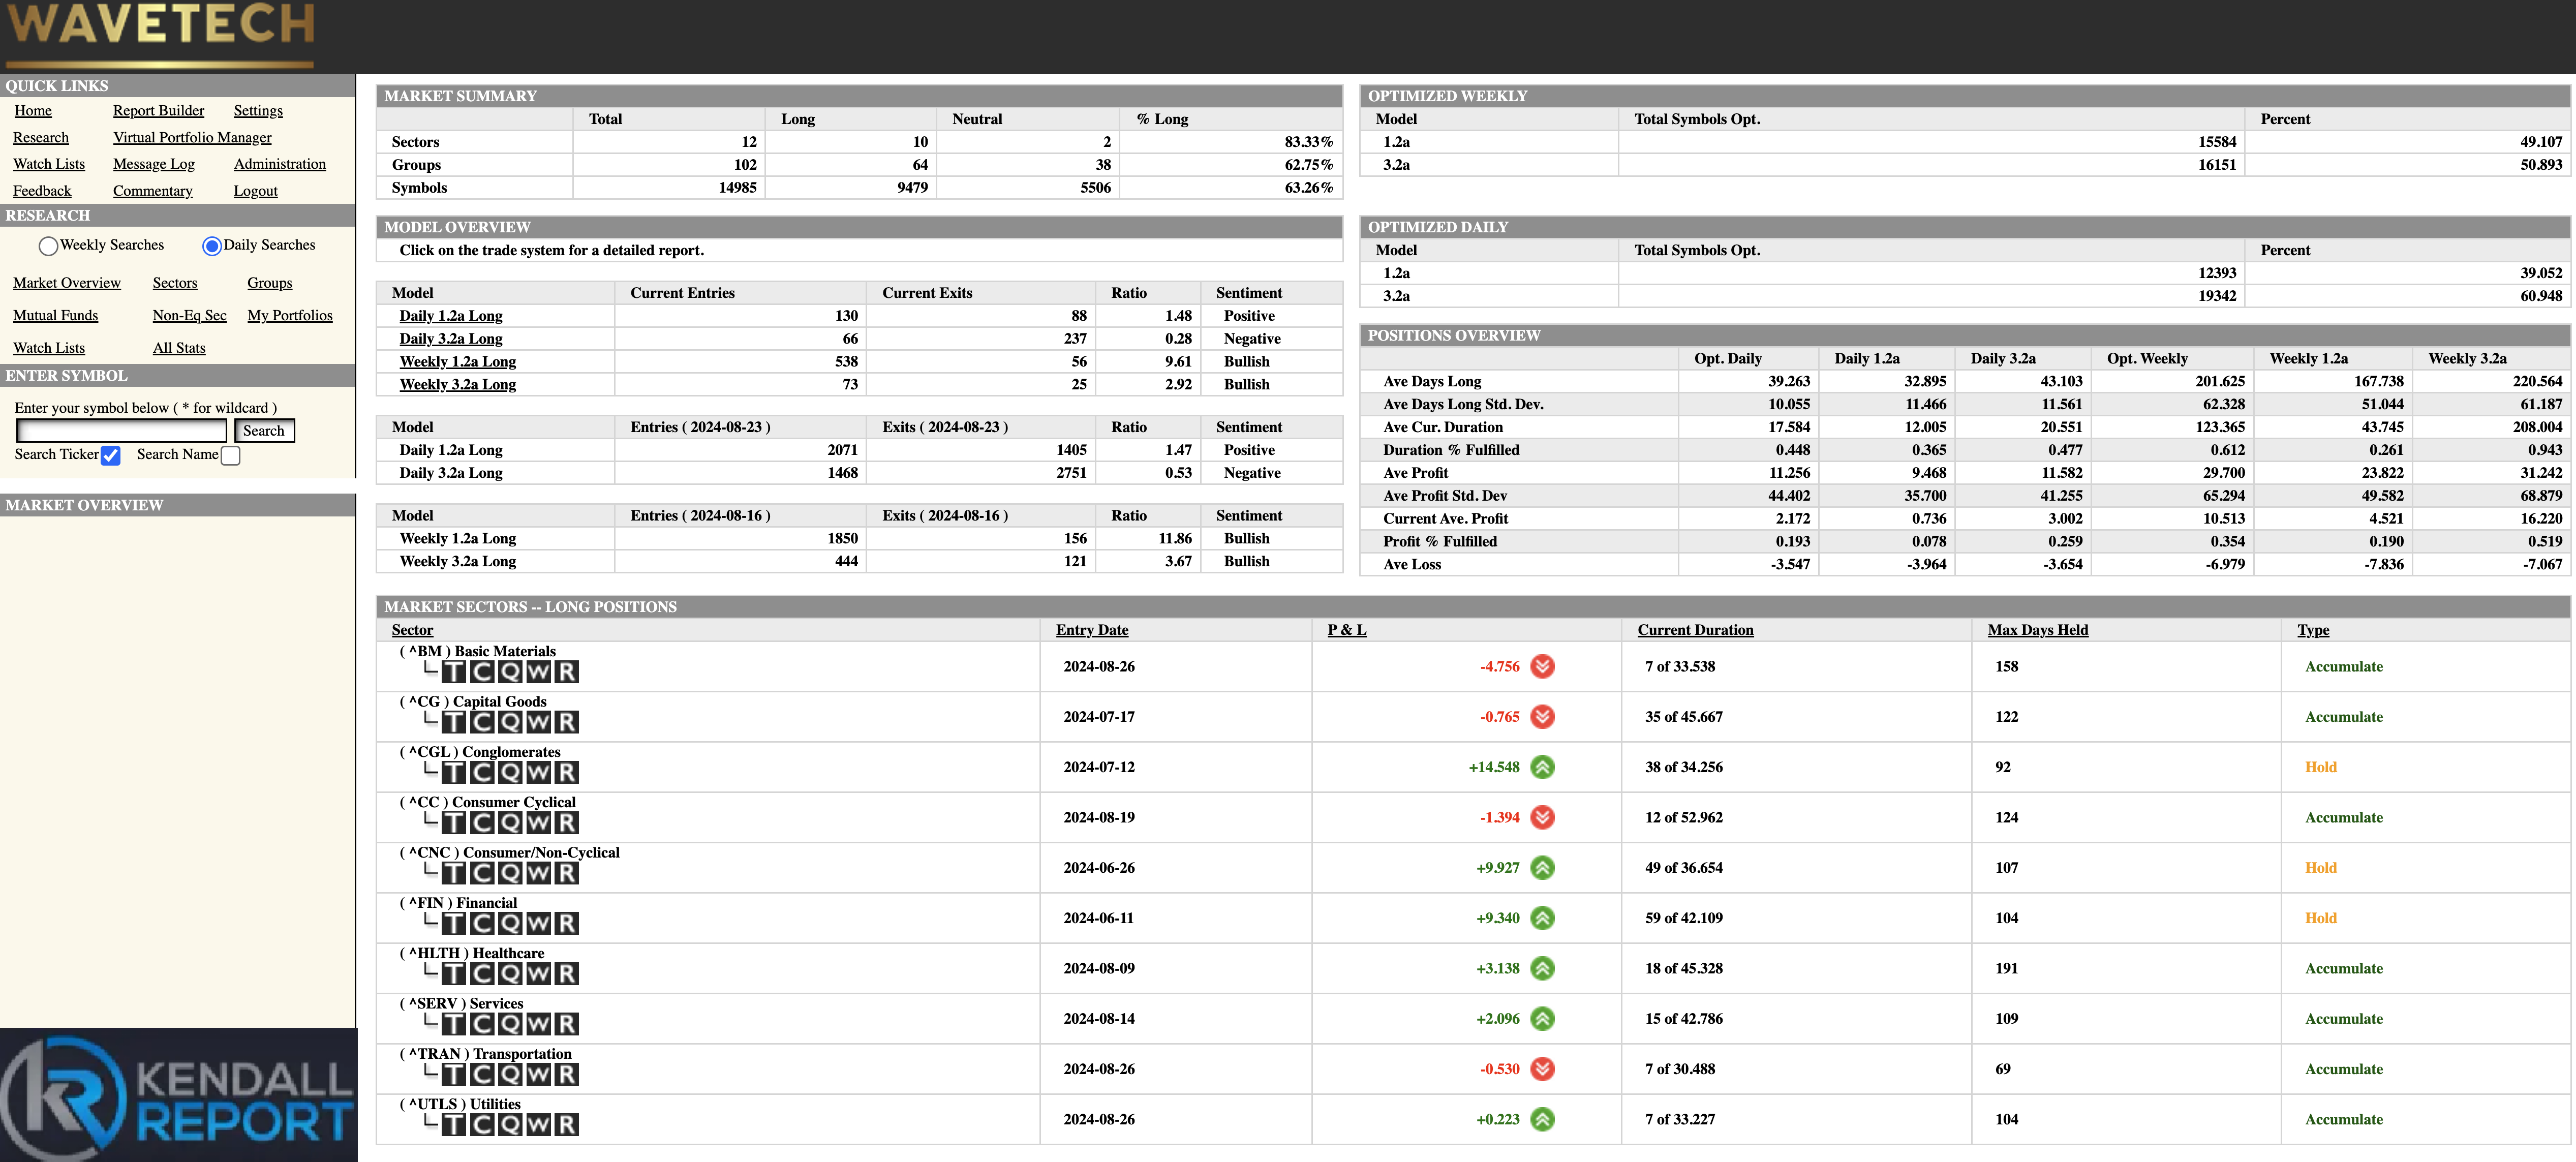
Yesterday's report discussed expectations for the short-term database to experience attrition, likely retreating to a bullish level between 62% and 58%. Last night's data run confirmed this trend, showing a nearly balanced rotation with 196 new entries and 237 exits. This aligns with the quiet market conditions noted in the opening comments, with no significant features emerging.
While four sectors currently in long positions are showing slight negatives at the sector level, it's noteworthy that 10 out of the 12 sectors maintain overall long positions. These sectors continue to exhibit positive trades and are approximately midway through their cycles. This positioning suggests we have at least 15 to 20 days remaining in the current sector cycles.
Given this landscape, we anticipate no major market moves in the immediate future. Instead, we're likely to see further consolidation following Tuesday's decline. This consolidation phase is typical after significant market movements, as investors and traders reassess their positions and await new catalysts or clear directional signals.
The fact that most sectors remain in long positions is a positive sign for overall market health, suggesting that the recent decline hasn't significantly altered the broader bullish trend across most sectors. Being midway through sector cycles often represents a period of stability or gradual movement rather than sharp, directional changes.
The nearly balanced entries and exits indicate a rotation of capital within the market rather than a significant influx or outflow. This dynamic can often lead to range-bound trading as different sectors and stocks lead the market. The expected moderation in the short-term database's bullish sentiment suggests a slight cooling but not a bearish reversal.
Following Tuesday's decline, this consolidation phase is natural and healthy for the market. It allows for the absorption of recent price movements and often sets the stage for the next directional move. While the current outlook favors continued consolidation, it's crucial to remain vigilant for potential catalysts that could disrupt this pattern, such as unexpected economic data, geopolitical events, or significant corporate news.
S&P 500 Futures
Keep reading with a 7-day free trial
Subscribe to The Kendall Report to keep reading this post and get 7 days of free access to the full post archives.