

Markets Looking for Direction..
Markets Looking for Direction..
Bitcoin Breakout Near?

KR Opinion
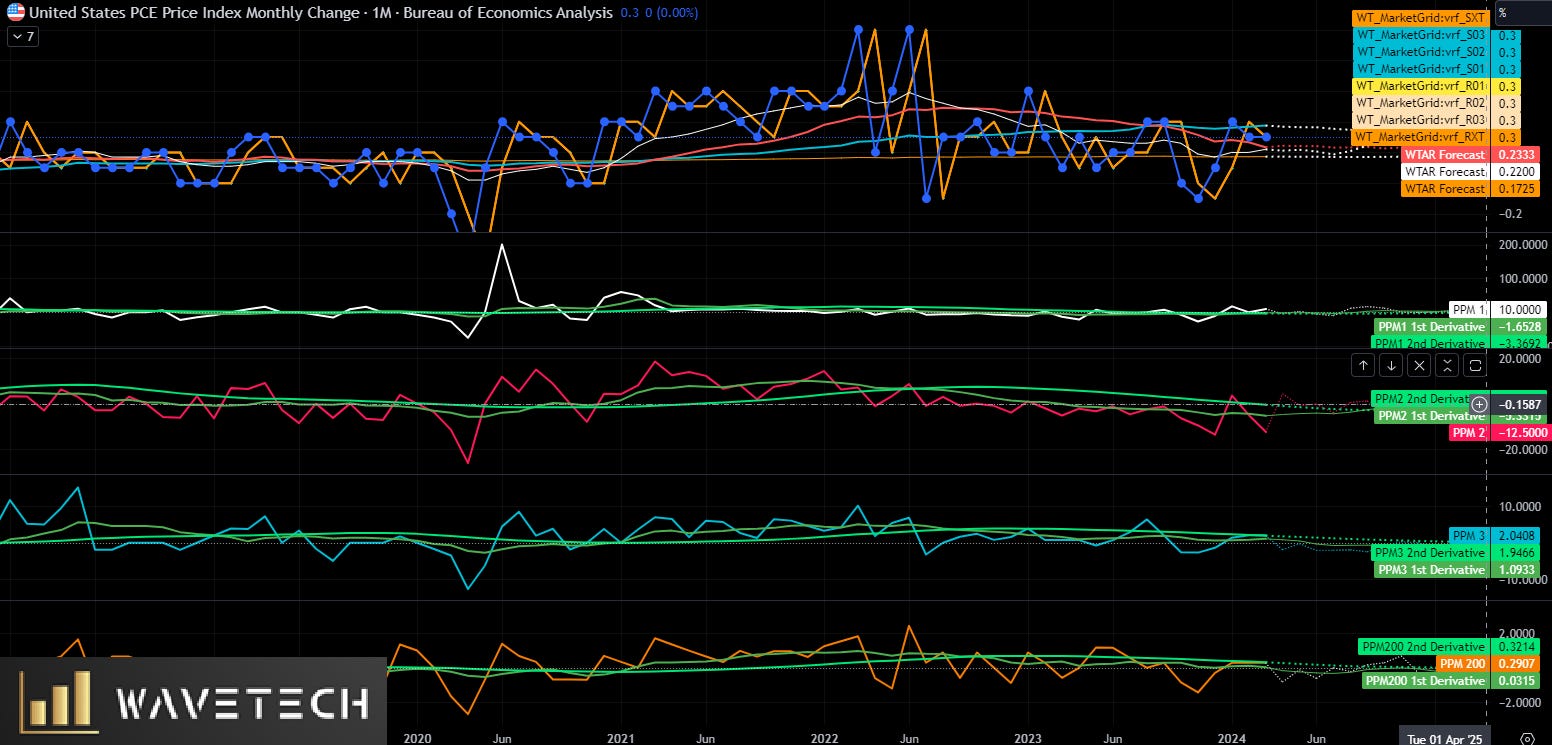
Over the past several weeks, I've been discussing the potential resurgence of inflation over the next six months. As we conclude this week, we'll see the release of the PCE, which is expected to increase by 0.2% and 0.3% compared to last month's report.
Although the current chart appears stable, it's likely to start trending upward in the coming months. The CPI is projected to rise from 2.7% to approximately 3.0%, possibly exceeding this level. For now, only slight increases are anticipated.
Crude oil prices and other goods and services have remained relatively stable, but the services sector might begin showing some price increases. Without delving too deeply into the concept, it’s evident that inflation is rising, which is also reflected in interest rates and other economic indicators.
This trend will likely be mirrored in the consumer confidence numbers and other data this week.
Given that this is a holiday-shortened week, we can expect considerable volatility. There might be some window dressing towards the end of the week, especially after Wednesday or Thursday, leading into Friday’s close.
May has been an intriguing month. While we anticipated follow-through from April’s trends, we saw stability and factors supporting the market instead. Ultimately, the earnings reports shifted the market to a neutral to bullish tone, enabling new all-time highs. Each quarter, earnings effectively reset market psychology and sentiment.
Moreover, the WaveTech database remains solid on an intermediate level, well above the 62% level, indicating stability and strong underlying market trends. While we may see sideways and choppy ranges set up again, the overall trends still point towards higher prices as we move into the final month of Q2.
Looking Back on Last Week
Last week saw a mix of gains and losses across major indices, with the S&P 500 and Nasdaq Composite hitting new all-time highs, while the Russell 2000 and Dow Jones Industrial Average posted solid losses. The week began with a positive start for the Nasdaq and semiconductor stocks, fueled by momentum from the previous week and anticipation of NVIDIA's earnings. Monday and Tuesday saw gains in mega-cap and semiconductor stocks, with notable price action in NVIDIA ahead of its earnings report.
Midweek trading was characterized by mixed action and cautious anticipation of the Federal Reserve's April meeting minutes and NVIDIA's earnings. The minutes' release was unsurprising, but they highlighted concerns over asset valuations, prompting some profit-taking. NVIDIA's impressive earnings lifted semiconductor and AI-related stocks, although broader market support was limited. Earnings reports from major retailers like Target and Lowe's received mixed reactions, impacting market sentiment.
The latter part of the week saw significant economic data releases, including the S&P Global U.S. Manufacturing and Services PMIs, which showed strength in services but weaker new home sales figures. Thursday's session was marked by broad-based selling despite NVIDIA's positive outlook. The week concluded with gains on Friday as the S&P 500 and Nasdaq Composite rallied, buoyed by positive durable orders data and a calming in Treasury markets. Light trading volume ahead of the Memorial Day weekend reflected cautious optimism and consolidation in the market.
Key indices' performance:
- S&P 500: +0.03% for the week / +11.2% YTD
- Nasdaq Composite: +1.4% for the week / +12.7% YTD
- S&P Midcap 400: -1.3% for the week / +7.0% YTD
- Dow Jones Industrial Average: -2.3% for the week / +3.7% YTD
- Russell 2000: -1.2% for the week / +2.1% YTD
Economic releases for the Week of May 27th.
On May 28th, the focus will be on the housing market with the release of the FHFA Housing Price Index for March at 9:00 AM ET. This index tracks changes in residential property prices and provides insight into the housing market's strength.
At the same time, the S&P Case-Shiller Home Price Index closely follows, offering a broader view of housing prices across 20 major cities. The KR Forecast predicts a 5.9% increase, compared to a consensus estimate of 7.0%, down from the prior month’s 7.3%.
Later that day, at 10:00 AM ET, the Consumer Confidence report for May will be released. This highly anticipated report measures households' confidence level in economic activity. The KR Forecast suggests a rise to 99.0, slightly above the consensus estimate of 96.0 and higher than the prior 97.0. Given its high trading impact, any significant deviation from these forecasts could lead to notable market movements.
May 29th starts with the MBA Mortgage Applications Index at 7:00 AM ET, a low-impact report providing weekly data on mortgage applications. At 2:00 PM ET, more attention will be paid to the Fed's Beige Book, a summary of economic conditions across the twelve Federal Reserve Districts that can offer insights into regional economic trends.
The pace quickens on May 30th with a series of early morning reports. At 8:30 AM ET, several releases will hit the market simultaneously, including the Advance International Trade in Goods, Advance Retail Inventories, and Advance Wholesale Inventories for April, which typically
have a low trading impact. The Initial Claims and Continuing Claims reports for May 25th and May 18th will be of greater importance, respectively. Initial Claims are forecasted by KR Forecast to be at 218K, close to the consensus of 219K, indicating stable job market conditions.
The second estimate of the GDP for Q1 is also scheduled for release at 8:30 AM ET. KR Forecast predicts a growth rate of 1.5%, slightly higher than the consensus of 1.3%. The GDP Deflator, which measures the change in prices of all new, domestically produced final goods and services, is expected to remain steady at 3.1%. Another report at 10:00 AM ET, Pending Home Sales for April, is forecasted by KR to rise by 1.0%, contrasting with a consensus expecting a slight decline of 0.5%.
Energy sector reports include the EIA Natural Gas Inventories at 10:30 AM ET and the EIA Crude Oil Inventories at 11:00 AM ET, both of which can influence commodity markets.
The week concludes on May 31st with a slew of high-impact reports at 8:30 AM ET, starting with Personal Income and Personal Spending for April. KR Forecast anticipates a modest increase in personal income by 0.2% and personal spending by 0.4%, aligning closely with the consensus. The PCE Prices and Core PCE Prices, critical inflation indicators, are also set for release. KR forecasts both to rise by 0.2% and 0.3%, respectively.
Lastly, the Chicago PMI for May, coming at 9:45 AM ET, will indicate business conditions in the Chicago area. KR Forecast predicts an improvement to 42.5 from the prior 37.9.
This week’s data releases will provide a comprehensive view of the economy's health, influencing everything from consumer behavior to Federal Reserve policy decisions. As markets navigate this busy week of economic indicators, they will watch closely for any signs of deviation from forecasts.
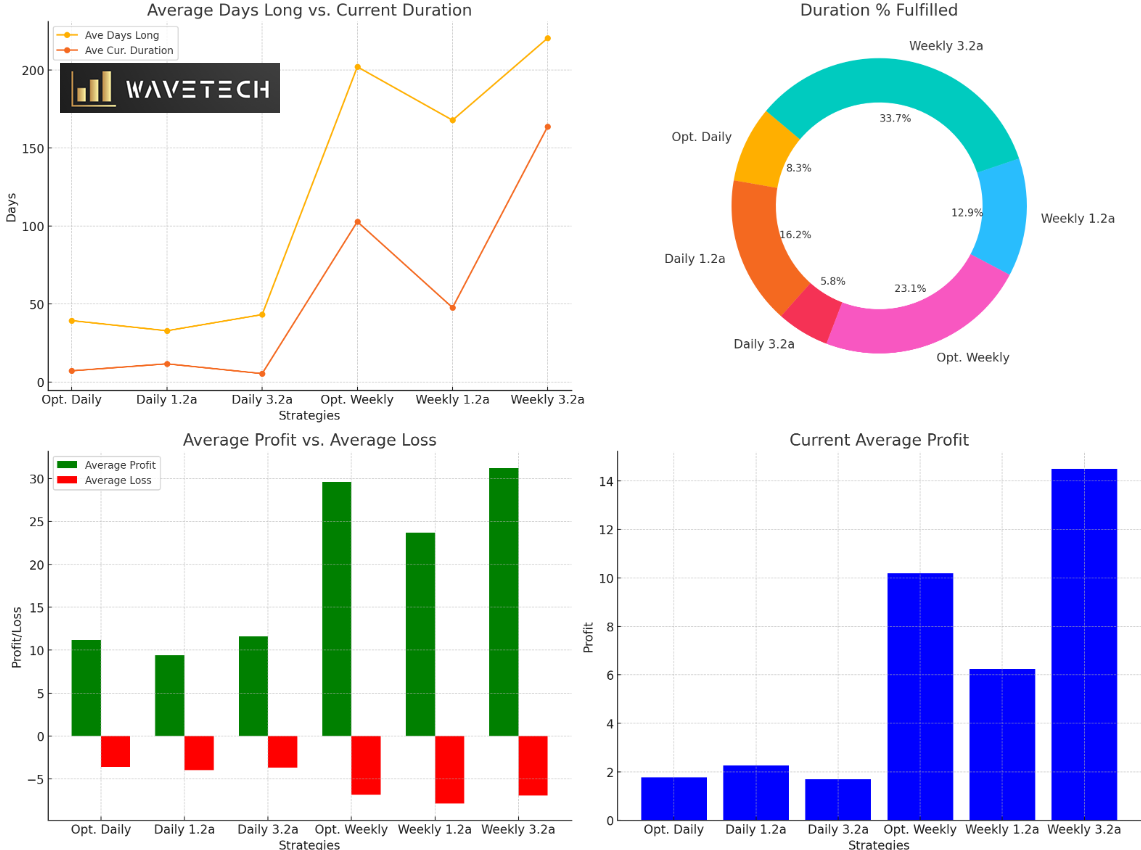
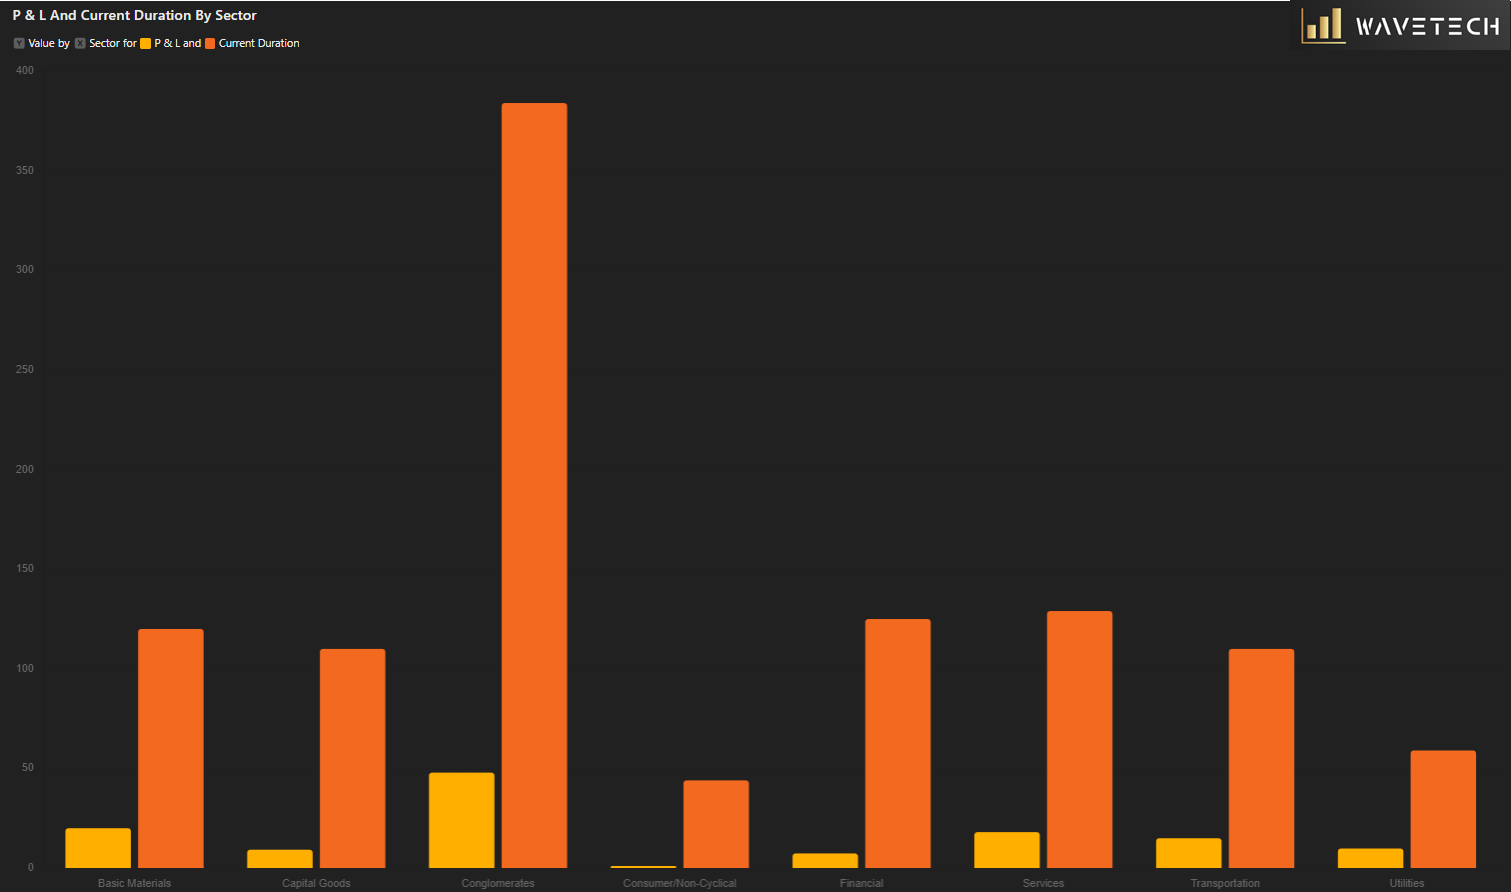
The P&L and current duration by sector illustrate that all sectors are in the early stages of moving toward a maximum duration period. While many sectors may not reach the extreme levels presented, somewhere between 72% and 82% of these durations will likely be achieved. This movement will push durations and expected returns toward their mean objective, suggesting that this trend could continue into the end of the year.
Previously, I mentioned that I thought this trend could extend into July, so we still have at least two months for the primary trend to continue. However, metrics are starting to suggest the potential for an even longer duration as we move forward. As always, I will look for the trend to re-emerge on the daily charts above 42% to see if we can rebuild the index for greater longevity. Meanwhile, the intermediate indicators remain above 66%, which is quite bullish as a forward-looking metric.
WaveTech Database
While the database continues to be quite dynamic as we saw a huge hit last week and the downturn that occurred on Wednesday and backed up the daily database to around 36%, it has now rebounded back to 36%, but more importantly, are some of the stats that are coming out of the intermediate database which has a longer-term connotation on expectations for looking forward.
As we look at the individual sectors and some of the charts below, you'll see that the breakdown shows that many of these sectors are still in the early stages of their trend.
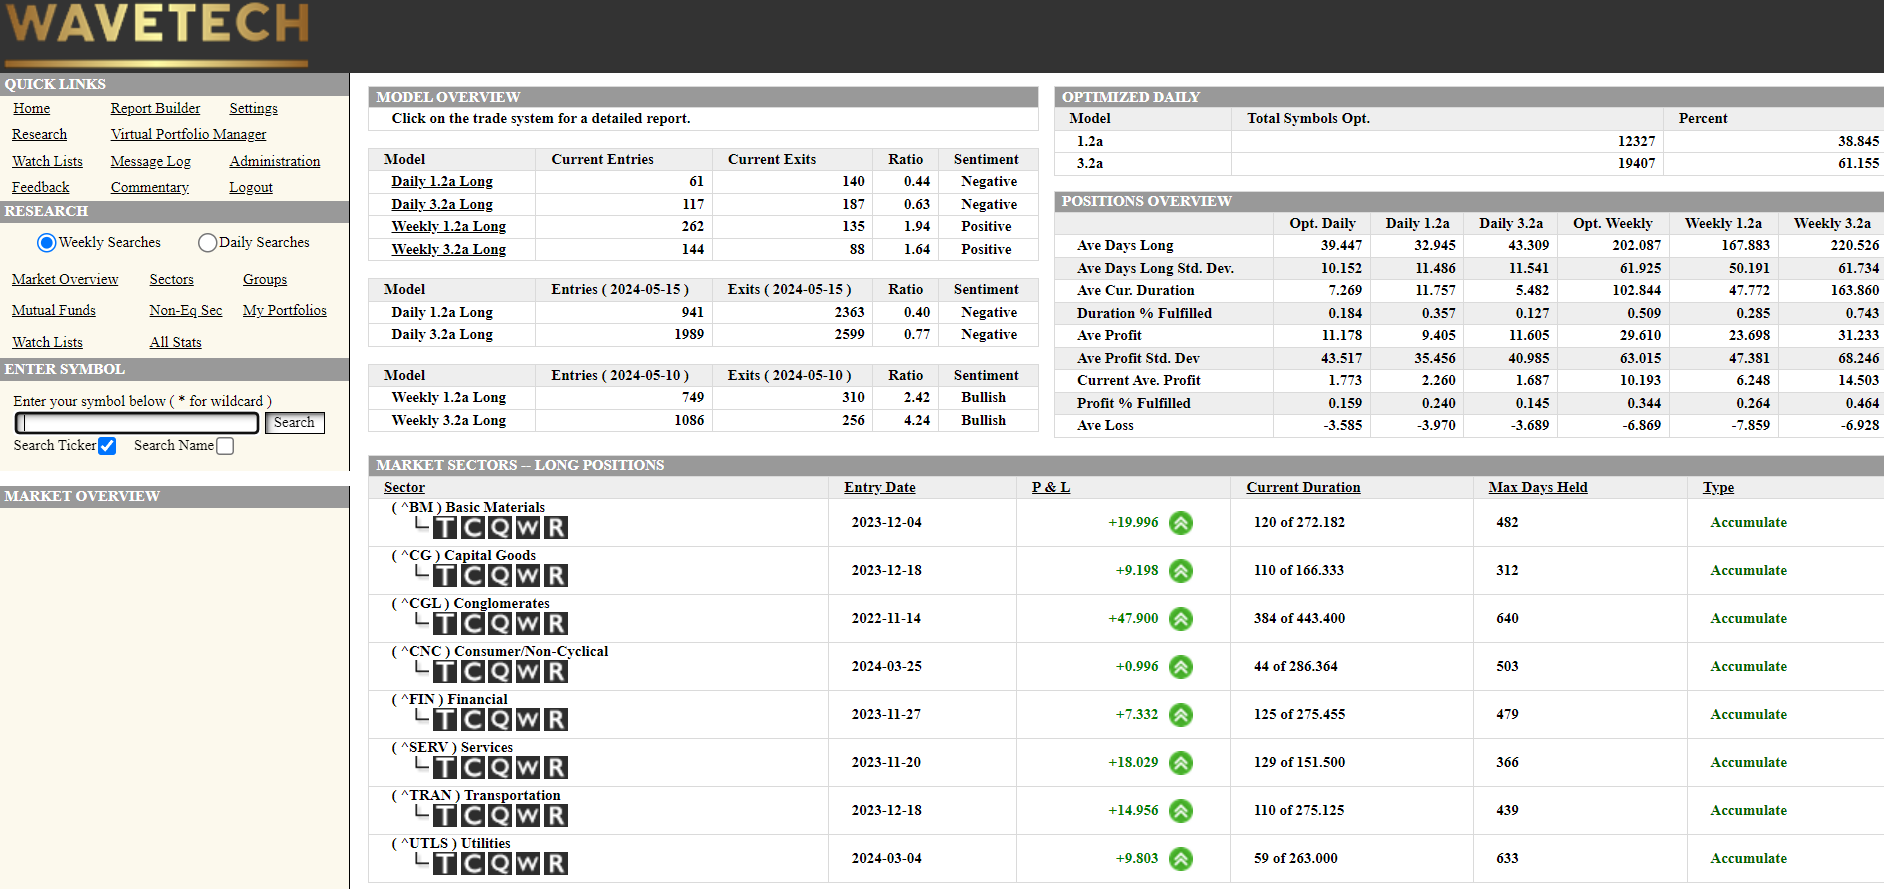
The dashboard below illustrates a reasonable gap between the expected returns and our current position. Some elements suggest that it will still be three to four months before we hit the extreme of this trend.
S&P 500 Futures
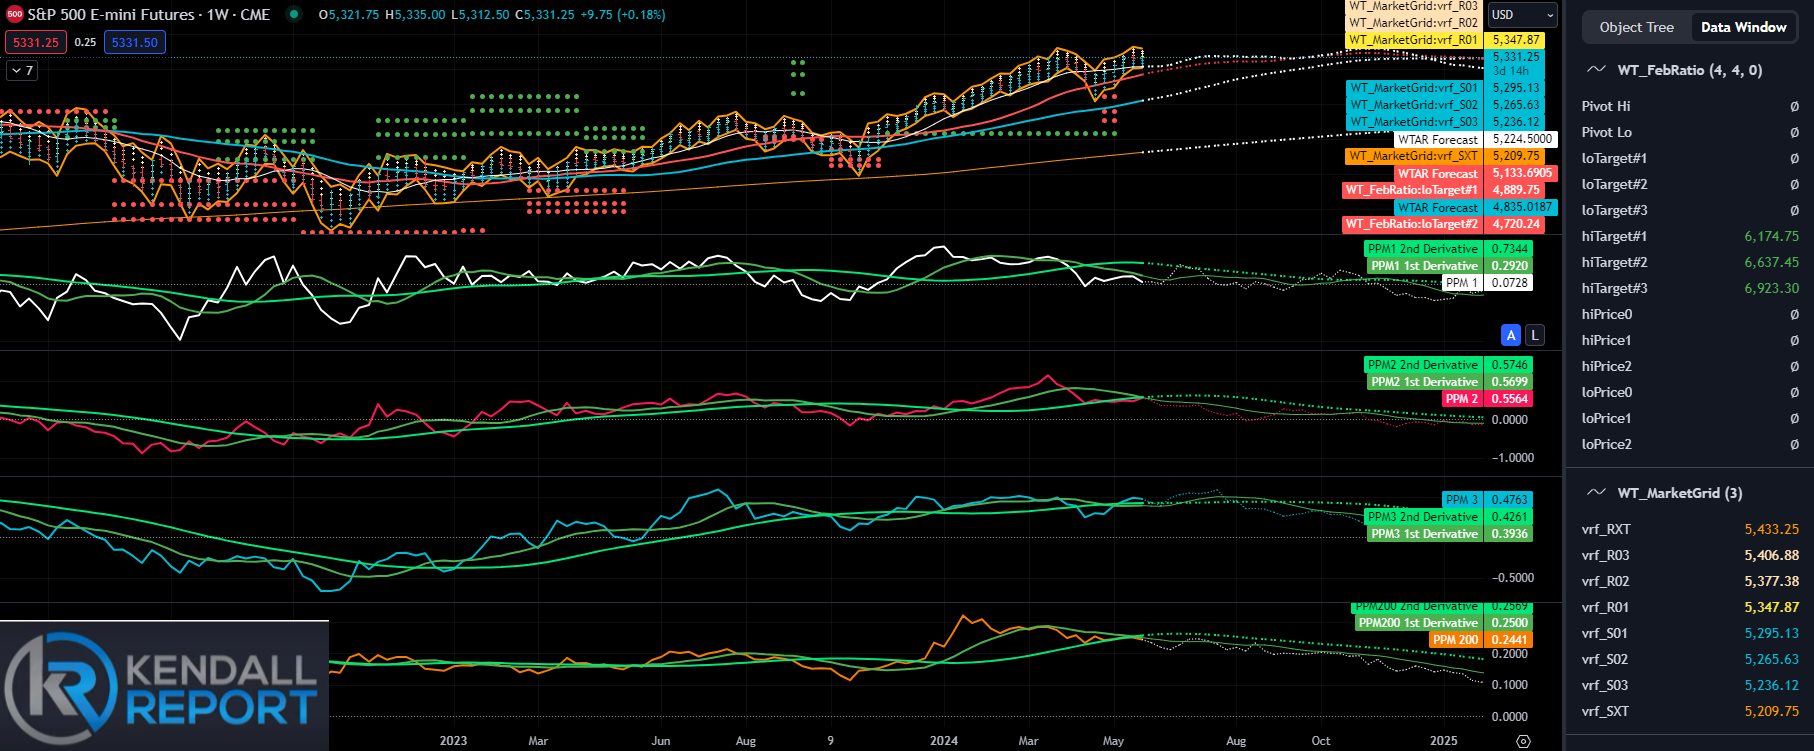
Looking at the weekly trends, we will likely continue a sideways movement. The PPMS remains positive, suggesting an overall positive tone. However, there is still some resistance above the markets. According to the market grid, there is a high probability for the market to reach 5377-5406. On the downside, support is at 5295-5265, with the 10-week moving average providing substantial support at 5224, which would be an extreme level.
If the market reaches this level, it would be a strong "buy the dip" opportunity. The key level for major support is 5133, with less than a 10% probability of falling below this level. Between these levels, we can expect the market to remain sideways on a weekly basis. Be sure to reference the market grid on the right-hand side of the chart below.
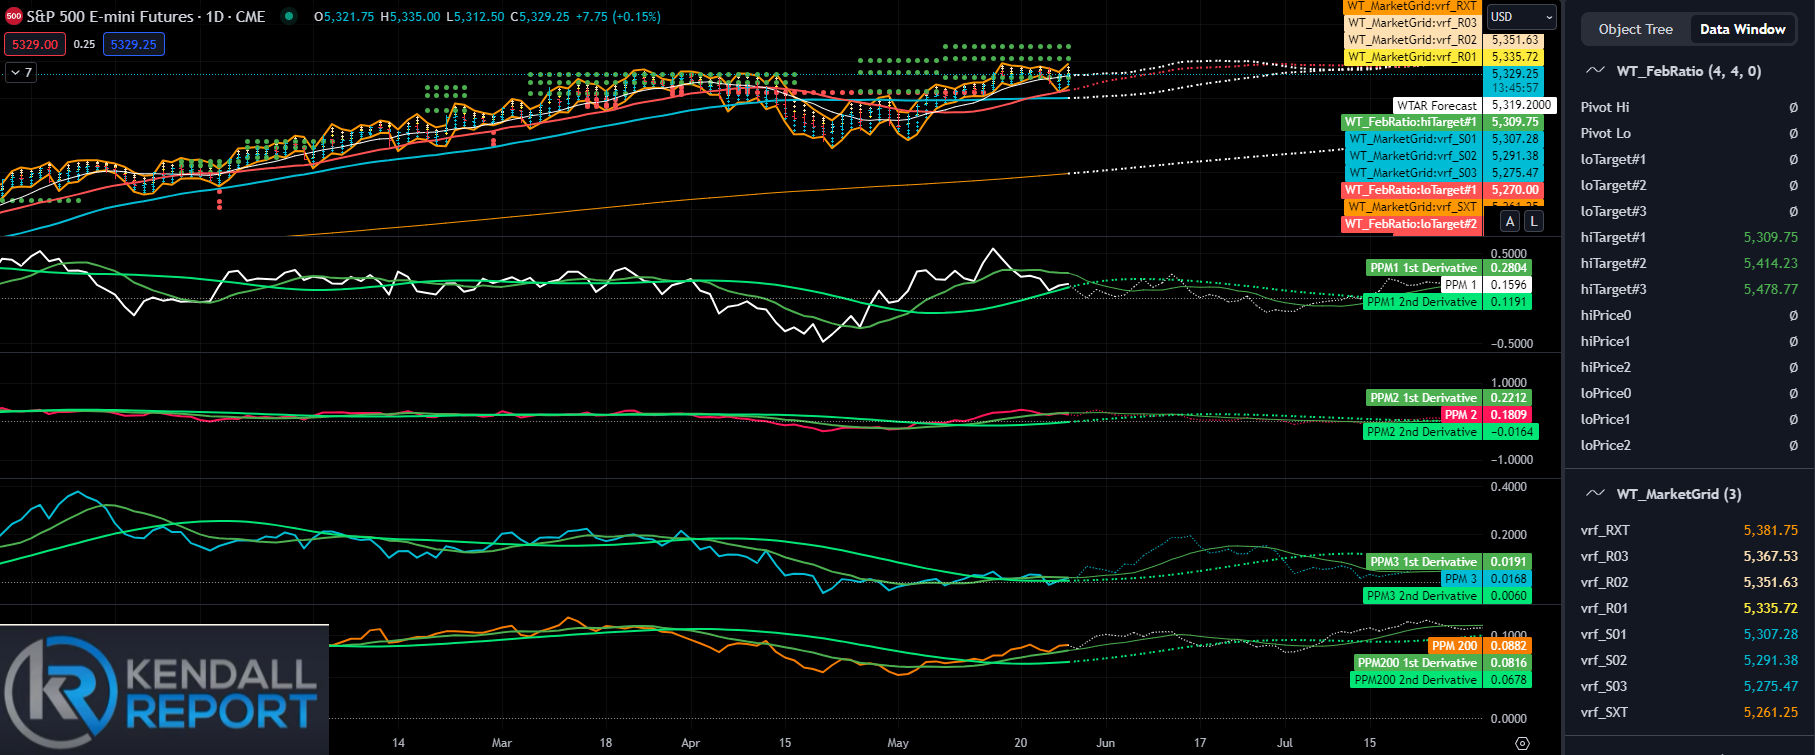
The daily chart below suggests some possible weakness in the next few days, but it should be minimal. We should hold at least the 21-day moving average, currently at the 5241 level. The key support levels are based on the weekly charts, which could expand slightly, but overall, we should see the markets pulled back in despite the rally we saw on Friday.
Most of Friday's rally was due to continued positive sentiment, reflecting the underlying intermediate trend discussed in the database section. However, I don't foresee any significant moves at the moment. Look for the upward slope on the 21-day moving average to continue providing reasonable support. However, momentum may fade over the next few days, potentially reaching extreme levels around the 5200 level.
Upside resistance for the next few days will be at 5377-5406.
NASDAQ Futures
The daily chart below suggests a slight bias to the upside, with PPM1 in trend mode at 0.33. This indicates a 60% probability of holding the 10-day moving average at the 18,723 level.
The market should remain well within the market grid, with the upside around 19,018 and the downside around 18,808, with an extreme of 18,733 for today. However, the Argos suggests we are close to a momentum switch, which could indicate a move down toward the 21-day moving average at 18,340. We should remain in this uptrend, at least through Thursday.
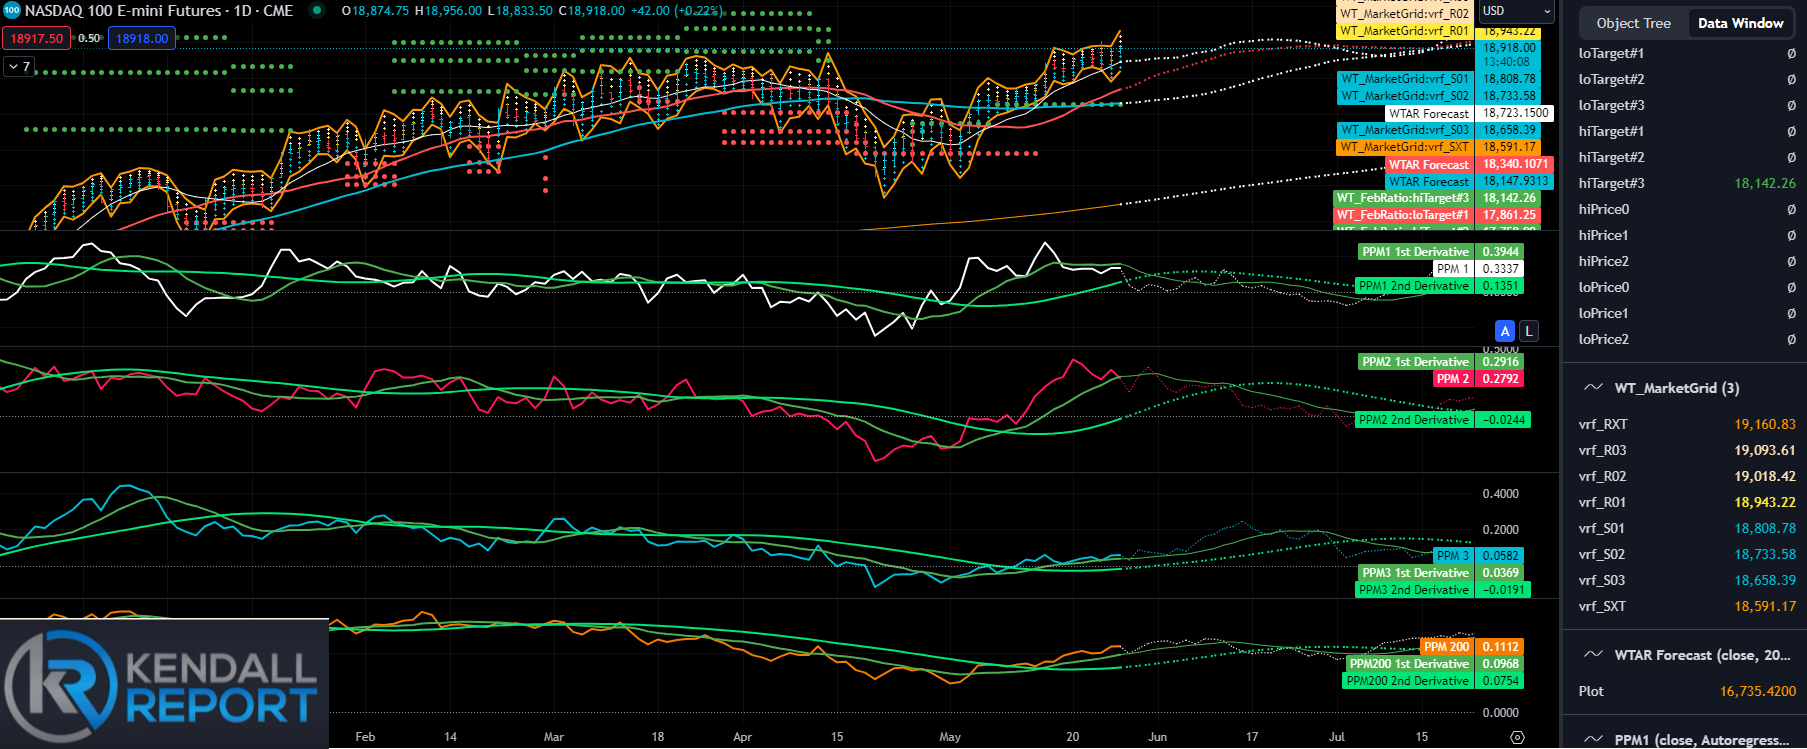
From a fundamental standpoint, most of the focus will be on the GDP release, which isn't likely to have a material effect but will be closely watched, along with the PCE numbers on Friday.
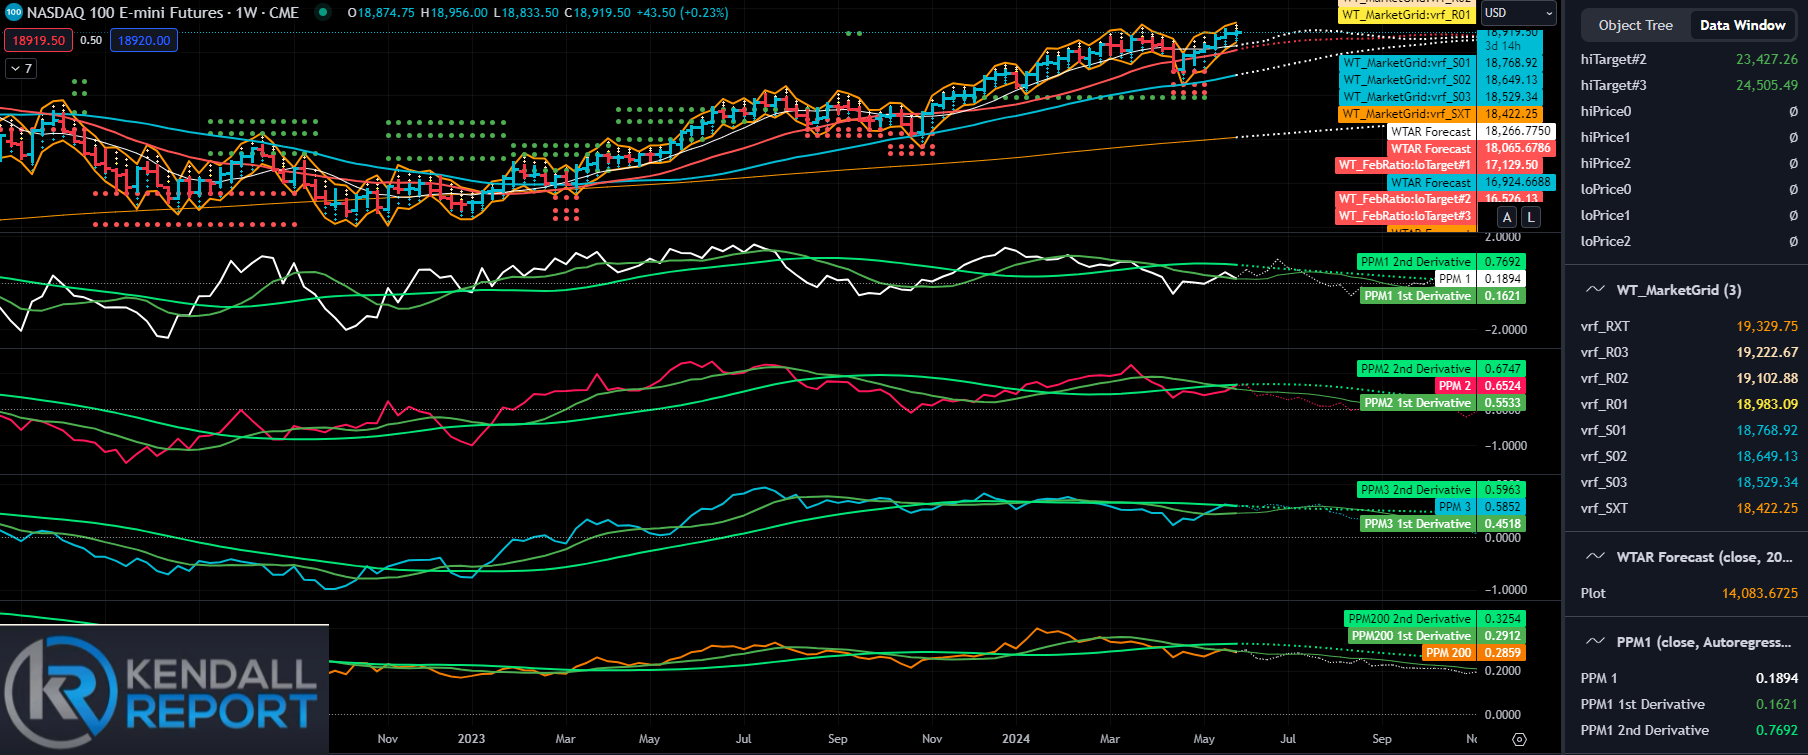
The weekly chart shows an upward bias, although a minor pullback is possible. The key level to watch is last week's low of 18,621. If this level is penetrated, refer to the market grid for a potential move down to 18,529-18,422. On the upside, we are looking at a range of 19,102-19,222.
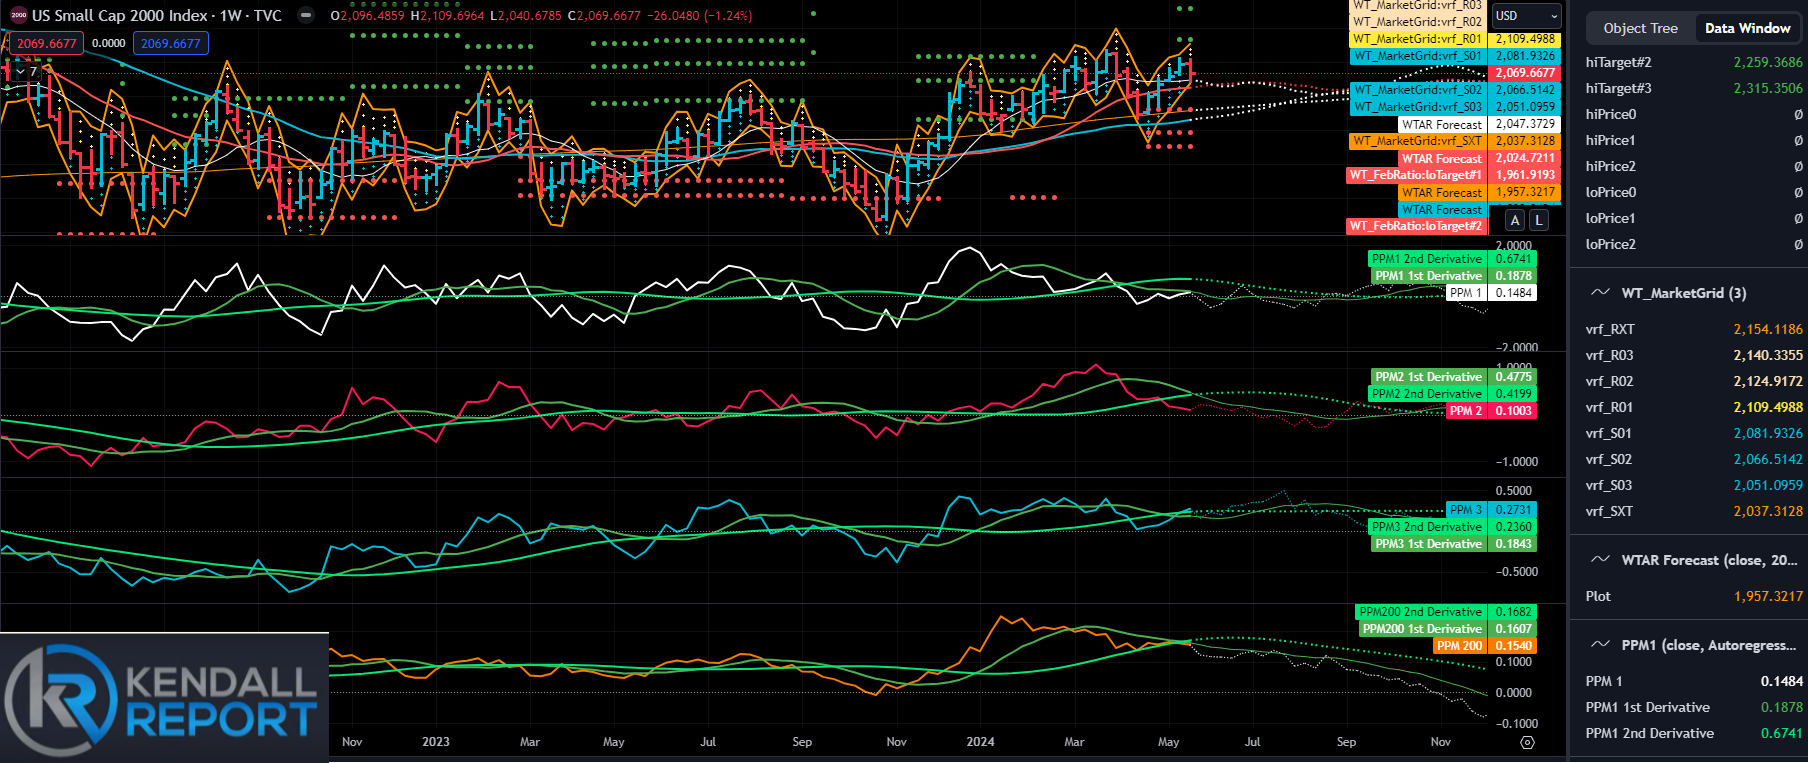
Russel 2000 cash
While the Russell showed some relative weakness last week, the patterns suggest we might see some downside. A slight negative trend is trying to unfold every week. It's not drastic, but it indicates a possible move toward the weekly 21-day moving average, currently at the 2024 level. If this level is breached, we may fall back into the consolidation pattern.
There are no signs of moving out of this range, even though Fibonacci targets above the markets suggest a potential move toward a minimum level of 2168. It doesn't seem likely we'll reach this level this week unless there are surprises in the released economic data. However, everything is expected to fall within a reasonable range of expectations.
Treasuries
The Treasury market remains stable within the ranges discussed over several weeks. The lower end is at the 4.33 level, and the upside is restrained around 4.50. Yields are expected to slightly upward slope over the next couple of weeks, followed by a potential fallback toward the 4.33 level. However, the market is expected to be very choppy and remain below the 4.50 level for the next week.
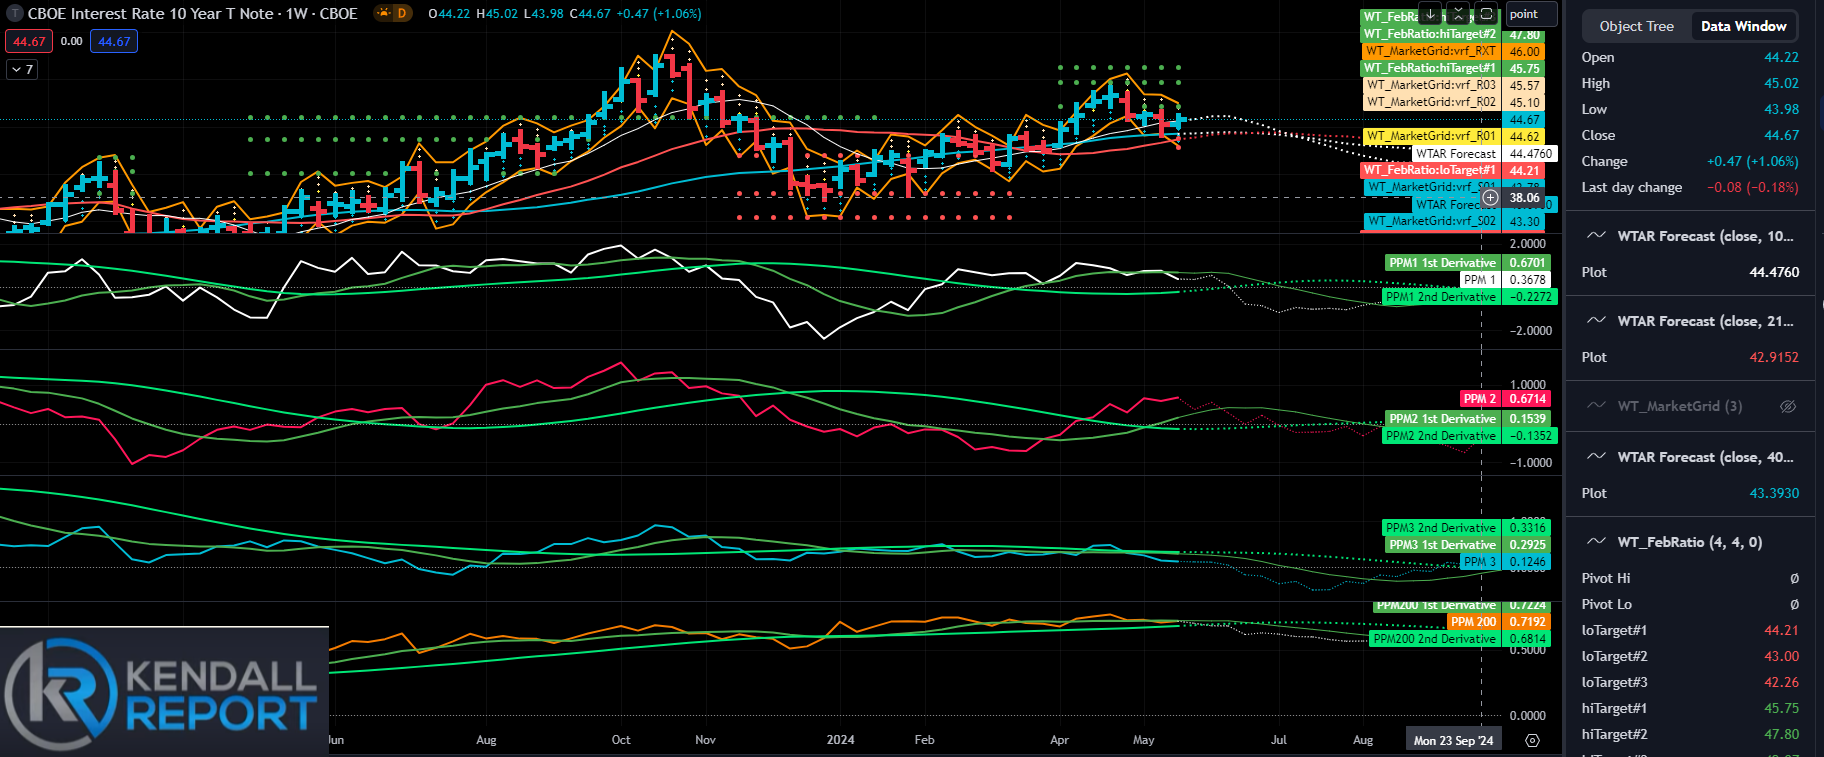
The yield curve remains quite stable, similar to the last update. Despite some news that would normally impact the market, the treasury market has remained incredibly stable. The upcoming PCI report might have the most significant effect, but the current algorithmic configuration suggests that not much change is likely this week. Most reports are expected to come within a somewhat predictable range.
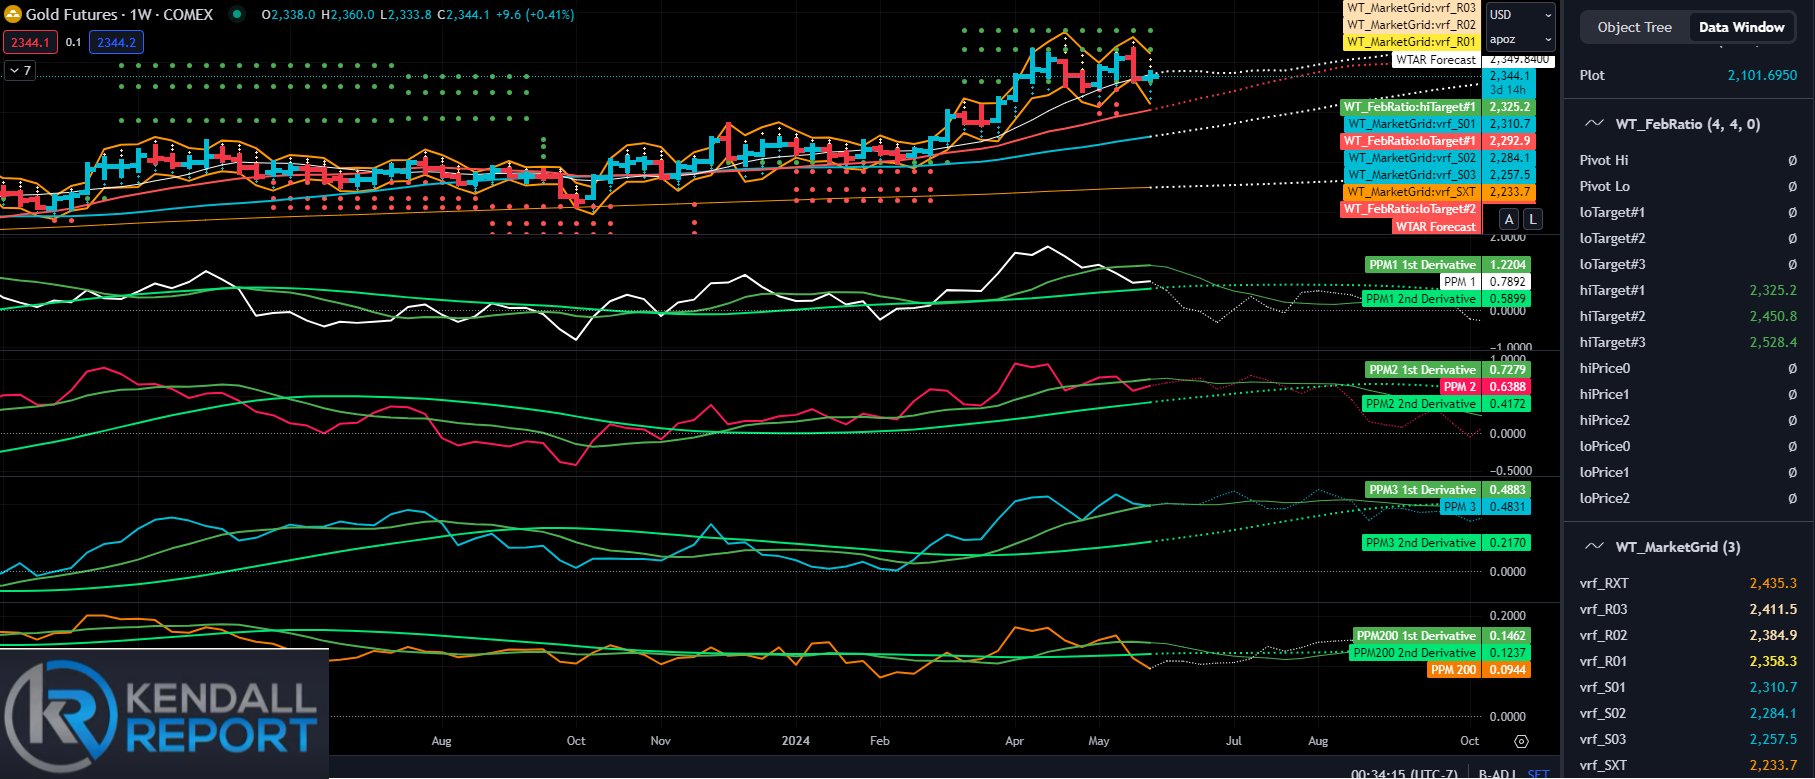
Gold
The gold market remains in a consolidation phase and appears vulnerable to downside. Algorithms suggest that the next few weeks could be very negative, potentially pushing prices down toward the 21-period moving average at the 2207 level. Although we recently reached an all-time high, there was a significant reversal. Interestingly, instead of inflation driving the market higher, the reversal in interest rates has caused a softening in gold prices.
Gold often operates in a unique space, and its correlation has primarily been with interest rates over the past year and a half. According to the algorithms, gold prices are likely to weaken. There is strong support at the 21-period moving average at 2207, but a move down towards the 2310-2284 range is possible. A break below 2284 could trigger a steep decline towards the 2233 level.
On the upside, resistance around the 2358-2384 level can be expected. The overall configuration suggests a large distribution pattern is forming. Over the next two to three weeks, we might gain more insight into a sustainable directional move, but it looks like the market will be locked in a broad, trendless range of activity for now.
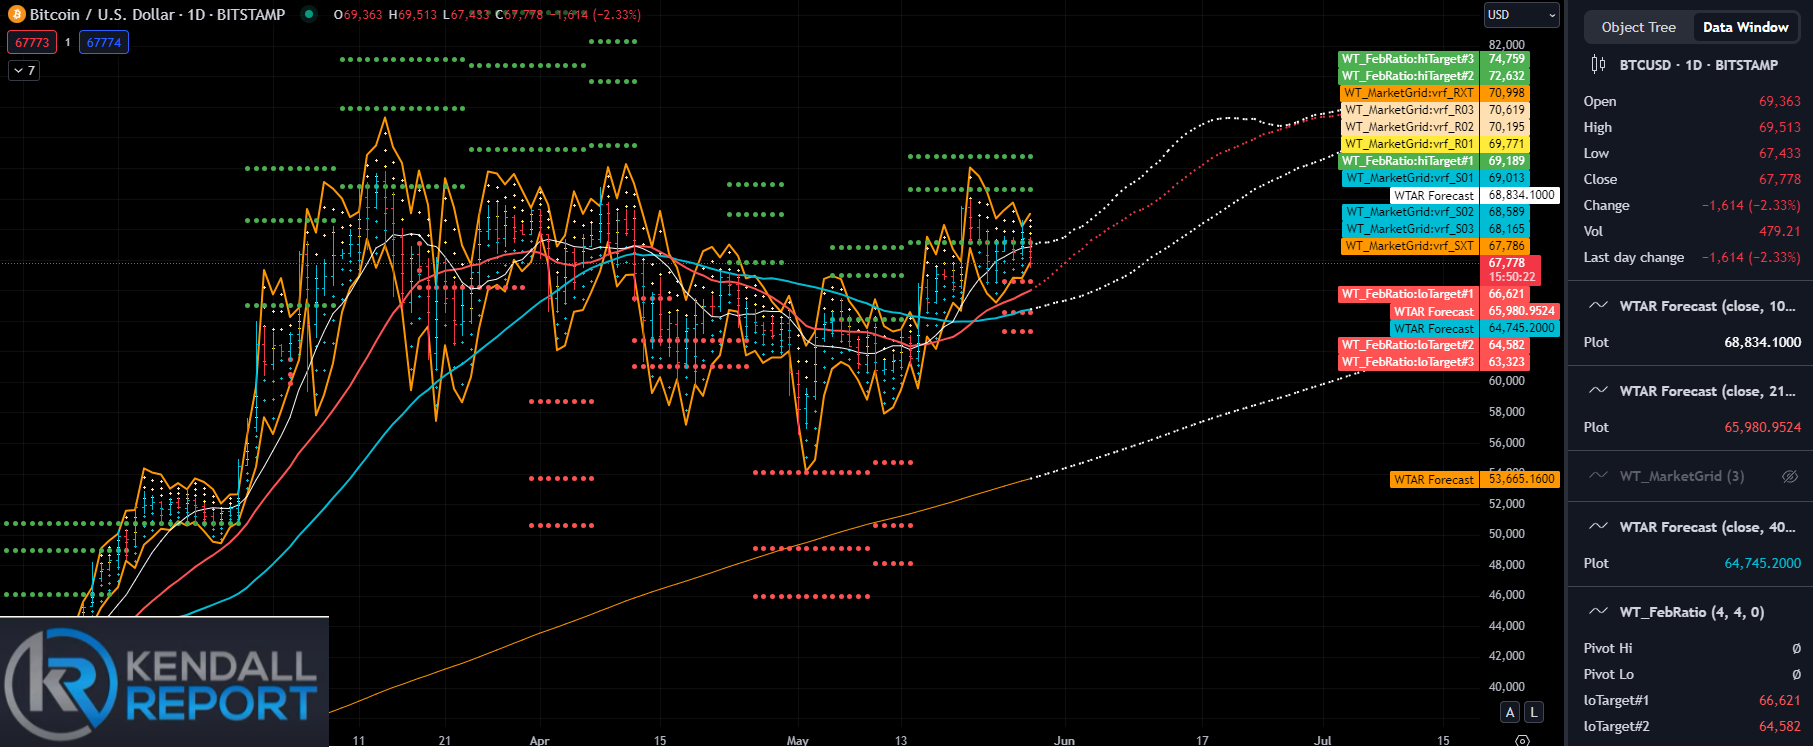
Bitcoin
I will start by addressing a significant development: the WaveTech Fibonacci projection tool has issued three new upside targets at 91,789, 105,269, and 113,598. Despite these projections, the algorithms suggest continued consolidation.
This week's market grid numbers will be crucial. Heavy resistance remains at 71,509, and support is at 65,470, likely defining the range for the week. Although there's a new Fibonacci target, the algorithms indicate possible downside action.
The consolidation phase, which began on March 11th before the "halving" event, seems incomplete. Many expected a new high, but the current Fibonacci targets may be premature.
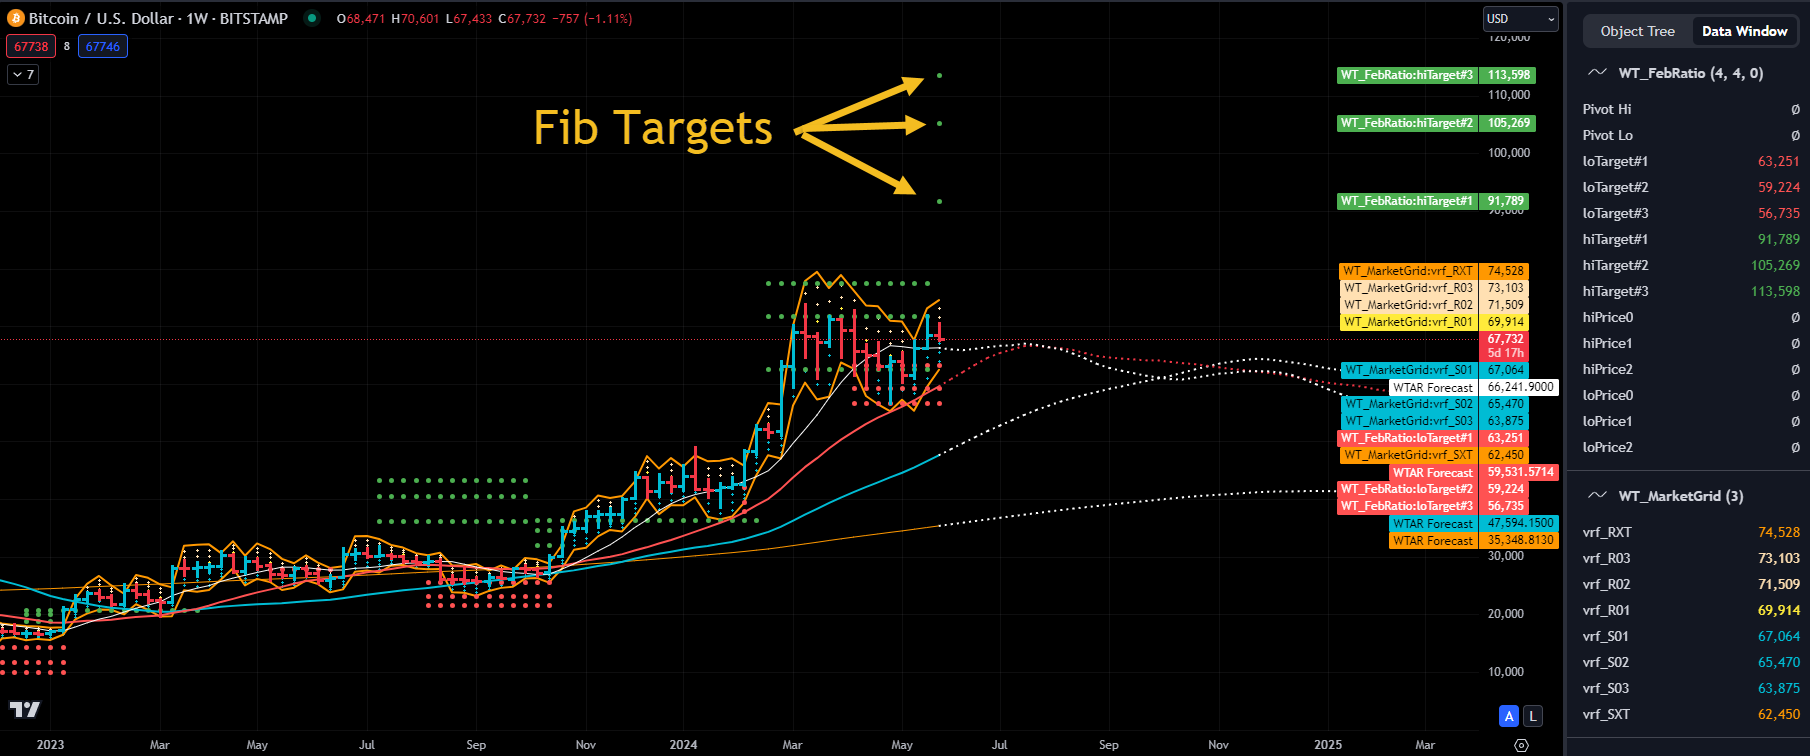
If the projection remains valid for more than three weeks, I anticipate hitting the upper levels mentioned. The market grid suggests a range between 65,470 and 71,509, which should be used as breakout points for directional movement. However, we will likely stay within a tight range.
The daily chart indicates that the algorithms are more positive than the weekly chart suggests. A new trend may emerge in about two days. The key level to watch is 65,900 to 65,500. We should see a bounce from this area, potentially leading to an upward movement toward the end of the week, around Thursday or Friday.
This could align with the projected dotted line, suggesting a rally into June. If this materializes, the upward targets mentioned on the weekly chart will be confirmed, indicating a potentially stable to positive trend for this week.
Robert Kendall
Chief Analyst
."Disclaimer for “The Kendall Report
The information provided in "The Kendall Report" is for general informational and educational purposes only. The opinions, analyses, and forecasts included in this newsletter are based on the author's personal views and experiences and are provided as is without warranty of any kind.
While we strive to provide accurate and up-to-date information, we do not guarantee the accuracy, completeness, reliability, or timeliness of any information contained in this newsletter. The information presented should not be construed as financial, investment, legal, or other professional advice. It does not constitute a recommendation or endorsement of any particular investment strategy, financial instrument, product, or service.
Investors should consider their financial situation, objectives, and risk tolerance before making investment decisions based on the information provided. The financial market is subject to high risk and volatility. Past performance is not indicative of future results. Investing in the financial market involves the risk of loss, including the loss of principal.
"The Kendall Report" and its contributors will not be liable for any direct, indirect, incidental, consequential, or exemplary damages arising from the use or inability to use the information provided in this newsletter, including but not limited to losses or missed gains.
By accessing and using "The Kendall Report," you acknowledge and agree to this disclaimer and assume full responsibility for the use of the information provided. We reserve the right to make changes to the content of this newsletter at any time without notice.
This disclaimer is subject to change at our discretion, and it is the reader's responsibility to review it regularly for any updates.
Been out sick a few weeks. Doesn't look like I missed much. Holding positios for now.