Markets Reach Key Resistance!
WaveTech Database continues to get Traction...

KR Opinion
Yesterday, the market maintained a strong bid throughout the session, culminating in a surge during the final hour that pushed indices to their highest levels. This rise wasn’t triggered by any new developments but rather by the ongoing positive market sentiment.
I've discussed before that it seems the Federal Reserve is easing its approach, particularly with its recent scaling back on quantitative tightening (QT). Although this hasn't been formally announced, the Fed has subtly reduced QT for the past couple of months to test market reactions.
This technique, known as "jawboning," involves the Fed signaling potential actions to see if the market will react as desired without any formal moves. This appears effective, suggesting that the market adapts to a new operational paradigm.
Looking ahead, I expect less focus on short-term yield fluctuations. While some speculate that the resolution of yield curve inversion will signal an impending recession, it's more likely that we'll see a normalization of yields across the curve, indicating a gradual adjustment rather than a dramatic shift.
From a broader perspective, this transition in yields and equity markets will take time to unfold fully, possibly extending well into 2025. Regarding corporate earnings, they continue to be a major driver.
We have a busy schedule ahead. 364 earnings releases are due Tuesday, including Disney after the market closes and significant reports from big oil and various small—to mid-cap companies. Wednesday and Thursday will see more activity, with 560 and 628 releases, respectively.
The ongoing release of earnings generally surpassing expectations should sustain buoyant market conditions. Although the markets are approaching key resistance levels, suggesting we might enter a frothy phase, I don't anticipate a significant pullback.
Looking Back on Monday’s Action
Today, the stock market continued its upward momentum, building on last Friday's gains. The S&P 500 notably traded above its 40-day moving average of 5,130 after closing slightly below it on Friday and ended the day with a 1.0% increase—its highest close since April 11. The Nasdaq Composite finished 1.2% higher, alongside the Russell 2000, while the Dow Jones Industrial Average saw a more modest rise of 0.5%.
Throughout most of the day, the major indices experienced narrow trading ranges until a surge in buying activity occurred in the last 30 minutes, pushing the S&P 500 and Nasdaq Composite to new intraday highs. The gains were widespread, resulting in the equal-weighted S&P 500 closing up by 0.8%.
The market was buoyed by significant gains in mega caps and the semiconductor sector, which led to a 1.4% increase in the Vanguard Mega Cap Growth ETF (MGK) and a 2.2% rise in the PHLX Semiconductor Index (SOX).
Meta Platforms, NVIDIA, Microsoft, Amazon.com, and Eli Lilly led the charge among influential stocks comprising nearly 20% of the S&P 500. These companies helped propel their respective sectors, with information technology and communication services sectors achieving gains of 1.5% and 1.4%, respectively. Five sectors recorded at least a 1.0% increase, while only the real estate sector marginally declined by 0.02%.
The movement in the bond market was minimal, contributing to the positive sentiment in stocks. The 10-year Treasury note yield dropped by one basis point to 4.49%, and the 2-year note yield increased by the same margin to 4.82%.
No significant U.S. economic data was released today. However, the March Consumer Credit report is scheduled for release tomorrow at 3:00 p.m. ET.
·Nasdaq Composite: +8.9% YTD
·S&P 500:+8.6% YTD
·S&P Midcap 400: +6.8% YTD
·Dow Jones Industrial Average: +3.1% YTD
·Russell 2000: +1.7% YTD
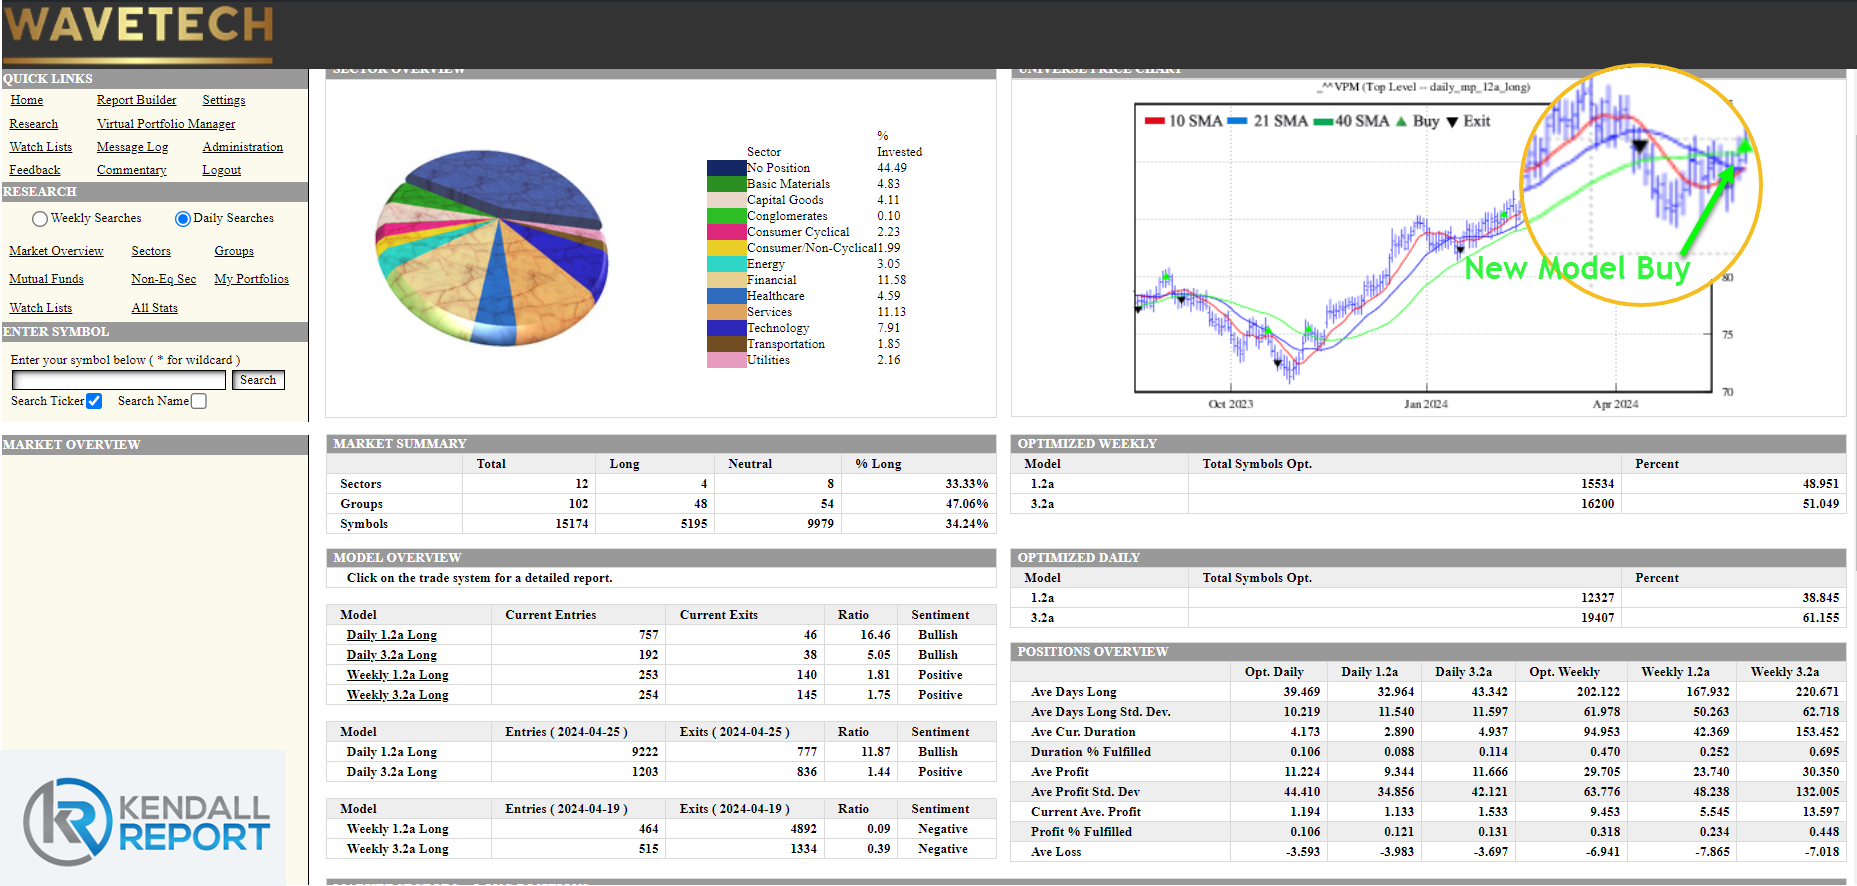
WaveTech Database
The Wave Tech database recently experienced an uptick in activity, with 949 new entries and only 91 exits, pushing the percentage of bullish signals from 31% to 34.24%. Over the past week, several sectors, including consumer non-cyclical, financials, transportation, and utilities, have received short-term buy signals, while other sectors remain neutral. This indicates a gradual rebuilding of the foundation within the database.
From a technical perspective, the short-term VPM index, shown in the chart below, issued a buy signal yesterday. Typically, the holding period for such signals is around 31 days, though they have tended to last longer over the past six months. This suggests a possible setup for reaching new all-time highs and continuing the upward trend.
However, as noted in the S&P section, we are approaching a strong resistance level that may lead to further consolidation and individual stock building before the market ascends. It's important to note that a 42% bullish level is considered crucial for establishing a more sustainable upward trend. Currently, we are still below this threshold. Although I anticipated a larger influx of new entries, the additions were more moderate than expected and were still respectable.