
Markets Signals Rally!
Fed Pivot?

KR Opinion
This Post is Too Long for email. Go to KendallReport.substack.com for the full report.
As we gear up for the coming week, all eyes are on the FOMC meeting scheduled for Wednesday. There's a palpable sense of anticipation, with markets increasingly leaning towards a Fed pivot. The prevailing expectation is for a 25 basis point rate cut, but the broader implications of this move are genuinely capturing the market's imagination.
In my recent YouTube videos and reports, I've emphasized that this potential rate cut is more about optics than a fundamental policy shift. The back end of the yield curve has already dropped by 30 to 40 basis points, forcing the Fed's hand to adjust rates on the front end. This move is more about maintaining the curve's shape than responding to specific economic conditions.
Looking ahead, I'm still confident in my projection that the federal funds rate will settle between 2.75% and 3.5% by the end of Q2 or into Q3 of 2025. This gradual descent will likely unfold over the coming year and a half, with the Fed carefully managing each step.
What's particularly exciting is the shift in market sentiment we're witnessing. I now believe there's a strong probability – over 60% – that we'll reach new all-time highs, possibly as soon as this week. We'll likely see the markets push towards those Fibonacci targets I outlined in last week's report, which we'll revisit in more detail later.
It's worth noting that from a purely metric-based standpoint, there's no glaring economic reason for the Fed to cut rates. The decision is primarily driven by the need to adjust to the shifting yield curve. They'll avoid a 0.50-point drop, which might signal weakness or panic. Instead, we're likely looking at a series of quarter-point drops, possibly skipping November but resuming in December and then continuing steadily through 2025
Currently, our effective federal funds rate is about 5.33%. In the dedicated section of this report, I'll delve deeper into the treasury dynamics, providing more context for these movements.
What's particularly striking is the uniformity of bullish signals across various metrics. All indicators point towards potentially much higher equity index prices, from my proprietary database to various algorithms. This confluence of positive signals is something to be noticed.
As we enter this week, I expect enthusiastic market participants. While it might seem that much of this rate drop has been priced in, my analysis suggests that the market reaction could be even more bullish than anticipated. We're likely to see some solid follow-through in price action.
In the latter part of this report, I'll explore detailed technical and quantitative projections. These insights will provide a more comprehensive picture of where we stand and where we might be headed. It's shaping up to be an exciting week in the markets, with potential for significant moves and shifts in sentiment. Stay tuned as we navigate these dynamic market conditions together.
Looking back on last week
The stock market rebounded strongly this week, reversing last week's substantial declines. Investors displayed renewed interest in buying the dip, and as the week progressed, upward momentum became a driving force. While gains were widespread, mega-cap stocks and semiconductor shares significantly increased index values.
The Vanguard Mega Cap Growth ETF surged by 5.5%, while the PHLX Semiconductor Index saw an impressive 10% increase. NVIDIA stood out as a top performer, bouncing back 15.8% after last week's slide.
Midweek, the release of the August Consumer Price Index caused some jitters. The data showed that core inflation, excluding food and energy prices, remained above the Federal Reserve's 2.0% target at 3.2% year-over-year. This initially sparked some selling, but the market quickly recovered when the S&P 500 held above last Friday's low of 5,402. NVIDIA's strength also helped propel stocks back onto an upbeat track.
Other economic indicators released this week had minimal impact on stocks and bonds. Initial jobless claims stayed relatively stable at 230,000, remaining below levels typically associated with recession. The August Producer Price Index indicated moderating inflation at the wholesale level.
Recent concerns about economic growth gave way to a more optimistic outlook. By week's end, small and mid-cap stocks outperformed their larger counterparts, reflecting growing confidence in a "soft landing" for the U.S. economy and expectations that the Federal Reserve will cut interest rates to ensure this outcome.
In the bond market, yields declined across the board. The 2-year Treasury yield dropped seven basis points to 3.58%, while the 10-year yield fell six basis points to 3.65%.
Sector-wise, energy was the only S&P 500 sector to finish lower, declining 0.7%. The information technology sector led the pack with a substantial 7.3% gain.
Monday saw a solid performance, with major indices maintaining gains throughout the session. Alphabet bucked the upward trend, dropping as Google's antitrust trial began. Apple, which unveiled new products at its "It's Glowtime" event, recovered from early losses to slightly higher.
Tuesday experienced mixed action, with limited moves in either direction. Bank stocks faced pressure after JPMorgan Chase and Goldman Sachs commented on revenue expectations.
Wednesday started negatively following the CPI release but staged a remarkable turnaround. The S&P 500 and Nasdaq Composite finished near session highs, driven by strength in semiconductors and mega-cap stocks.
Thursday continued the week's winning streak, with all major indices settling near their best levels of the session. Upward momentum and ongoing buying interest in NVIDIA supported the broader market.
The week concluded on a high note Friday, with gains across all major indices. The Russell 2000 outperformed, jumping 2.5%. Market sentiment was buoyed by the belief in a soft economic landing and the possibility of significant rate cuts from the Federal Reserve. The University of Michigan's preliminary Consumer Sentiment survey for September supported this optimistic outlook, showing improvements in year-ahead expectations for personal finances and the economy.
Throughout the week, economic data releases generally aligned with my consensus estimates. The August CPI rose 0.2% as expected, while core CPI increased 0.3%, slightly above the 0.2% KR Forecast consensus. Initial jobless claims reached 230,000, close to the KR Forecast consensus of 229,000. The August Producer Price Index also met expectations, rising 0.2% overall, with core PPI slightly higher at 0.3% compared to the 0.2% KR Forecast consensus.
Upcoming economic releases for the week of September 16
September 16:
- NY Fed Empire State Manufacturing (Sep): KR Forecast -5.5, Consensus -4.1, Prior -4.7
September 17:
- Retail Sales (Aug): KR Forecast 0.1%, Consensus -0.2%, Prior 1.0%
- Retail Sales ex-auto (Aug): KR Forecast 0.3%, Consensus 0.2%, Prior 0.4%
- Industrial Production (Aug): KR Forecast 0.2%, Consensus 0.1%, Prior -0.6%
- Capacity Utilization (Aug): KR Forecast 78.0%, Consensus 77.9%, Prior 77.8%
- Business Inventories (Jul): KR Forecast 0.4%, Consensus 0.4%, Prior 0.3%
- NAHB Housing Market Index (Sep): KR Forecast 42, Consensus 41, Prior 39
September 18:
- MBA Mortgage Applications Index (09/14): Prior 1.4%
- Housing Starts (Aug): KR Forecast 1330K, Consensus 1320K, Prior 1238K
- Building Permits (Aug): KR Forecast 1425K, Consensus 1415K, Prior 1396K
- EIA Crude Oil Inventories (09/14): Prior 0.883M
- FOMC Rate Decision (Sep): KR Forecast 5.00-5.25%, Consensus 5.00-5.25%, Prior 5.25-5.50%
- Net Long-Term TIC Flows (Jul): Prior $96.1B
September 19:
- Initial Claims (09/14): KR Forecast 235K, Consensus 232K, Prior 230K
- Continuing Claims (09/07): Prior 1850K
- Current Account Balance (Q2): Prior -$237.6B
- Philadelphia Fed Index (Sep): KR Forecast -3.0, Consensus 3.0, Prior -7.0
- Existing Home Sales (Aug): KR Forecast 3.95M, Consensus 3.90M, Prior 3.95M
- Leading Indicators (Aug): KR Forecast -0.2%, Consensus -0.3%, Prior -0.6%
- EIA Natural Gas Inventories (09/14): Prior +40 bcf
Key releases to watch include Retail Sales, Industrial Production, Housing Starts, Building Permits, the FOMC Rate Decision, Initial Claims, and Existing Home Sales, all of which have a high trading impact.
WaveTech Database
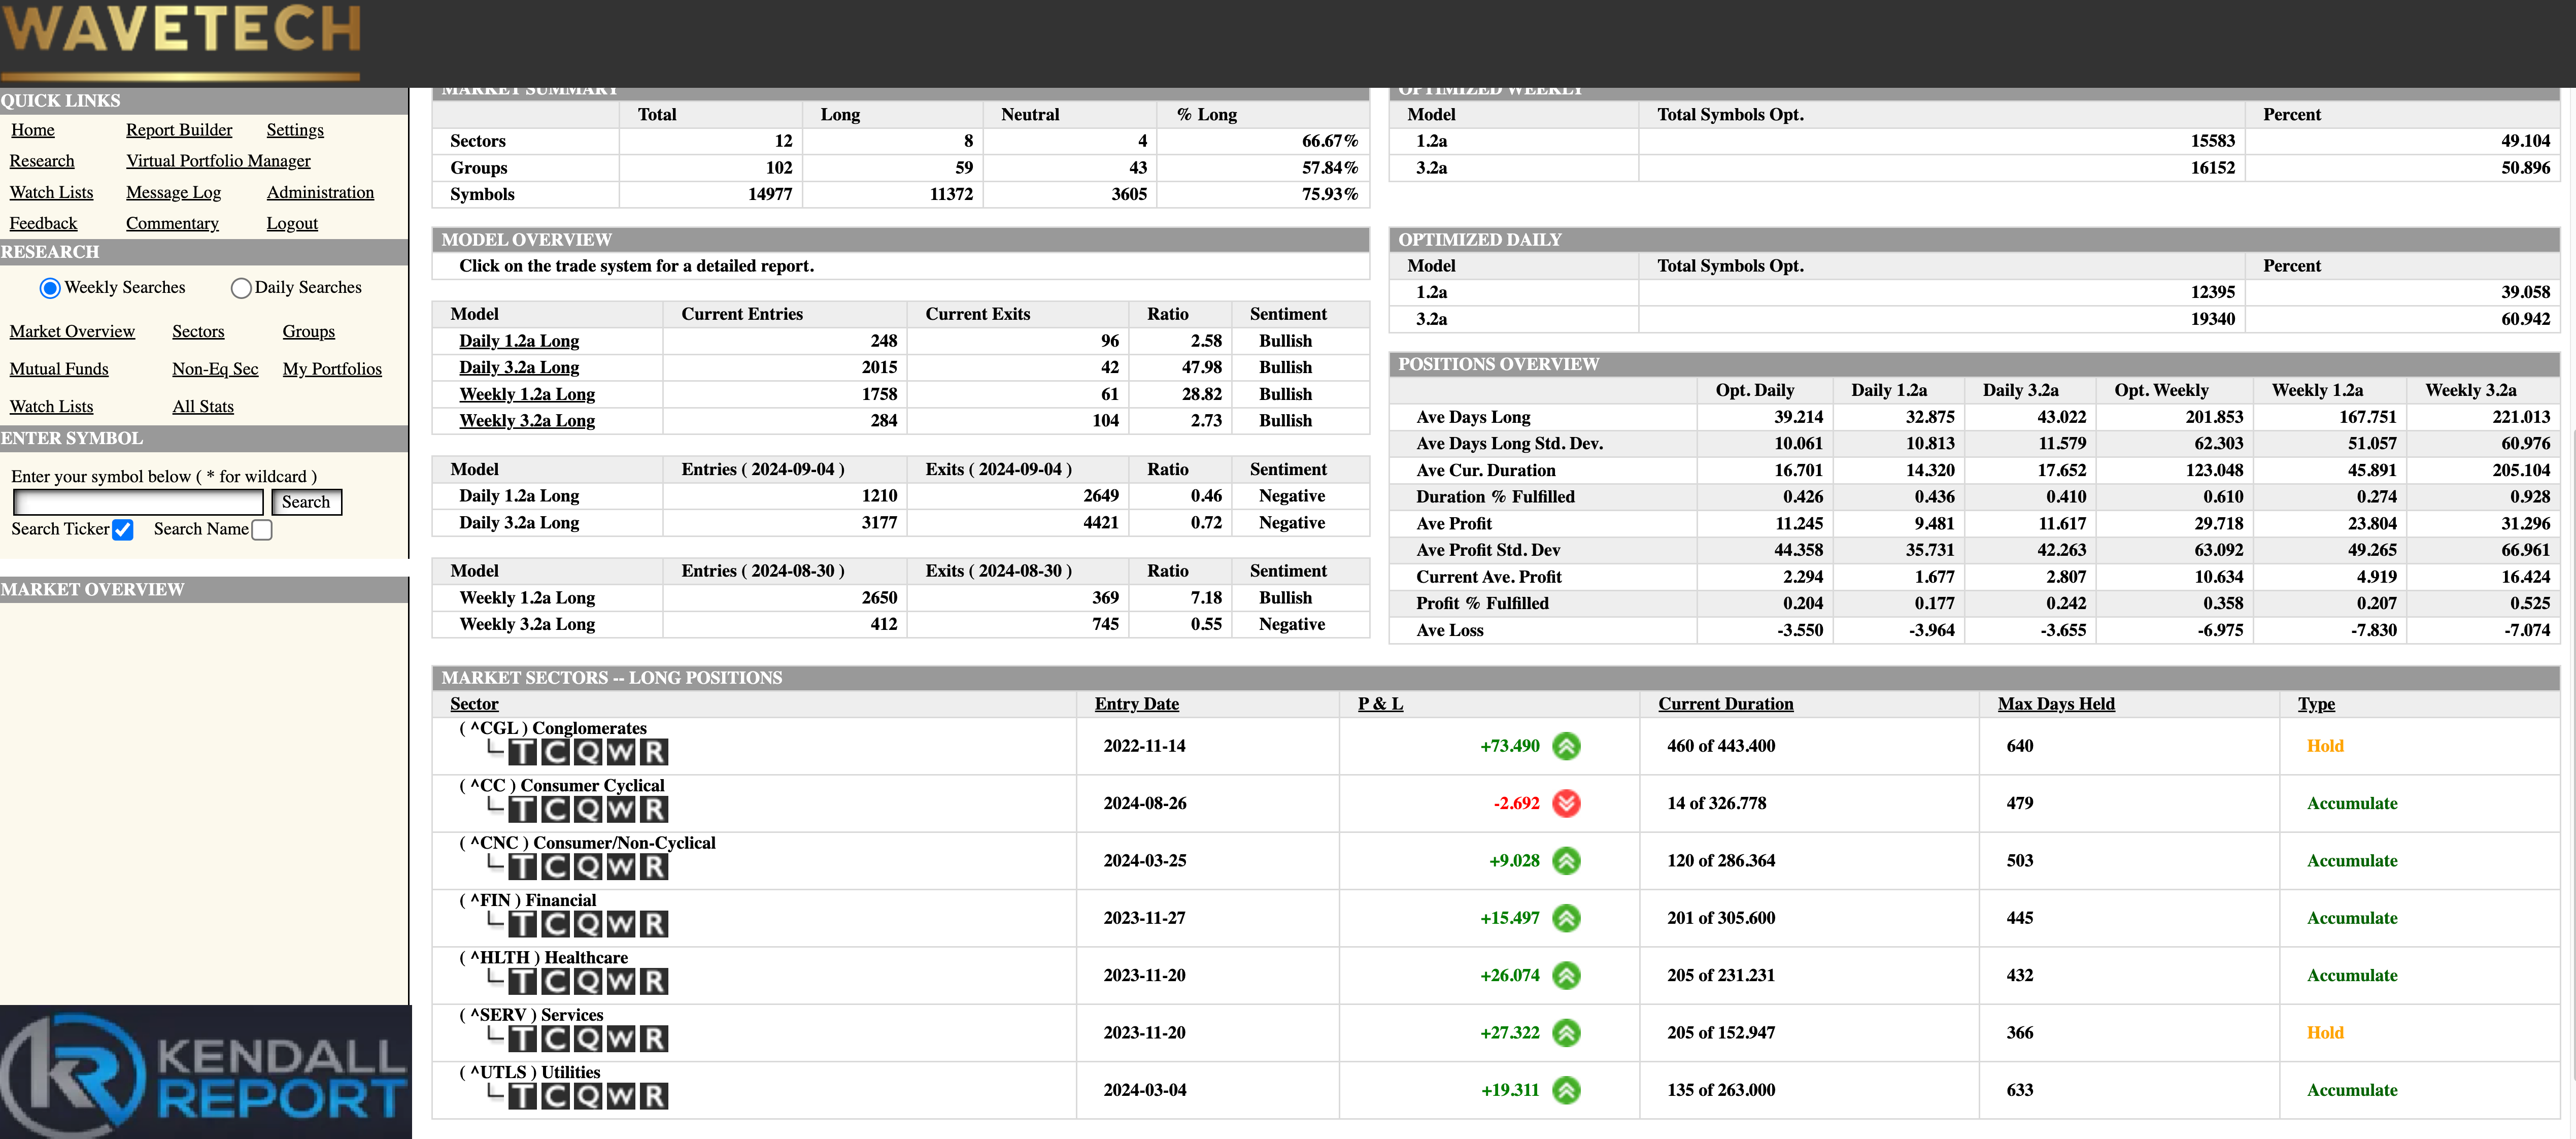
As we delve into the latest data, it's clear that we're witnessing a remarkable surge in market sentiment. Our intermediate-level database has maintained its position above the crucial 72% threshold and has now soared to an impressive 75.93%. This uptick signifies a robust acceleration in bullish momentum.
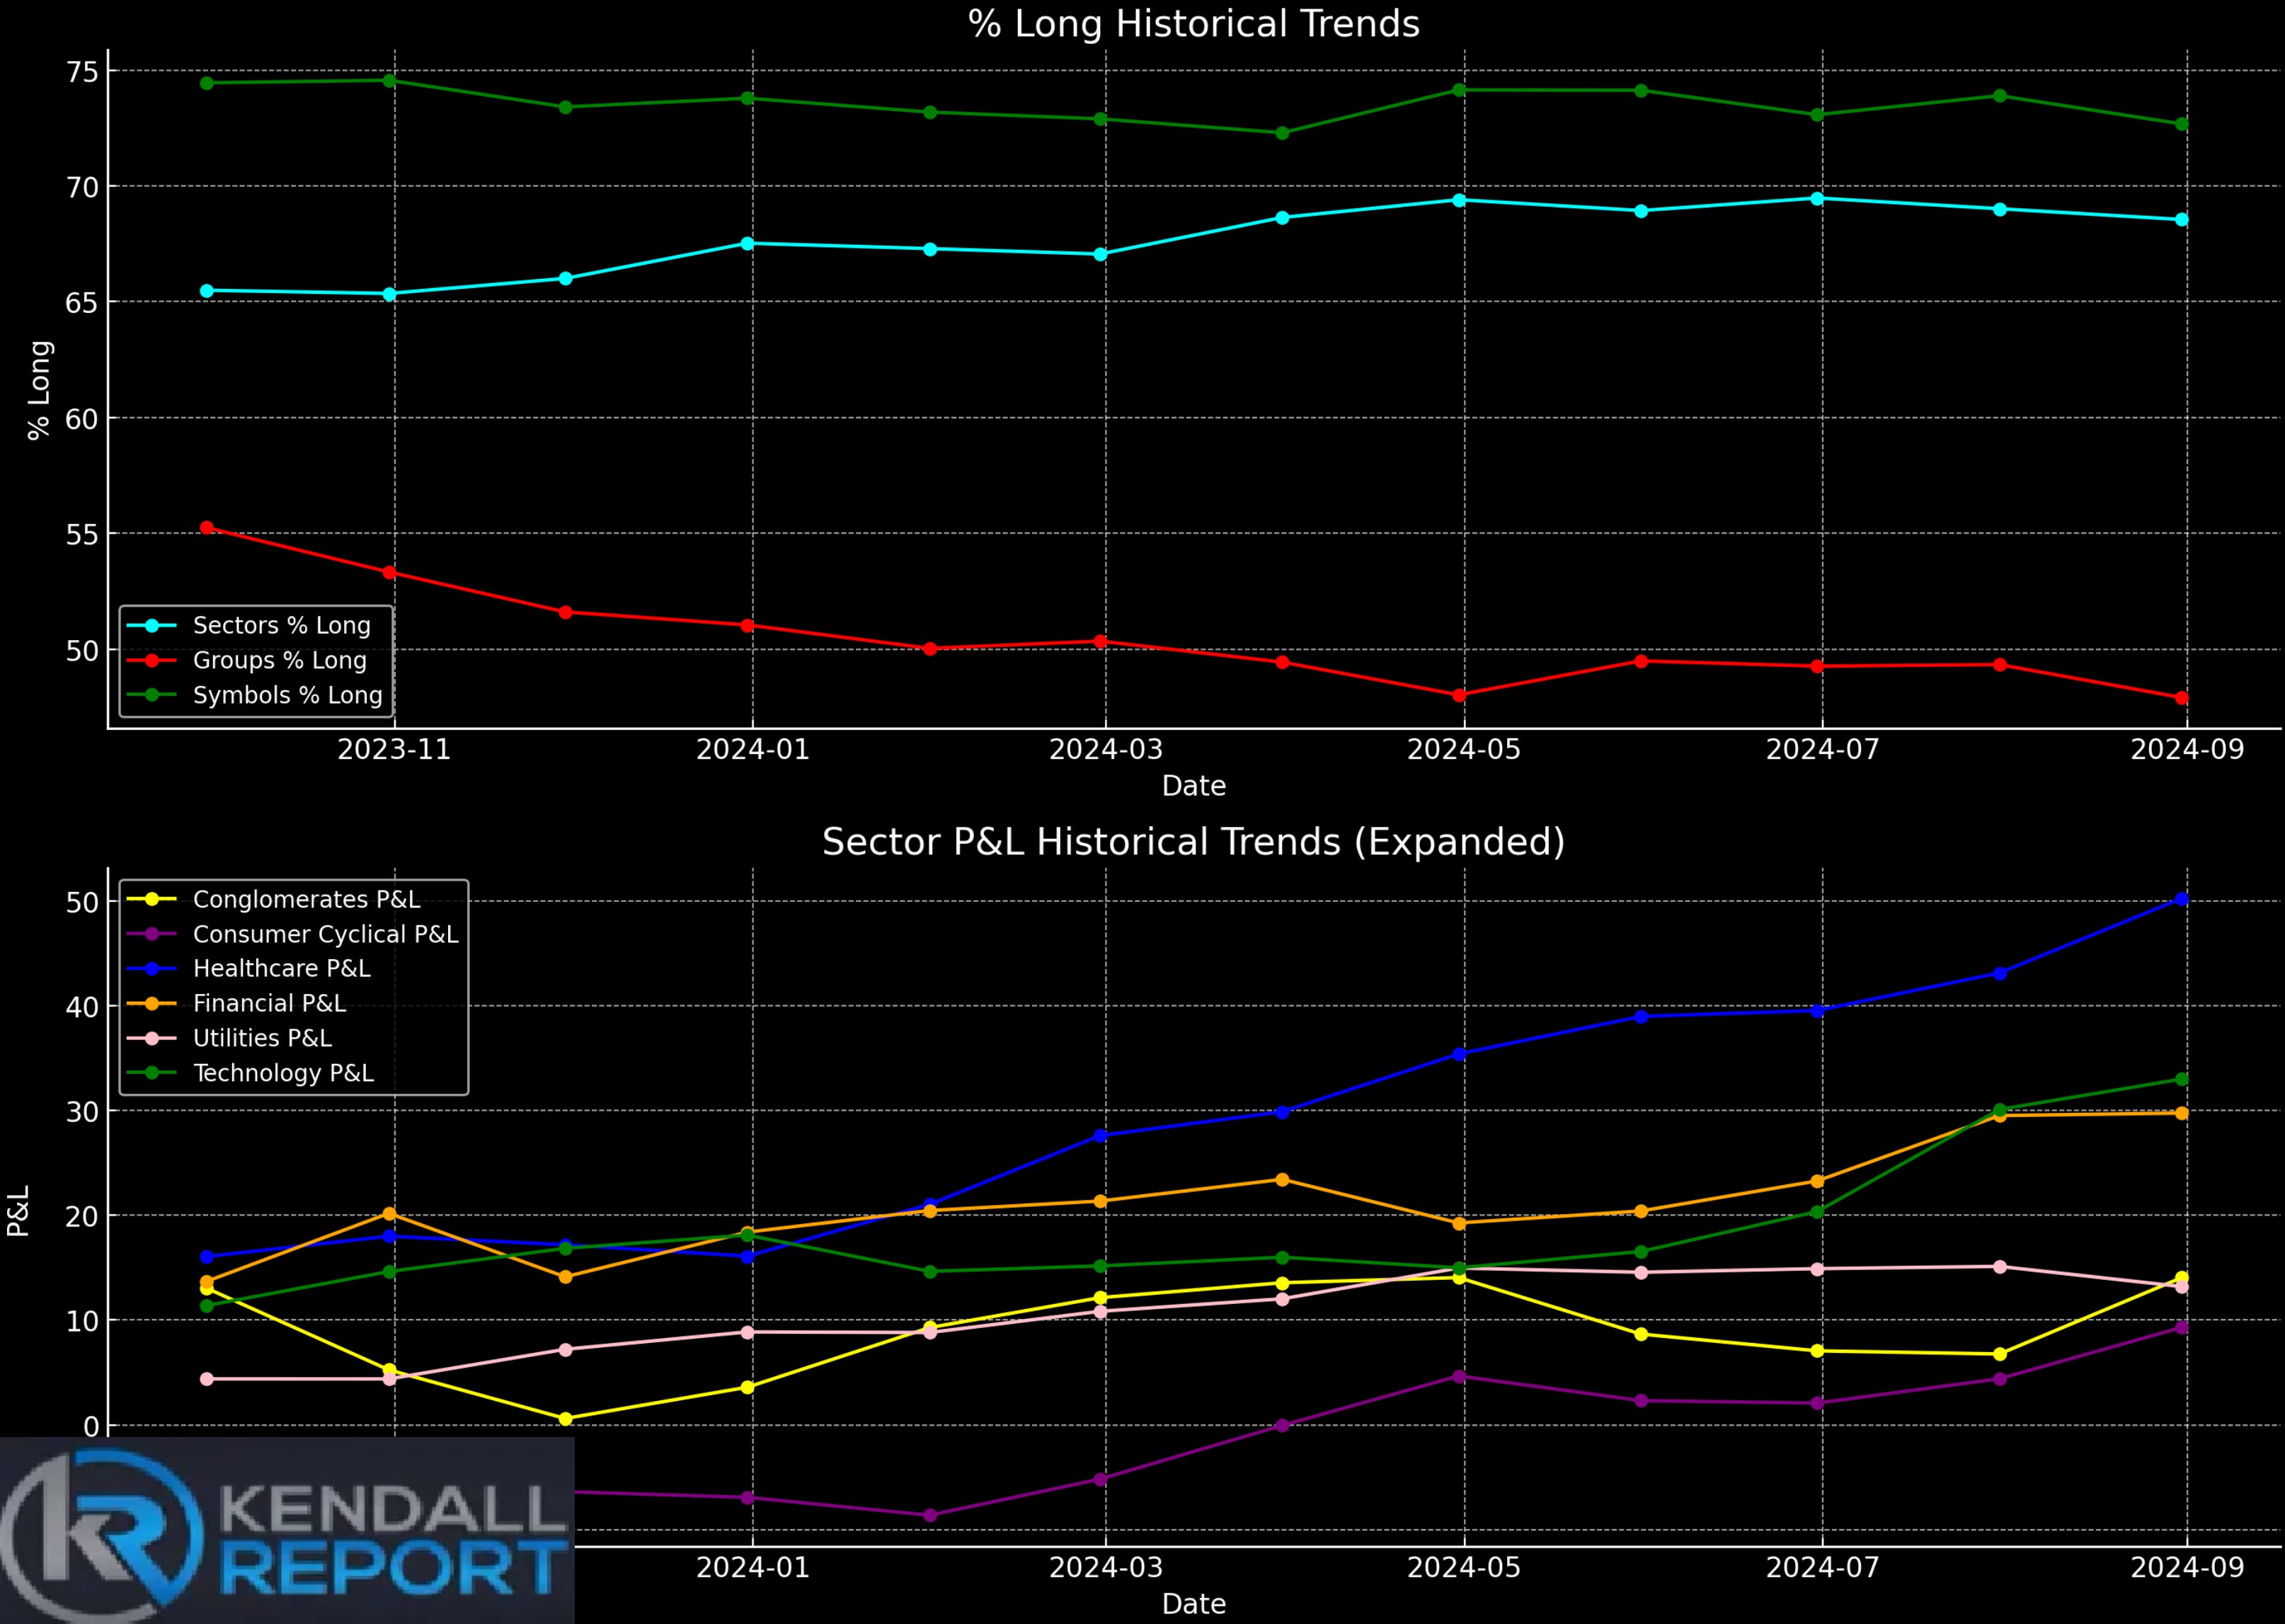
Let's break down what I am seeing in the rotation. The sector percent long chart reveals a compelling story of stability among symbols, consistently hovering above the 60% mark and averaging around 65%. While the groups show a slightly weaker profile, they still hold steady at approximately 50% as we project into 2024.
The sector P&L chart paints an equally optimistic picture. We're observing gains across the board, ranging from 10% to 40% in some sectors. This widespread positive performance underscores the strength of the current market rotation.
The weekly model runs have yielded some eye-opening results. We've seen a staggering 2,042 new entries with only 165 exits in our intermediate models, propelling the bullish percentage to that 75.93% figure mentioned earlier. The short-term models tell a similar tale, with 2,263 new entries and a mere 108 exits, pushing the bullish percentage back up to 59.38%. It's worth noting that this figure stood at 47% just a few days ago, highlighting our database's substantial rotation and refreshing.
So, what does all this mean for the markets? The forward-looking expectations are substantial. Our intermediate models have only fulfilled about 61% of their typical duration. To put this in perspective, the total duration is usually around 201 trading sessions, and we're currently at 123. While we rarely see 100% fulfillment, we'll likely reach at least the 170-180 level. This projection suggests a minimum of another 40 to 60 trading days ahead, potentially taking us into late November.
This aligns with my predictions since January. I anticipated the rally that began last October would potentially conclude around July or August. Instead, we're seeing a rotation and refreshing of the database, extending our forward-looking return expectations.
Speaking of returns, the average profit we typically see from our intermediate models is roughly 29.71%. However, we've only experienced about 10.2% of that, or 35.8% of the expected returns. This leaves significant room for potential growth in the market.
Another positive sign is the recent addition of two new sectors to our bullish list: consumer cyclical and capital goods. This sector-wide broadening has pushed us up to eight bullish sectors, indicating a robust market environment.
It's worth addressing the ongoing debate about a potential "soft landing" for the economy. If we see a Fed pivot this week, it's becoming increasingly likely that we'll achieve this soft landing.
We've already observed decent increases in housing starts and permits, with more data on these metrics expected this week. These figures will likely confirm the rotation we're seeing and support the forward-looking expectations reflected in our database.
The data paints a picture of a market with solid momentum, broad sector participation, and significant potential for continued growth.
S&P 500 Futures
