
Mass Exits Signaled!
New Downward Fibonacci Targets S&P and NASDAQ

Announcement
Folks, before diving into tonight's newsletter, I want to address my recent absence on YouTube. Due to ongoing family issues, I haven't been able to maintain a consistent presence on YouTube or on the X platform. I apologize for my lack of engagement.
Given my limited availability, I want to highlight the immense value of having my indicators in your trading arsenal. If you haven't purchased them yet, now is a crucial time. These indicators and six hours of training are available as a one-time purchase. We're currently offering a “Summer Special” for a limited time to make them more affordable, hoping this will empower those of you who have expressed financial constraints.
I deeply appreciate everyone who has subscribed to my Substack. We're nearing 2,000 subscribers!
As an incentive, if you refer more than three people, you can earn 3 free months of the newsletter. Please help spread the word so I can continue providing valuable information and tools.
Although I plan to return to YouTube with educational videos, my presence will be more limited. For those interested in the special deal, visit
www.kendallreport.com/indicators or check your email for details.
KR Opinion
The markets have been chopping in a sidewise pattern, with the WaveTech database remaining neutral, ranging between 22% and 42% bullish. Suddenly, the market declined by 0.76% in yesterday's session and dropped another 0.5% overnight. The concerning aspect is the volatility in the short-term database, which I haven't observed until this year. We've seen erratic behavior, particularly since April.
While I've been anticipating some moderate downside action, the market has shifted unexpectedly to a more negative status. The short-term database has issued numerous exit signals and generated new Fibonacci targets to the downside. I'll discuss this in more detail later.
Regarding the market configuration, the S&P still has some underlying support levels around the 5236 to 5209 range. However, the market could challenge more substantial levels as we move forward. I'll provide more detail on the WaveTech database shortly, but the intermediate trends remain solid and positive despite the short-term correction.
There's a significant development as the markets continue to struggle. The large-cap stocks had previously boosted the market, but today, everything turned south, and the selling was broad-based. Additionally, treasuries began to tick up, indicating upward potential for interest rates. I've been predicting an increase in inflation, and we should keep an eye on the PCE numbers coming out on Friday, which could be very interesting given the current downward projections.
As the markets approach a weekly extreme, I still expect to see some downside leading into Thursday. I'll discuss this in more detail in the technical section below.
Looking back on Wednesday’s Action
Wednesday’s trade exhibited a negative bias, with broad selling keeping major indices in negative territory throughout the session. The indices ultimately settled near their session lows as increased selling pressure hit heavily weighted stocks that had previously performed well.
Among these stocks, Amazon.com (AMZN 182.02, -0.13, -0.1%), Microsoft (MSFT 429.17, -1.15, -0.3%), and Alphabet (GOOG 177.40, -0.62, -0.4%) were notable. Earlier in the day, AMZN had risen as much as 1.1%, MSFT peaked at a 0.11% gain, and GOOG showed a 0.14% increase at its highest point.
The broad sell-off left all 11 S&P 500 sectors with losses. The energy sector was one of the top laggards, dropping 1.8% due to falling commodity prices. WTI crude oil futures declined by 0.8% to $79.25 per barrel, and natural gas futures fell by 5.7% to $2.66 per million British thermal units. Despite this, Marathon Oil (MRO 28.68, +2.23, +8.4%) bucked the trend, jumping over 8% following news of its acquisition by ConocoPhillips (COP 115.25, -3.71, -3.1%) in an all-stock transaction.
The industrial sector was the second worst performer, dropping 1.4%. Weak performance among airline stocks weighed on the sector after American Airlines (AAL 11.62, -1.82, -13.5%) lowered its Q2 EPS guidance, adjusted operating margin, and TRASM guidance below consensus.
Today's downside bias was partly due to normal consolidation after a recent strong run. Despite today's losses, the S&P 500 remains up 4.6% this month, and the Nasdaq Composite is up 8.1% since the start of May.
The price action in Treasuries also contributed to the negative bias in equities. The 10-year note yield rose by eight basis points to 4.62%, while the 2-year note yield remained unchanged at 4.98%. Yields were already trending higher, but increased selling followed a $44 billion 7-year Treasury note sale that met weak demand after a week of poor note offerings.
Today's economic data was limited to the weekly MBA Mortgage Applications Index, which declined by 5.7%, with refinance applications plunging 14% and purchase applications dropping 1%. Additionally, the Fed's latest Beige Book indicated that national economic activity continued to expand from early April to mid-May. Still, this release did not elicit significant reactions from bonds or equities.
·Nasdaq Composite: +12.7% YTD
·S&P 500:+10.4% YTD
·S&P Midcap 400: +5.0% YTD
·Dow Jones Industrial Average: +2.0% YTD
·Russell 2000: +0.5% YTD
Looking ahead, Thursday's economic releases
- 8:30 ET:
- Q1 GDP -- second estimate (KR Forecast consensus 1.3%; prior 1.6%)
- Q1 GDP Deflator -- second estimate (KR Forecast consensus 3.1%; prior 3.1%)
- Weekly Initial Claims (KR Forecast consensus 219,000; prior 215,000)
- Continuing Claims (prior 1.794 million)
- Advance April Goods Trade Balance (prior -$91.8 billion)
- Advance April Retail Inventories (prior 0.3%)
- Advance April Wholesale Inventories (prior -0.4%)
- 10:00 ET: April Pending Home Sales (KR Forecast consensus -0.5%; prior 3.4%)
- 10:30 ET: Weekly Natural Gas Inventories (prior +78 bcf)
- 11:00 ET: Weekly Crude Oil Inventories (prior +1.83 million)
WaveTech Database
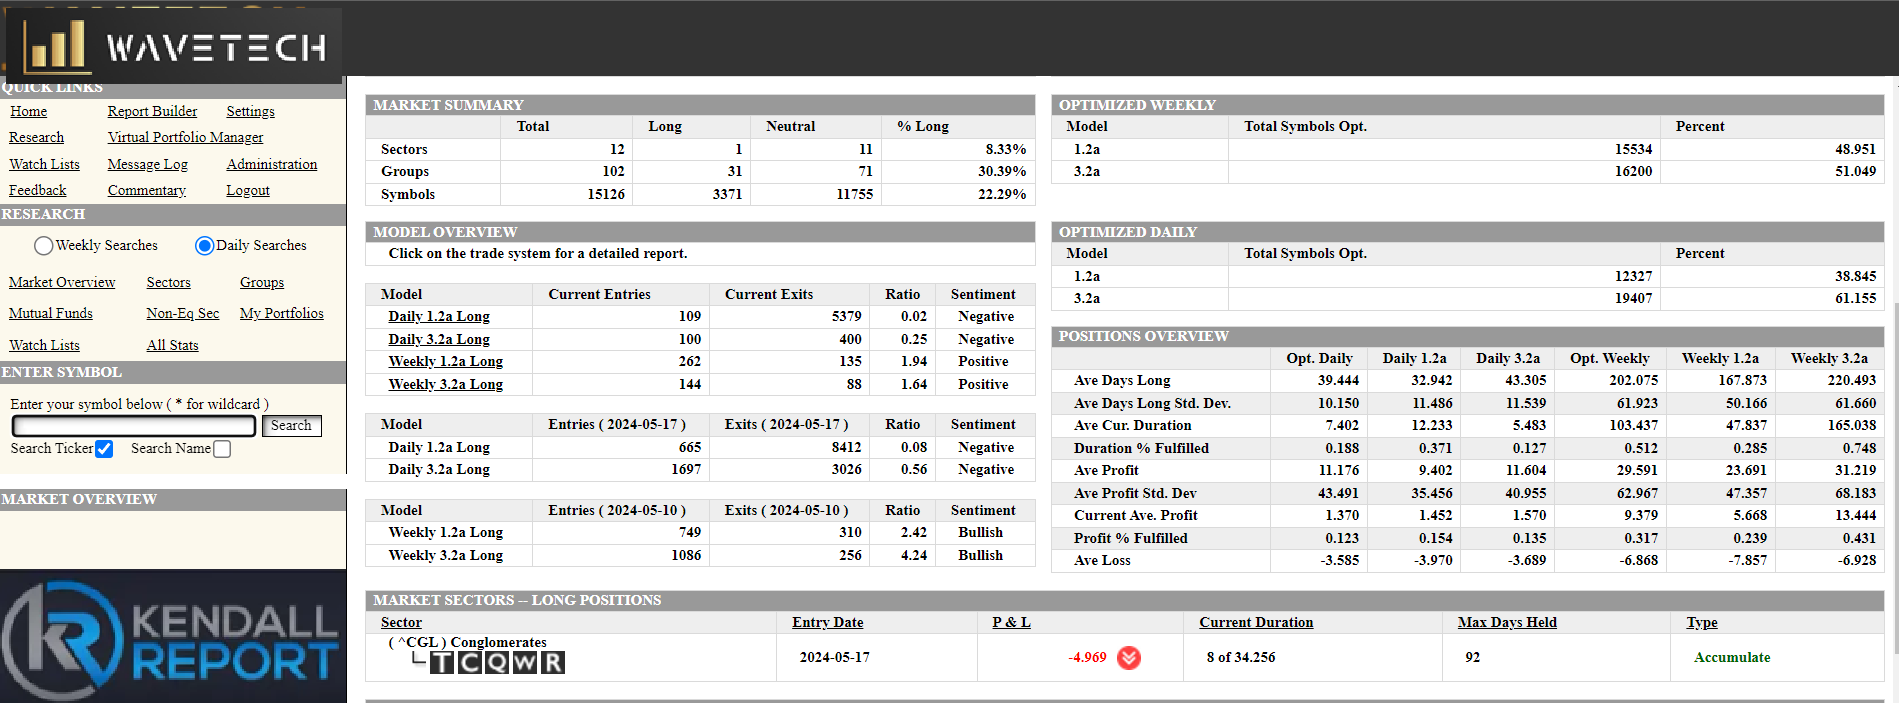
This minor drop in the S&P 500 and the NASDAQ has triggered a significant wave of selling, resulting in 5,779 exit signals and only 209 new purchases, bringing the bullish percentage down from 34% to 22.29%.
As I mentioned in my opening comments, the database's volatility has been substantial since April. We've observed normal short-term movements, but we hit a ceiling each time we try to gain traction. We briefly reached just above 42%, but we have now dropped 20% in just six trading sessions.
If we fall below the 22% level, we could re-enter a full liquidation mode, indicating further declines and potentially initiating selling in the intermediate models. I've been anticipating some attrition in the intermediate database over the past few weeks, but it has remained stable and even increased slightly in the last two to three weeks. However, this stability may be about to change as short-term patterns fail to follow through, likely impacting the intermediate models.
We previously had four sectors with long positions, but we are now down to just one—conglomerates—which is currently underwater. As we approach Friday, we might see the beginning of an intermediate liquidation phase. Last night's analysis of the forward-looking database on an intermediate level suggests that while the markets could remain positive into September on a sector basis, we might still see the bullish percentage drop.
Additionally, we've seen a substantial number of leading stocks start to turn bearish again, contributing to the increased activity in the database. The NASDAQ, in particular, has triggered many exits. I expect to see some exits in the weekly or intermediate database, suggesting a likely further consolidation phase.
At the moment, I don't foresee a full-blown top and major reversal, but we could see further deterioration as we move into early June. My expectation is consolidation and backfilling of the intermediate models.
S&P 500 Futures
