
NVIDA Triggers Higher Prices!
Bitcoin Reaches Short-term Peak

KR Opinion
Yesterday's market action was quite subdued until NVIDIA released its earnings after the market closed—more on that in a minute. The release of the FOMC minutes during the day led to a slightly negative response, as they were a bit more hawkish than many had expected. The Fed funds futures pared any expectations of a decrease in interest rates while the dollar and treasuries ticked up slightly.
The Fed reiterated that disinflation would take longer than anticipated, a point I've emphasized. I still believe there will be some increase in inflation over the next several months through the summer. Although this remains to be seen, inflation will likely stay around its current level, with a higher probability of a 0.3% to 0.5% year-over-year increase as we move through Q3 and possibly into Q4.
We have the typical initial and continuing claims releases as we approach Thursday, expected to be around 219,000. This number has been stable and has shown very low volatility, having little effect on the markets for some time. I don't expect this to change with the upcoming release.
Following the release of NVIDIA's earnings, the stock is up roughly 6%, which has also boosted the S&P and Nasdaq futures by 0.6% and 0.89%, respectively. This sets the tone for a strong opening, but we are trading near the RTX levels or the session's extremes, so there is potential for a rejection at these levels.
However, both indices have further Fibonacci targets to the upside. These are exciting times, and the more we hear about an AI bubble, the bigger it seems to get.
I expect Thursday's action to be reasonably volatile, with possible rejections of the RTX numbers that I will mention later in this report. It looks like full steam ahead, even though I discussed a possible pause yesterday.
The NVIDIA news has essentially trumped everything. Onward and upward as we continue this market squeeze that has been ongoing for several weeks.
Looking Back on Wednesday’s Action
NVIDIA reached a new all-time high as its April quarter results and July quarter guidance highlighted sustained AI demand. The market saw mixed action, with major indices trading in tight ranges during the morning before selling picked up in the afternoon. The Nasdaq Composite fell by 0.2%, the S&P 500 declined by 0.3%, and the Dow Jones Industrial Average dropped by 0.5%.
Morning trading was subdued, mirroring earlier sessions this week, as investors awaited NVIDIA's (NVDA 949.50, -4.36, -0.5%) earnings report due after Wednesday's close. Selling increased following the release of the Minutes from the April 30-May 1 FOMC meeting. Although the minutes largely reiterated previous Fed commentary, they highlighted asset valuations, likely prompting some profit-taking.
Most stocks saw modest declines, with Target (TGT 143.27, -12.51, -8.0%) a notable exception, falling 8.0% due to disappointing earnings and outlook. On the upside, Analog Devices (ADI 240.16, +23.52, +10.9%) and First Solar (FSLR 251.75, +39.64, +18.7%) performed well, with Analog Devices reporting strong earnings and First Solar benefiting from a Bloomberg report suggesting that China's solar industry body seeks to end the price war.
Only three S&P 500 sectors closed with gains, while three sectors declined by more than 1.0%. The 10-year note yield increased by two basis points to 4.43%, and the 2-year note yield rose by five basis points to 4.88%, influenced by the FOMC minutes, a hotter-than-expected April CPI report from the U.K., and a weaker-than-expected Existing Home Sales report for April.
·Nasdaq Composite: +11.9% YTD
·S&P 500:+11.3% YTD
·S&P Midcap 400: +7.5% YTD
·Dow Jones Industrial Average: +5.3% YTD
·Russell 2000: +2.7% YTD
Wednesday’s Economic Releases
- Weekly MBA Mortgage Applications Index: 1.9%; Prior: 0.5%
- April Existing Home Sales: 4.14 million (KR Forecast: 4.20 million); Prior was revised to 4.22 million from 4.19 million
- The key takeaway from the report is that sales activity was much stronger in the upper end of the market (homes priced $1 million or more), with inventory up 34% year-over-year and sales up 40% year-over-year. This underscores the idea that pent-up demand can be unleashed when more inventory for lower-priced homes becomes available.
- Weekly EIA Crude Oil Inventories: +1.83M; Prior: -2.51M
Thursday's Economic Calendar
- 8:30 ET: Weekly Initial Claims (KR Forecast: 219,000; Prior: 222,000) and Continuing Claims (Prior: 1.794 million)
- 9:45 ET: Flash May S&P Global U.S. Manufacturing PMI (Prior: 50.0) and Flash May S&P Global U.S. Services PMI (Prior: 51.3)
- 10:00 ET: April New Home Sales (KR Forecast: 680,000; Prior: 693,000)
- 10:30 ET: Weekly Natural Gas Inventories (Prior: +70 bcf)
WaveTech Database
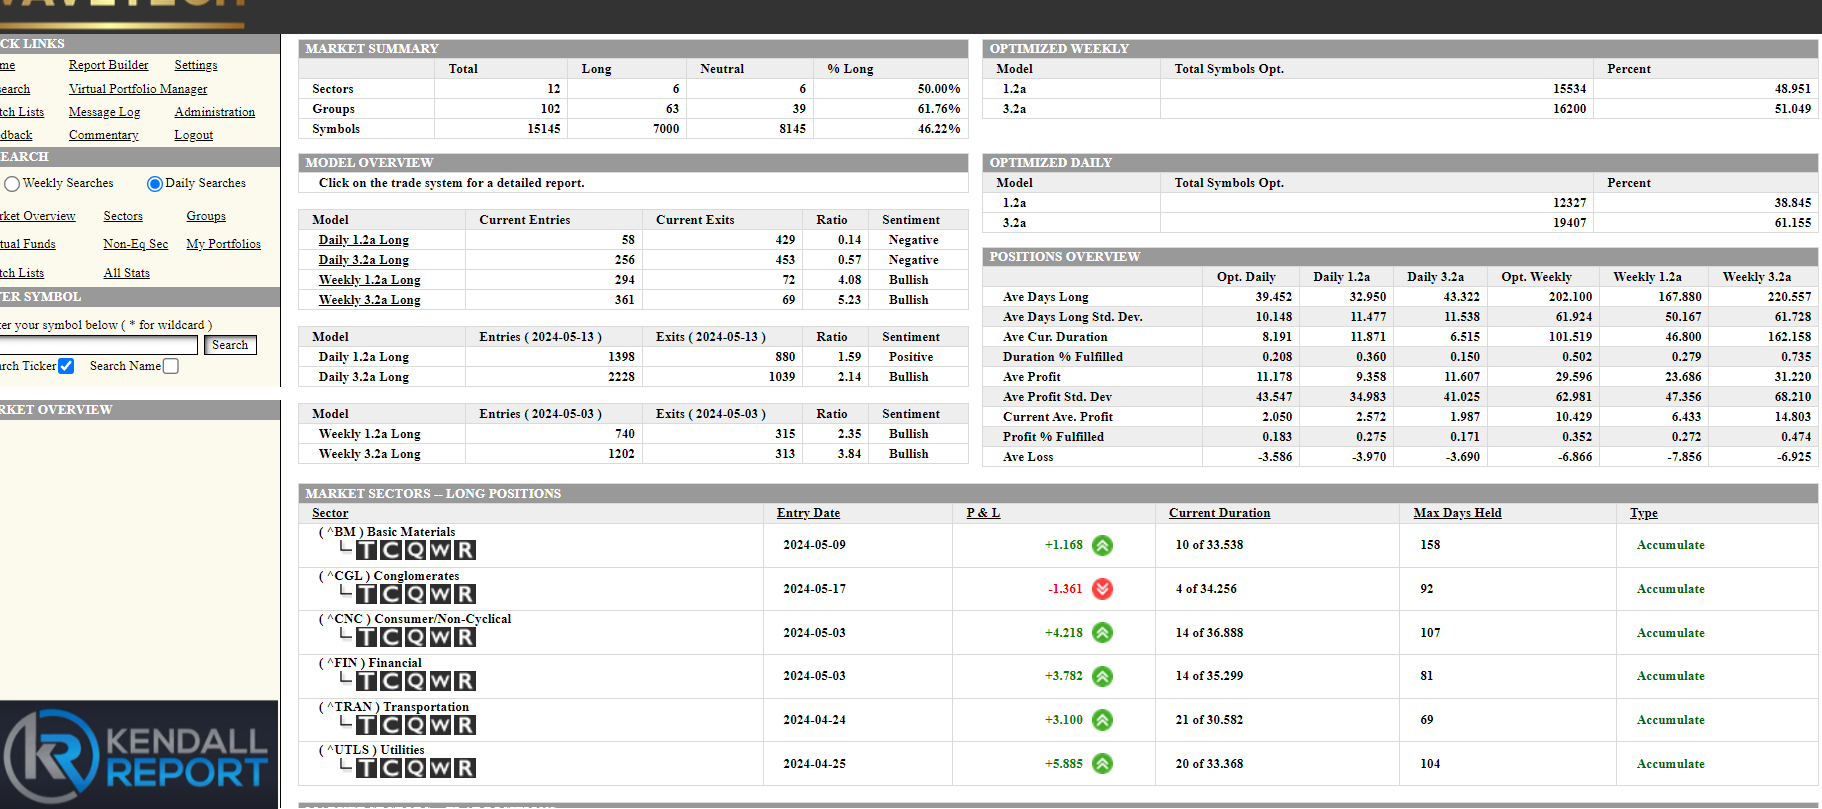
Regular readers know that I often discuss certain metrics and percentages within our database, both for the short-term and intermediate-term periods. These metrics include 42%, 48-52%, 52-58%, 62-68%, and above 74%, indicating extremes. The database has reached over 90% bullish in rare cases, usually after extreme market volatility.
Understanding these metrics is crucial because certain patterns and rotations occur around them. Currently, the database is at about 48%, where we often see rotations, with the percentage fluctuating between 42% and 48%.
In the latest update, we had 314 new entries and 882 exits, bringing the bullish percentage down from 48% to 46.22%. Despite reaching new highs recently, we are not at extreme levels. I expect we'll see a rotation here, but if the percentage rises above 48%, it typically suggests that the market trends will gain more traction and extend further.
This concept also applies to the intermediate level, where the implications are even more significant. I cover these metrics and their importance every night in my newsletter to help readers understand market movements.
I also plan to create a YouTube video explaining these metrics and how to interpret them, especially for those using the WaveTech software.
The same rotational patterns observed in the overall database also occur within sectors and industry groups, providing deeper insights. I consistently feature this analysis on my YouTube channel and Substack.
These metrics offer valuable information about changes, trends, and the completion of market cycles. Therefore, I encourage everyone to pay close attention to these details.
S&P 500 Futures
