
"NVIDIA Surges Past Doomsayers:
"DOGE Digs Deep:

KR Opinion
Yesterday, NVIDIA's earnings report significantly exceeded market expectations, contradicting fears of a potential disaster. This positive surprise came after a challenging four-session decline, during which the stock dropped over 9.1%, creating conditions ripe for a rebound. We also witnessed a sympathy rally in the tech sector, with semiconductors rising 2.1% alongside NVIDIA's upward movement.
Despite a promising start yesterday, market strength quickly dissipated as sellers emerged near overhead resistance levels again, continuing the ongoing distribution pattern. The White House held its first cabinet meeting following an overnight House vote that proposed a $4.5 trillion tax cut spanning the next decade. Interestingly, markets showed minimal reaction to this news, suggesting investors remain skeptical about the likelihood of such massive tax reductions materializing.
Pressure continues to mount against mega-cap stocks as the Trump administration pursues its aggressive agenda. Department of Government Efficiency (DOGE) officials continue uncovering fraud and waste across agencies, and investigations are expected to soon extend to the IRS, Pentagon, and other departments.
This year, the market's sideways trading range suggests potential downside movement ahead of the current pattern. Upward momentum seems unlikely without positive developments, particularly on the geopolitical front. However, rumors of potential deals with Ukraine and Russia could alter this outlook if the geopolitical landscape begins to realign, potentially creating a more bullish environment. The distribution pattern will likely continue, possibly resolving with most indices reaching their 200-day moving averages.
Observing the current government operations resembles watching an unpredictable movie filled with unexpected twists and turns. We anticipate further revelations regarding various scandals and major historical events, potentially stretching back to the JFK assassination. Whether these developments will impact market sentiment remains uncertain, but the current skittish psychology suggests continued volatility, with the trading range possibly expanding downward.
DJIA: +2.3% YTD
S&P 500: +1.3% YTD
S&P Midcap 400: -0.6% YTD
Nasdaq Composite: -1.2% YTD
Russell 2000: -2.5% YTD
Reviewing Wednesday's economic data:
New home sales decreased 10.5% month-over-month in January to a seasonally adjusted annual rate of 657,000 units (KR Forecast consensus 681,000) from an upwardly revised 734,000 (from 698,000) in December. On a year-over-year basis, new home sales were down 1.1%.
The key takeaway from the report is that new home sales in January felt the brunt of affordability constraints tightened by elevated mortgage rates and higher prices.
MBA Mortgage Applications Index -1.2% week-over-week (prior -6.6%) with refinance applications down 4% and purchase applications flat
Thursday's economic calendar includes:
08:30 ET: The second estimate for Q4 GDP (KR Forecast consensus 2.3%; prior 2.3%) and GDP Deflator (KR Forecast consensus 2.2%; prior 2.2%)
08:30 ET: Weekly Initial Claims (KR Forecast consensus 220K; prior 219K) and Continuing Jobless Claims (prior 1869K)
08:30 ET: January Durable Goods Orders (KR Forecast consensus 1.8%; prior -2.2%) and Durable Goods Orders, Excluding Transportation (KR Forecast consensus 0.4%; prior 0.3%)
10:00 ET: January Pending Home Sales (KR Forecast consensus -0.8%; prior -5.5%)
WaveTech Database
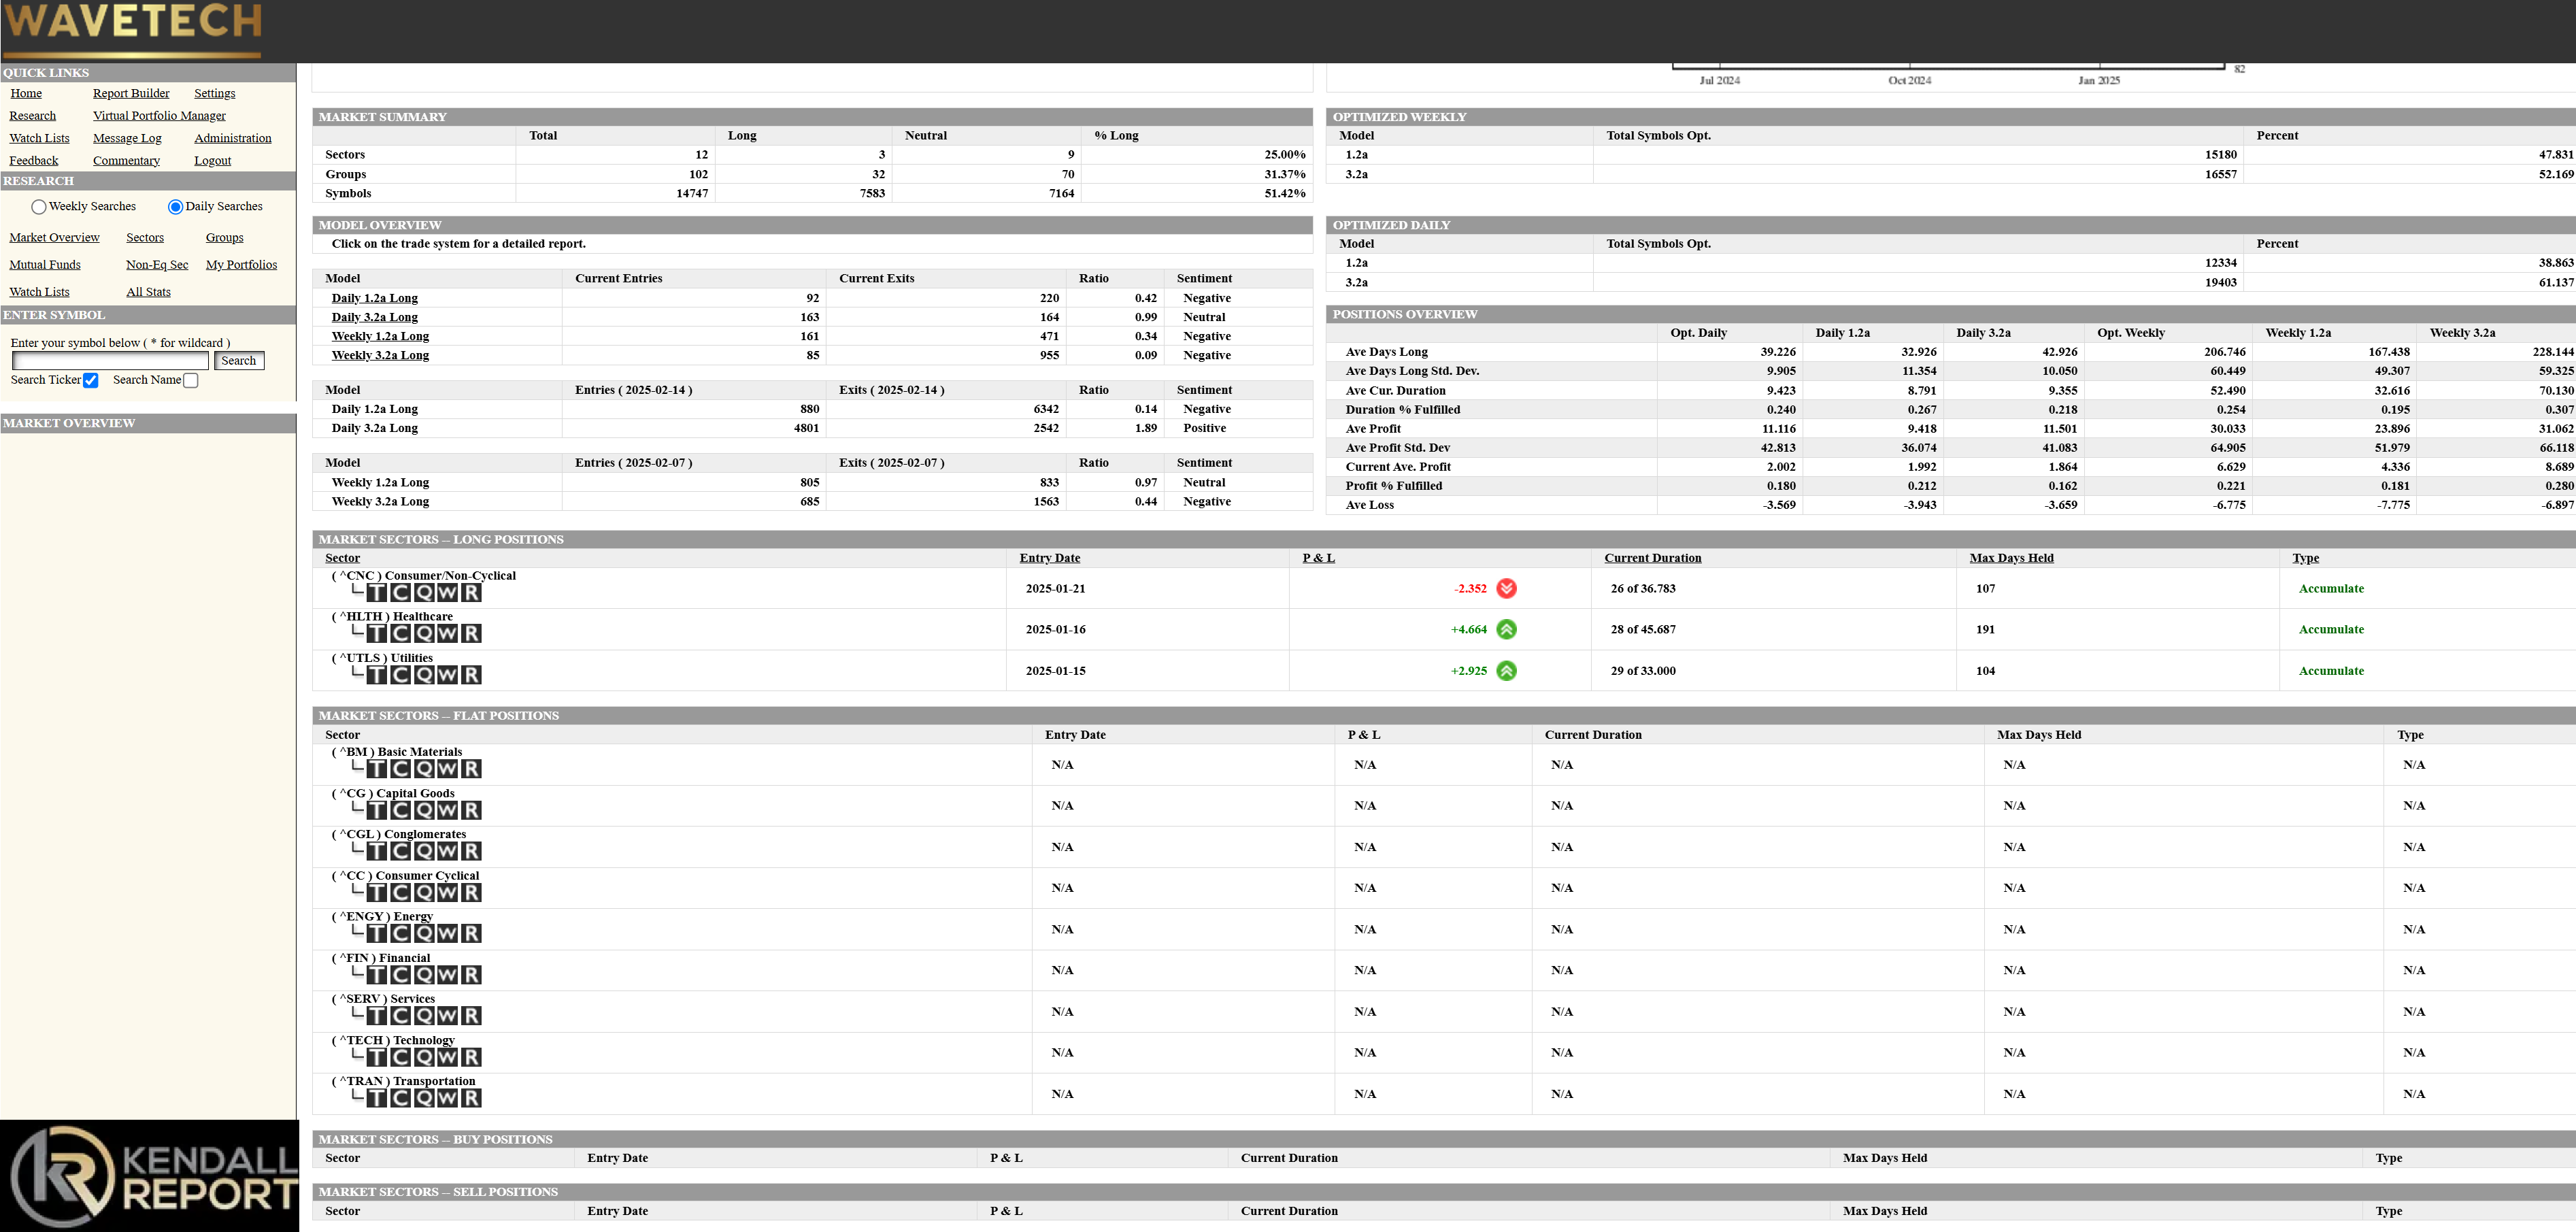
The WaveTech Database has stabilized at the 51.42% level, positioning us just above the critical 42% sustainable upside threshold. This stabilization appears to be primarily driven by a rotation between bulls and bears rather than any substantial market shift.
Despite this relatively healthy overall percentage, we're witnessing signs of concern in the broader market structure. Sector participation has deteriorated significantly, with only 3 sectors (25%) showing positive signals out of 12 tracked sectors. Similarly, industry group participation remains weak at just 31.37%, with only 102 groups in long positions out of 327 total groups.
The daily models are sending mixed signals. The Daily 1.2a Long model shows 92 entries against 220 exits, creating a concerning 0.42 ratio with negative sentiment. Meanwhile, the Daily 3.2a Long model presents a nearly balanced 163 entries versus 164 exits, resulting in a neutral 0.99 ratio.
This configuration suggests we're experiencing extremely narrow market participation at both short-term and intermediate-term levels. While we remain above the critical 42% threshold, preventing immediate liquidation concerns, the deteriorating sector signals indicate potential vulnerability. Several sectors appear to be approaching maturity in their current patterns, suggesting they may be closer to exits than continuation.
The WaveTech models' probability analysis indicates increased volatility as the market attempts to maintain this level. With sector participation so low, we may experience significant day-to-day fluctuations as leadership rotates among a limited number of groups. Based on current data patterns, the most likely scenario would be testing of lower support levels, potentially challenging the 42% threshold in the coming sessions.
If sector participation doesn't broaden soon, the WaveTech models suggest that the probability of a move toward the 28% correction level will increase. Traders should remain cautious, as the current narrow leadership makes the market susceptible to negative catalysts.
S&P 500 Futures
The S&P 500 E-mini Futures (ES) show positive overnight action on Thursday, February 27th. The market is at 5995, up 24 points or 0.41% from the previous close. Premarket trading has established a range between a high of 5996 and a low of 5961, with a volume of 81K contracts. This upward movement comes as the market continues working within a sideways consolidation pattern.
The WaveTech Market Grid shows the current price just above the R01 level at 5990, suggesting immediate resistance has been temporarily overcome in overnight trading. The following significant resistance targets are at R02 (6011) and R03 (6033). The R02 level closely aligns with a key Fibonacci level, giving it approximately 70% probability of serving as meaningful resistance when tested during regular trading hours. Support levels at S01 (5952) and the more critical S03 (5909) remain key downside targets if selling pressure emerges.
