
Rotation Broadens While Semiconductors Keep the Downside Open
Free Edition!

KR Market Opinion
Crude oil has collapsed, yields are falling, and inflation expectations are finally moderating. The broader market keeps rotating. And yet, technology and semiconductors remain vulnerable in ways the cheerful headlines this week are not telling you. That is the tension I want to walk through as we close the week, because it is the single thread that ties together the data, the Fed noise, the Micron reaction, and the downside risk I am still carrying in the S&P futures.
Let me start with the data, because Thursday gave us a full plate. We got the PCE inflation numbers, weekly jobless claims, continuing claims, personal income and spending, and the third estimate of first-quarter GDP. The number that matters is PCE, expected to come in around plus 0.2 percent month over month. The market is leaning toward the idea that inflationary pressures are moderating again, and there is a real reason for that shift. Crude oil has fallen hard, from around $ 95 a barrel to around $ 69. That kind of move in crude should eventually work its way through the inflation data. The question is never whether it shows up. The question is timing, and timing is where most people get impatient and get it wrong.
Here is something worth watching that ties directly into that. President Trump is now looking into why gasoline prices are not falling faster at the pump. Wholesale prices and futures have dropped substantially, but we are not seeing the same decline at local gas stations, especially at some independent stations. I talked about this a couple of videos ago. Gas prices shoot up immediately when crude rallies, but they come down very slowly when crude collapses. That spread between falling wholesale prices and sticky pump prices deserves a lot more attention than it gets. There is a game that gets played in the distribution chain, particularly among some independent distributors. I had a friend who worked in that business for about 30 years, and I have heard plenty of stories about what goes on when oil and gasoline get volatile. So it is about time we saw more scrutiny and more compliance around inventories, wholesale pricing, and what people are actually paying at the pump.
For the rest of the data, I am not expecting much market impact from weekly or continuing claims. The labor market remains steady, and barring a real surprise, those numbers should not move the market’s view. Personal income and spending should show modest gains. And then there is the third estimate of first-quarter GDP, which is one of those numbers I have complained about for years. Here we are, nearly four months later, finally getting another look at what happened in the first quarter. These reports have historical value, but they tell you almost nothing about what is happening right now. The revisions come slowly, and by the time the final print lands, the market has long since moved on.
That brings me to the Fed. The most interesting thing happening right now is that the market is slowly losing interest in trying to guess every single move the Fed might make. I have said this before, and I will say it again. The best thing the Fed could do at the next meeting is issue a very short statement, provide no forward guidance, and skip the press conference entirely. Just release the statement and move on. The market needs to normalize. It needs to stop being trained to react to every word, every phrase, every dot-plot reading. And if you are using CME Fed futures to predict what the Fed is going to do months from now, you might as well use a dartboard. It will be about as accurate.
Now to the part of the week that everyone wanted to talk about. The big earnings event after Wednesday’s close was Micron. The company posted strong results again, and the stock rallied hard after selling off over the prior couple of sessions. But when I went through the TradeIQ chart on Wednesday night’s video, the setup told a more cautious story. The chart reflected more potential downside risk than upside reward from current levels. That matters because the financial media is already spinning Micron’s report as proof that the AI and semiconductor trade is ready to reaccelerate. I am not convinced. I think that trade may not be as robust as many expect, and there is still downside risk in the technology sector and in chip names themselves.
Memory has been one of the hotter corners of the market, and even there, the group is starting to consolidate. The TradeIQ sheets still carry an upside bias overall, but it is a cautious upside bias, and that distinction is the whole point. A cautious upside bias is not a green light. It tells me the market is not broken, but there is still some downside work left to do before the next durable leg higher.
That fits the broader structure we talked about yesterday. The major averages finished mixed, with the S&P 500 down 0.1 percent, the Nasdaq Composite down 0.4 percent, and the Dow up 0.4 percent. That split tells you the weakness was concentrated in semiconductors and mega-cap technology, while other parts of the market kept rotating higher. Six S&P sectors finished green, with industrials up 1.2 percent, utilities up 1.1 percent, health care up 0.8 percent, consumer discretionary up 0.8 percent, and consumer staples up 0.6 percent. Energy was the laggard, down 1.7 percent, which makes all the sense in the world given what crude just did.
The rotation underneath is the real story, and the year-to-date numbers make it impossible to ignore. The Russell 2000 is now up 20.3 percent on the year, the S&P Mid Cap 400 is up 14.6 percent, the Nasdaq Composite is up 9.6 percent, the Dow is up 7.8 percent, and the S&P 500 is up 7.5 percent. That is a completely different leadership profile than the one we lived with when mega-cap technology was dragging everything along behind it. Money is broadening out, and that is healthy, even when the index-level prints look soft.
Treasury yields helped. The 2-year fell five basis points to 4.14 percent and the 10-year fell nine basis points to 4.40 percent. That move supported homebuilders, construction names, utilities, and the other rate-sensitive groups. Homebuilders had a particularly strong session, even though new home sales came in weaker than expected at 580,000 against a 627,000 consensus. The market cared more about the drop in yields than about a backward-looking housing number, and that is exactly the kind of tell that shows you where the tape’s attention really sits.
From a technical standpoint, I am still looking for downside risk in the S&P futures toward the 7200 to 7100 zone, with the possibility of a move toward the 200-day moving average if this vulnerability keeps building. That has not fully triggered yet, but the warnings are still on the board, and I am not going to pretend they are not there just because the rotation story feels good.
As we move into the end of the week, my main focus is the WaveTech Database. I will dig into this again in Friday’s letter and in Thursday night’s video. The question that matters is whether we see serious selling come into the database by Friday. I will be watching the 48 percent level very closely. If the database weakens further and that level comes into play, it tells me the market’s internal structure is getting more vulnerable underneath the surface. If it stabilizes, the rotation story stays intact and the broadening continues.
So here is the bottom line. Crude has collapsed, yields are falling, inflation expectations are beginning to moderate, and the broader market is still rotating with real participation underneath. That is the constructive half. The cautious half is that technology and semiconductors remain vulnerable. Micron’s earnings may create some short-term optimism, but I am not ready to say the AI trade is ready to launch again. For now, this remains a market with broadening participation beneath the surface and meaningful downside risk still developing in the major indexes at the same time. Both things are true at once, and that is the read I am carrying into the session.
Economic Calendar — Week Ahead
Week of June 22 - 26
June 25
08:30 ET: Personal Income
For: May | Trading Impact: High | KR Forecast: 0.3% | KR Forecast Cons: 0.3% | Prior: 0.0%
08:30 ET: Personal Spending
For: May | Trading Impact: High | KR Forecast: 0.2% | KR Forecast Cons: 0.3% | Prior: 0.5%
08:30 ET: PCE Prices
For: May | Trading Impact: High | KR Forecast: 0.3% | KR Forecast Cons: 0.4% | Prior: 0.4%
08:30 ET: PCE Prices - Core
For: May | Trading Impact: High | KR Forecast: 0.2% | KR Forecast Cons: 0.3% | Prior: 0.2%
08:30 ET: GDP - Third Estimate
For: Q1 | Trading Impact: High | KR Forecast: 1.6% | KR Forecast Cons: 1.6% | Prior: 1.6%
08:30 ET: Durable Orders
For: May | Trading Impact: Medium | KR Forecast: -3.5% | KR Forecast Cons: -3.2% | Prior: 7.9%
08:30 ET: GDP Deflator - Third Estimate
For: Q1 | Trading Impact: High | KR Forecast: 3.5% | KR Forecast Cons: 3.5% | Prior: 3.5%
08:30 ET: Durable Goods - ex transportation
For: May | Trading Impact: Medium | KR Forecast: 0.4% | KR Forecast Cons: 0.5% | Prior: 1.1%
08:30 ET: Initial Claims
For: 06/20 | Trading Impact: High | KR Forecast: 220K | KR Forecast Cons: 225K | Prior: 226K
08:30 ET: Continuing Claims
For: 06/13 | Trading Impact: High | KR Forecast: NA | KR Forecast Cons: NA | Prior: 1810K
10:30 ET: EIA Natural Gas Inventories
For: 06/20 | Trading Impact: High | KR Forecast: NA | KR Forecast Cons: NA | Prior: +73 bcf
June 26
08:30 ET: Adv. Intl. Trade in Goods
For: May | Trading Impact: Low | KR Forecast: NA | KR Forecast Cons: NA | Prior: -$82.4B
08:30 ET: Adv. Retail Inventories
For: May | Trading Impact: Low | KR Forecast: NA | KR Forecast Cons: NA | Prior: 0.7%
08:30 ET: Adv. Wholesale Inventories
For: May | Trading Impact: Low | KR Forecast: NA | KR Forecast Cons: NA | Prior: 0.5%
10:00 ET: Univ. of Michigan Consumer Sentiment - Final
For: Jun | Trading Impact: Low | KR Forecast: 49.2 | KR Forecast Cons: 48.9 | Prior: 48.9
WaveTech Database
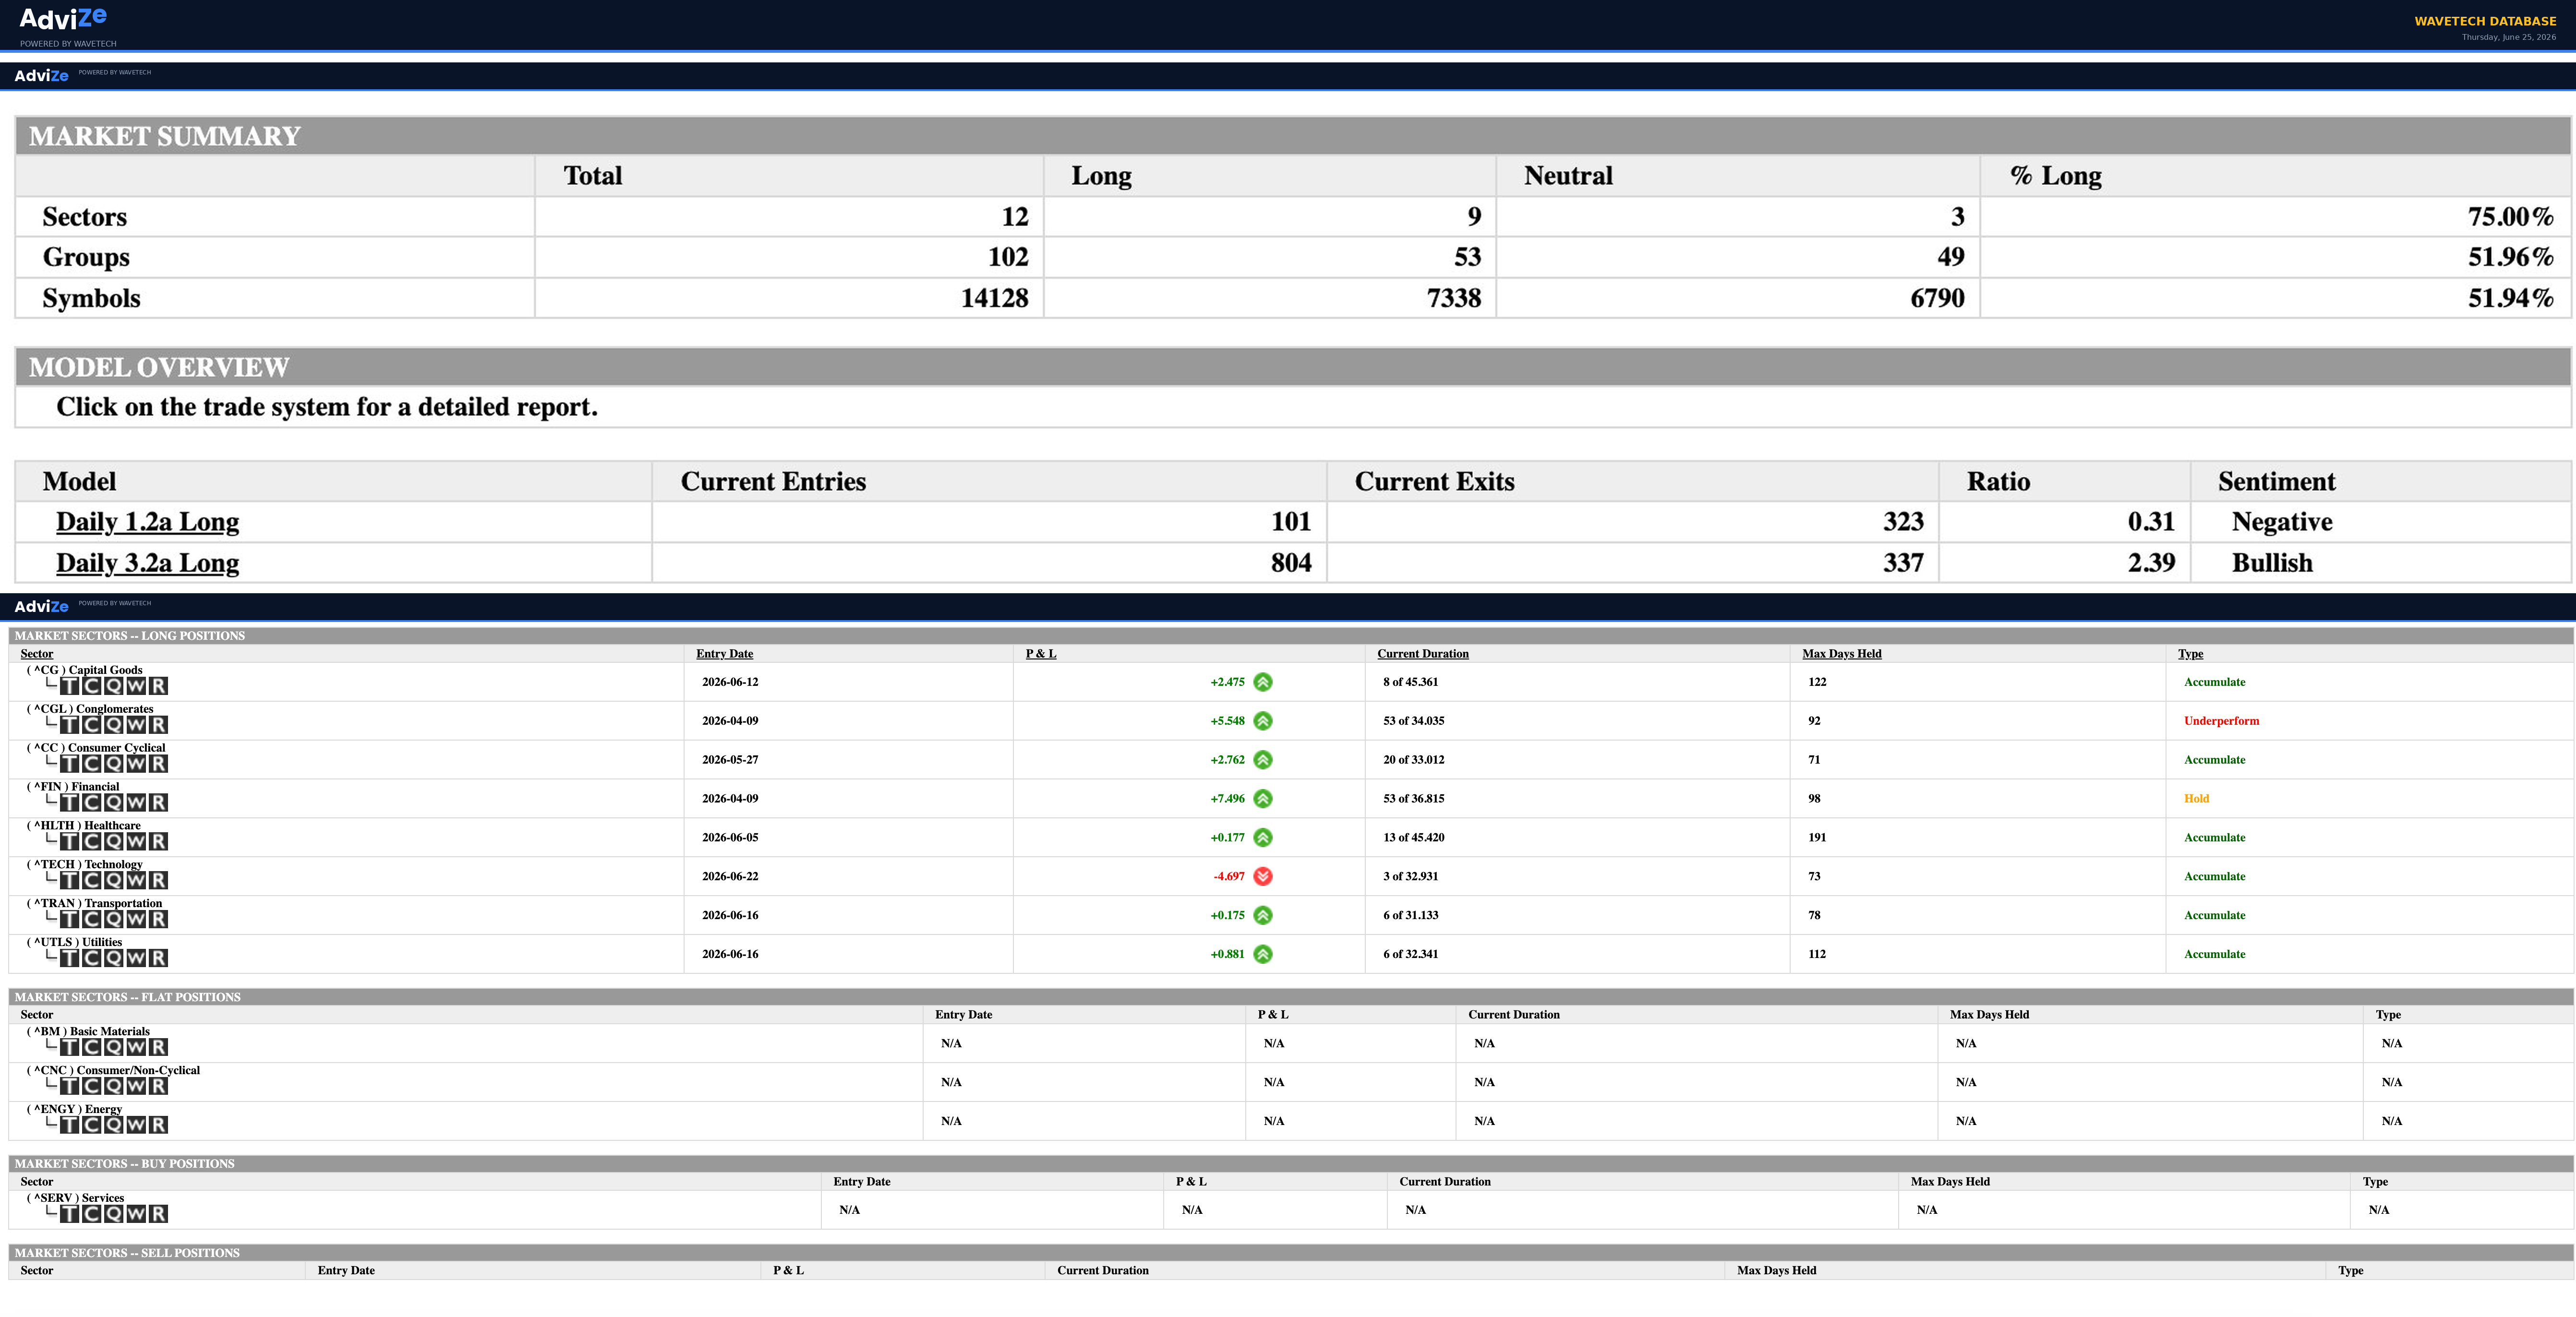
The database comes in on Thursday, sitting right on top of the line that decides everything. At the sector floor, 9 of 12 sectors are positioned long, a reading of 75 percent that sits in full investment territory and tells you the top of the house is still constructive. Drop down to the group floor, and the picture cools fast, with 53 of 102 groups long at 51.96 percent, right inside the resistance band where the market tends to stall and argue with itself. The symbol floor mirrors it almost exactly at 51.94 percent, 7338 of 14128 symbols long. That alignment of groups and symbols just above the 42 percent dividing line, with sectors much stronger overhead, is the textbook signature of a top-down rotation. Conviction is living at the sector level and has not yet been confirmed by broad symbol participation, which is the structural caution flag worth respecting heading into the session.
The daily models split the same way they have all week. The Daily 1.2a Long model shows 101 new entries against 323 exits, a ratio of 0.31 that reads clearly Negative as positions get closed faster than they open. The Daily 3.2a Long model runs the other direction at 804 entries against 337 exits, a ratio of 2.39 that reads Bullish. That divergence between the faster and slower models is the tension in miniature: the short-cycle engine is shedding risk while the longer-cycle engine keeps accumulating. It is the same cautious upside bias the instrument sheets are carrying, and it is why I keep coming back to the 48 percent level as the number that decides whether this rotation holds or starts to leak.
Across the active sector longs, the leaders are Financial at plus 7.496 and Conglomerates at plus 5.548, though both now carry a warning. Financial, entered April 9 and held 53 of an expected 36.815 day cycle, is well past its 64 percent rotation window and classified Hold, an elevated exit candidate despite the strong gain. Conglomerates, also entered April 9 and held 53 of 34.035 days, is the furthest extended of all and classified Underperform, the clearest rotation-out candidate in the book. Consumer Cyclical at plus 2.762 sits at roughly 61 percent of its cycle, approaching its own window. The fresher Accumulate names have room to grow: Capital Goods at plus 2.475, Utilities at plus 0.881, Transportation at plus 0.175, and Healthcare at plus 0.177 are all early in their cycles. Technology, entered just June 22 and down 4.697, is the one red position, brand new and already underwater, which fits the semiconductor vulnerability exactly. Basic Materials, Consumer Non-Cyclical, Energy, and Services sit flat, empty seats waiting to fill if the rotation broadens further.
Premarket
The Monday Compass framed this week as a test of whether the bull structure could hold its highs while momentum cooled, with the weekly rejection off 7599 and the S01 reclaim at 7519.01 named as the make-or-break. This week’s action is sitting right inside that test, and the daily chart is where it resolves first.
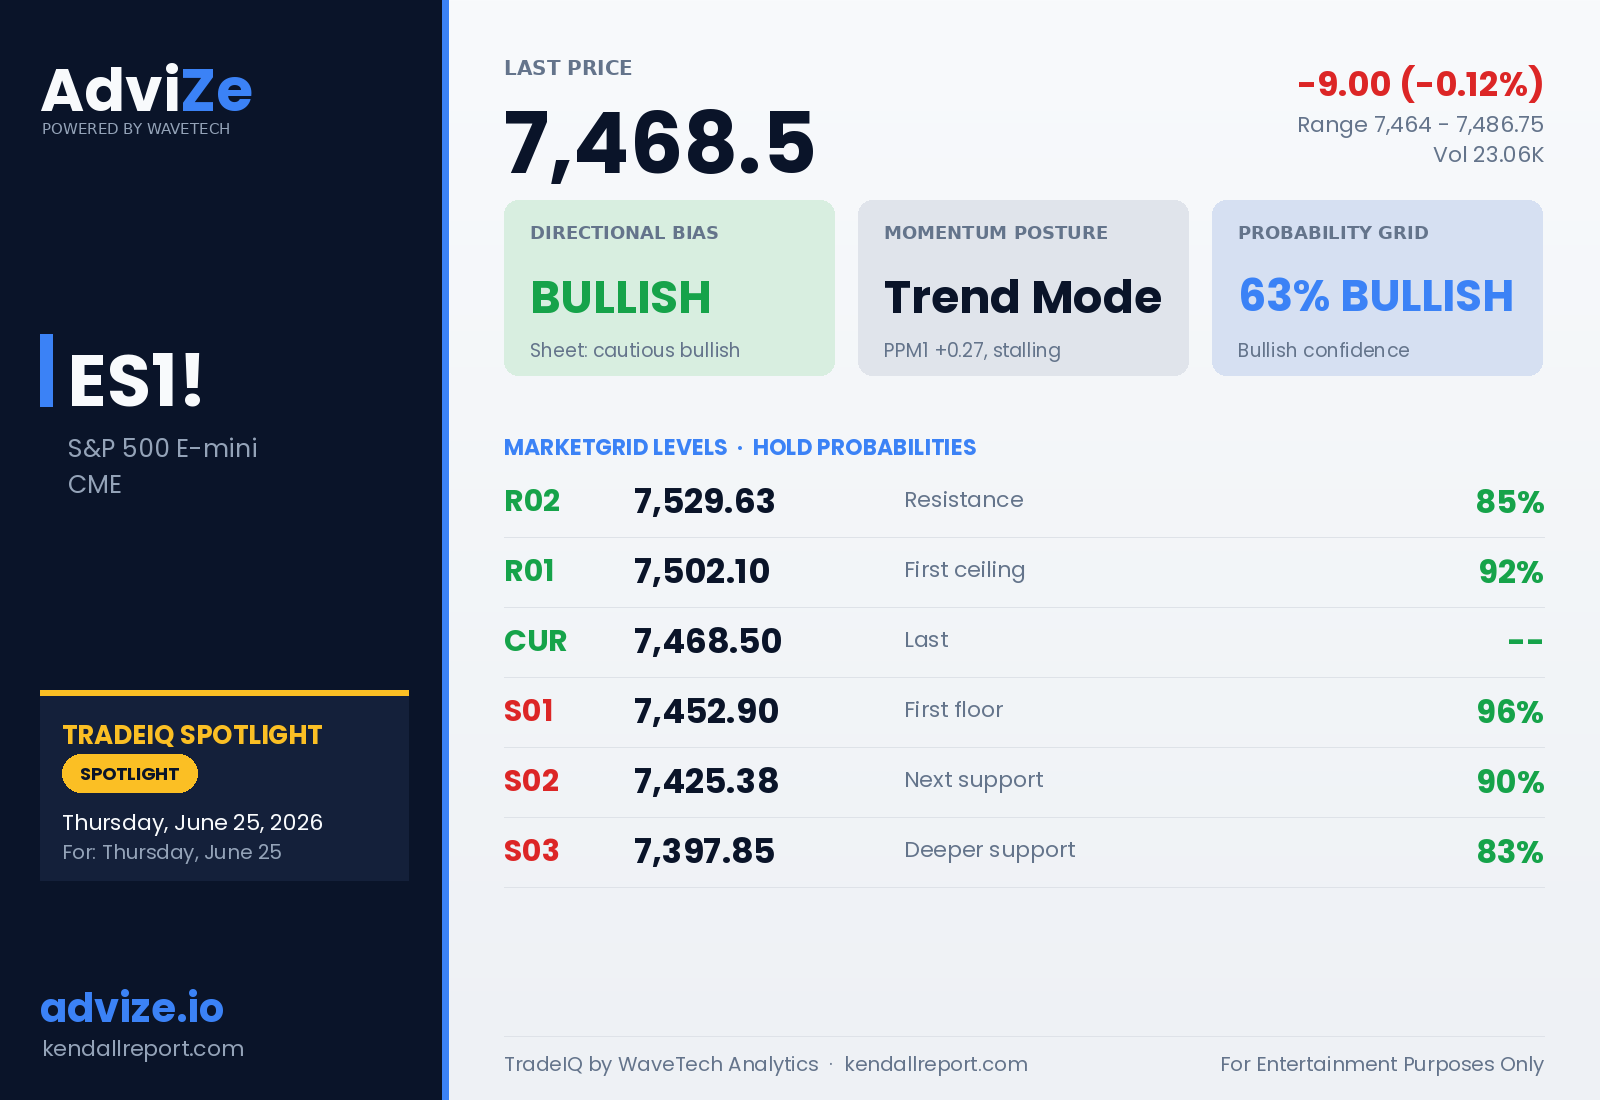
ES comes in at 7468.50, down 9 handles, with an overnight range of 7464 to 7486.75. The tape is digestion, not direction, a narrow candle closing in the lower third that says neither side pressed. The acceleration story is in PPM2, which sits at -0.0404 as the lone negative reading in the stack while its second derivative runs +0.1282, the strongest curl in the chain. That is the single momentum variable that matters here: PPM2 is trying to cross back to zero, and if it does, all four readings align positive. PPM3’s derivatives are building underneath even as the short end cools, the longer-duration momentum quietly gaining curvature. PPM200 sits at +0.0675 above its second derivative at +0.0766 in near-flat constructive stacking, the macro backdrop steady but not pushing. On the MarketGrid, price is wedged between S01 at 7452.90, which held at the 96 percent probability level overnight, and R01 at 7502.10 at 92 percent. The session low of 7464 tested the 3-day WTAR and held, a technically meaningful bounce. Long re-entry above 7502.10 targets R02 at 7529.63, 27 points away at an 85 percent hold, stop below 7452.90 at 7425.38. Risk 16 points, reward 27 points. Trade does not arm while price holds below R01 and PPM2 stays negative.
Spotlight: ES1!
The downside risk I keep flagging in the S&P futures toward 7200 and 7100 expresses itself most directly on ES this week, which is exactly why it is today’s spotlight. The rotation story and the vulnerability story are both live in this one instrument, and the daily chart has them pinned into a 49-point box between S01 at 7452.90 and R01 at 7502.10. That is the cleanest expression of the argument I made up top: a market that is not broken, holding its support, but unable to press its highs while momentum cools underneath.
The pattern read on the daily sheet is a bull flag consolidation pullback after the failure to sustain above R01, with a secondary momentum divergence as PPM1 holds uptrend while PPM2 sits negative. That divergence is the whole ballgame. It typically precedes a resolution move rather than a drift, and the direction of that resolution is what Friday is set up to reveal. The pre-built scenario I am watching is the PPM2 recovery that triggers a multi-level breakout, but I want to be honest that it has not happened yet, and until it does the weight of my macro view leans toward the downside test rather than the upside break.
If S01 at 7452.90 gives way on a closing basis, the path opens toward S02 at 7425.38 and then back toward that 7200 to 7100 zone I have been pointing at, with the 200-day in play if vulnerability keeps building. That is the line that ties this setup back to the week’s larger argument. The rotation underneath can stay healthy while the index itself does some downside work, and ES is where I will be watching that play out first.
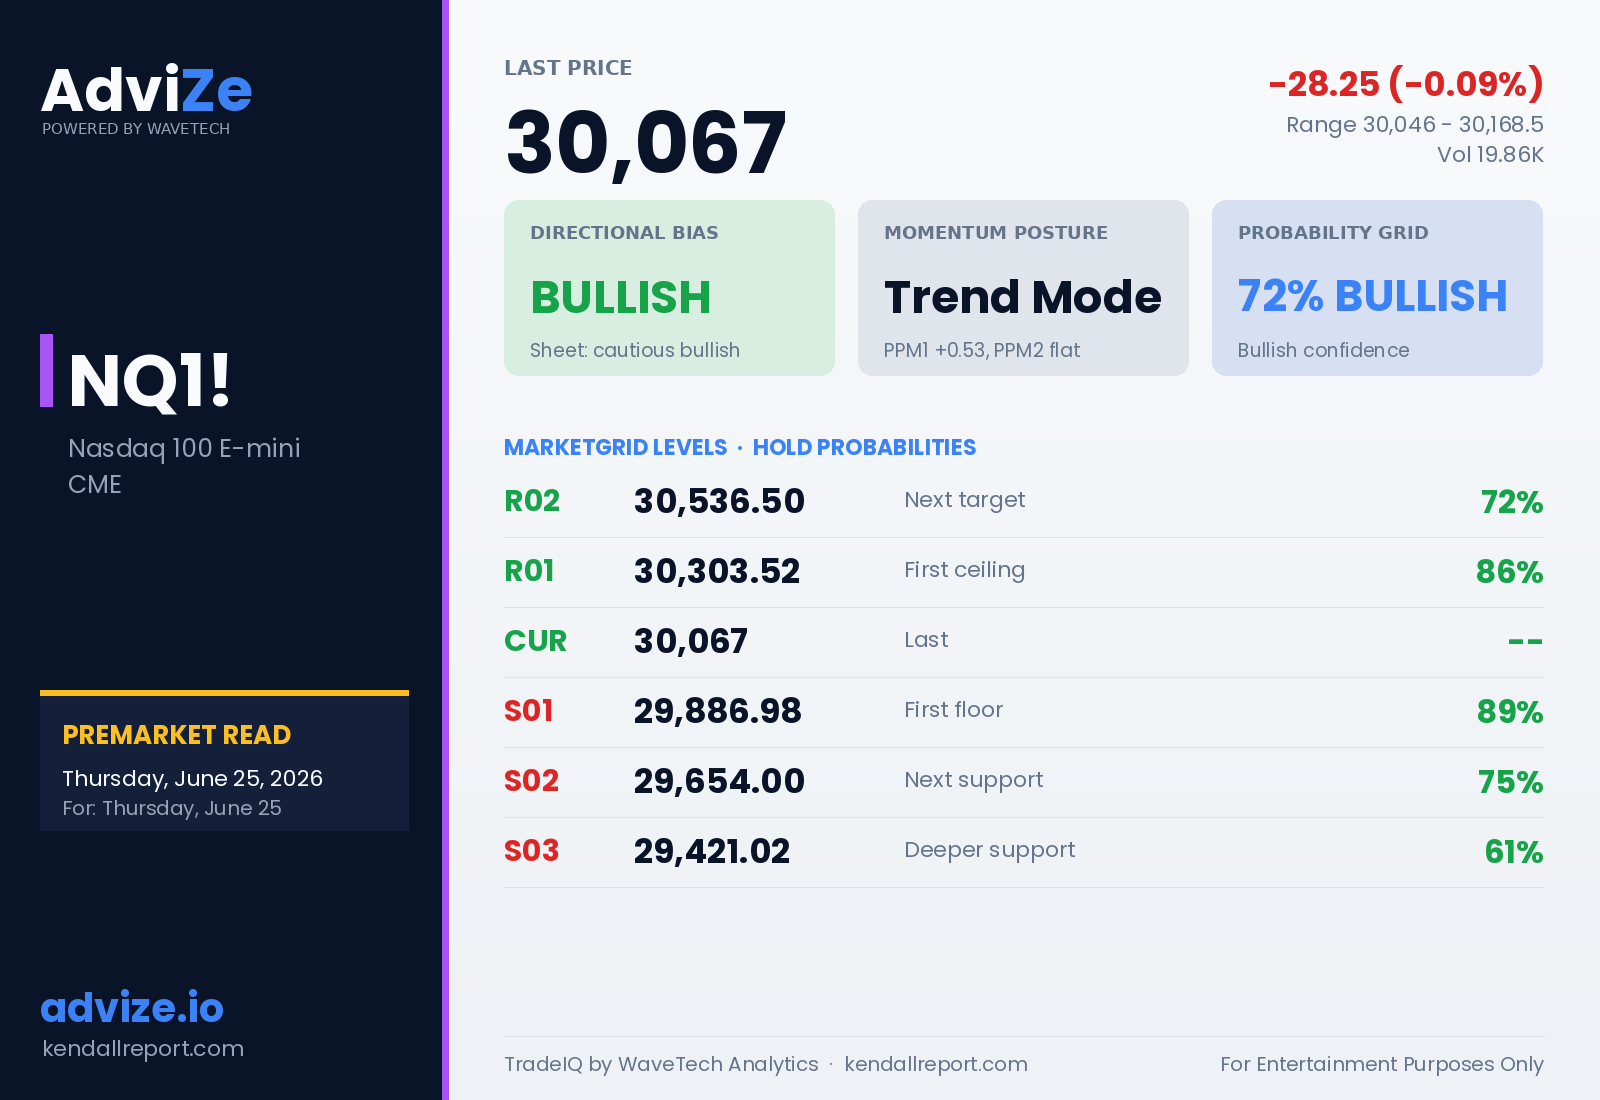
NQ premarket sits at 30067, down a quiet 0.09 percent, overnight range 30046 to 30168.5. The tape is compression, a narrow 122-point candle closing in the lower third that reads as distribution pressure rather than accumulation, with price coiled between S01 and R01. The acceleration tell is PPM2, which has collapsed to +0.0035, essentially flat, the sharpest deceleration in the chain even as its second derivative at +0.2784 hints it is trying to bottom. That near-zero intermediate read is the divergence that governs the tactical picture, because PPM1 remains strong at +0.5313 in clear uptrend while the middle of the stack has stalled out. PPM3 carries the strongest derivative acceleration with its second derivative at +0.4297, structural curvature still building underneath. PPM200 sits in maintenance at +0.1185 with its second derivative marginally above its first, a slow positive drift in the macro backdrop. This is the semiconductor and mega-cap vulnerability I keep flagging, showing up directly in the tape that carries those names. On the MarketGrid, R01 at 30303.52 is the ceiling the daily chart must clear at an 86 percent hold, with S01 at 29886.98 as the line in the sand at 89 percent. Long on a daily close above 30303.52 targets R02 at 30536.50, 233 points away at a 72 percent hold, stop below 29886.98. Risk 180 points, reward 233 points. Trade stays unarmed while PPM2 sits pinned near zero and price holds below R01.
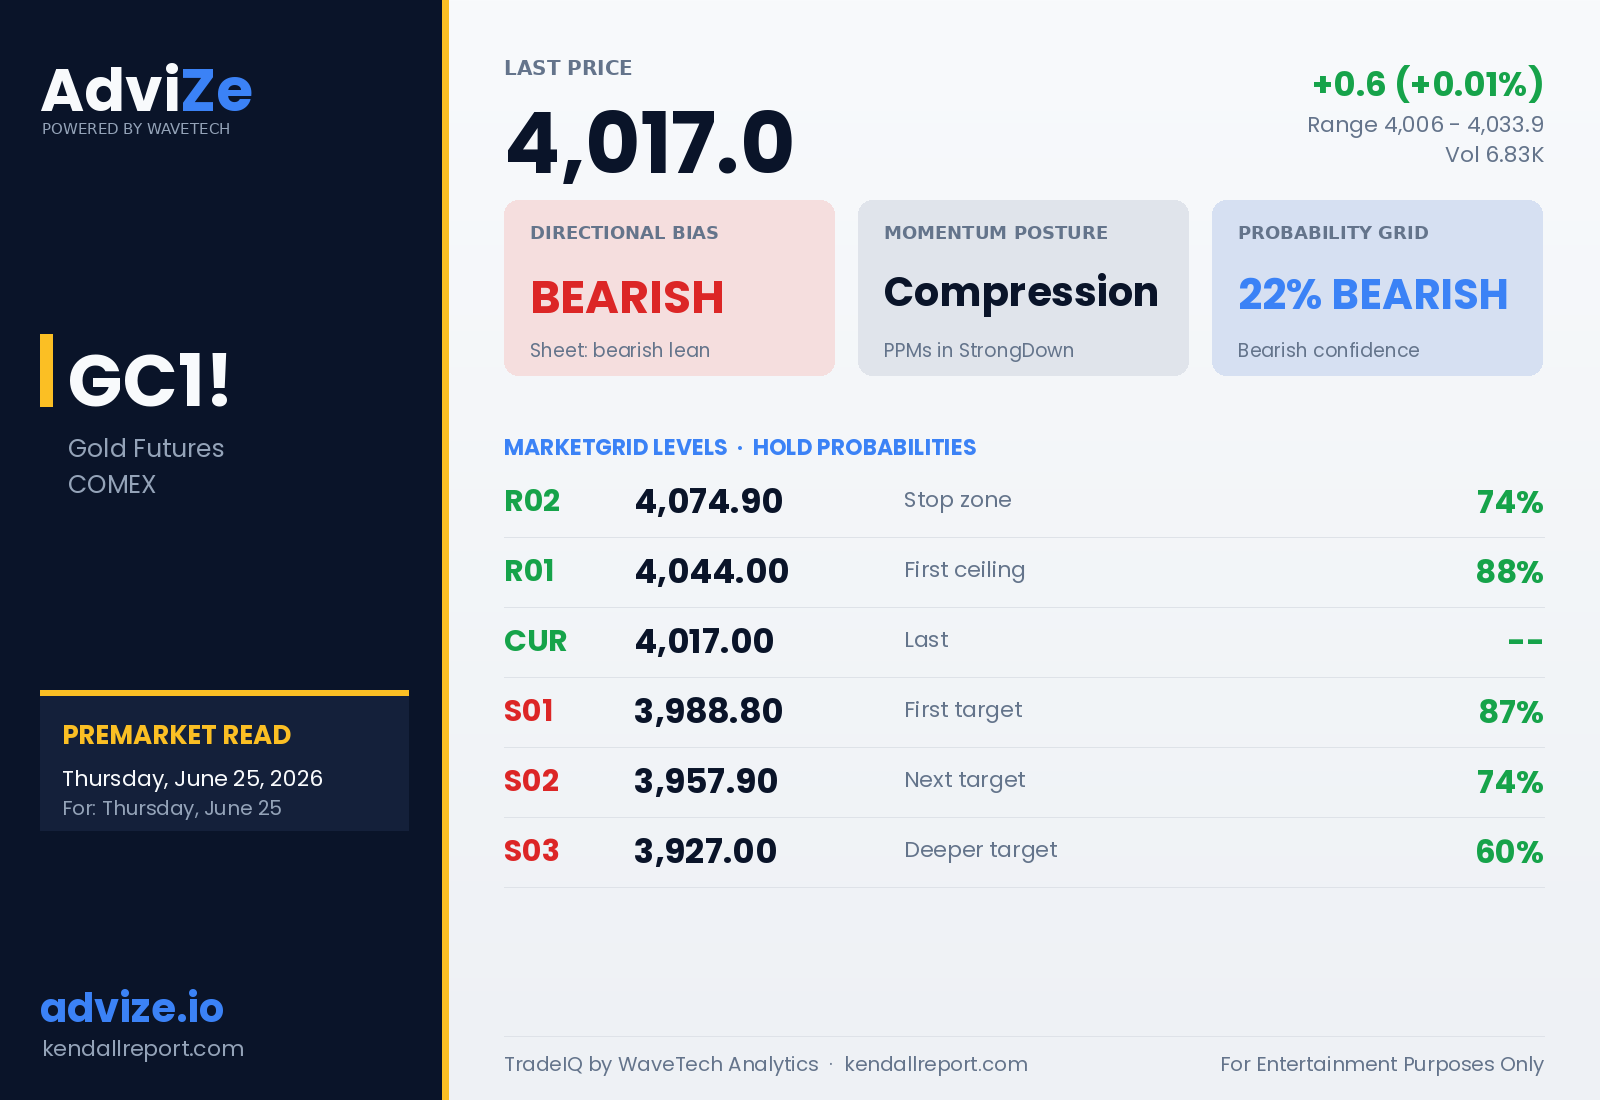
Gold comes in at 4017, dead flat at plus 0.01 percent, overnight range 4006 to 4033.9. The tape is a dead-cat consolidation, a narrow 27.9-point indecision candle that reflects exhaustion without reversal, bears resting rather than retreating. The acceleration story is unambiguous and it is negative: every short-term PPM is pointed down with the derivative chain confirming the move rather than fading it. PPM1 at -0.1833 carries a first derivative of -0.4972 already through the StrongDown threshold, and PPM2 is the most damaged at -0.5379 with all three readings in StrongDown. There is no deceleration signal here yet, which is the point. The one bright spot is PPM200, still positive at +0.038 with both derivatives rising, the lone structural holdout sitting above its second derivative in constructive stacking even as the short end falls apart. That is the disagreement worth naming: the macro trend has not broken, but it offers cold comfort against a short and medium stack this damaged. On the MarketGrid, price is sandwiched 27 points below R01 at 4044 and 28 points above S01 at 3988.80, which holds at the 87 percent level. Short below 4044 targets S01 at 3988.80, roughly 28 points away at an 87 percent hold, stop above R02 at 4074.90. Risk 31 points, reward 28 points. Trade does not arm if price reclaims 4044 on a closing basis with PPM1’s second derivative crossing back above -0.25.
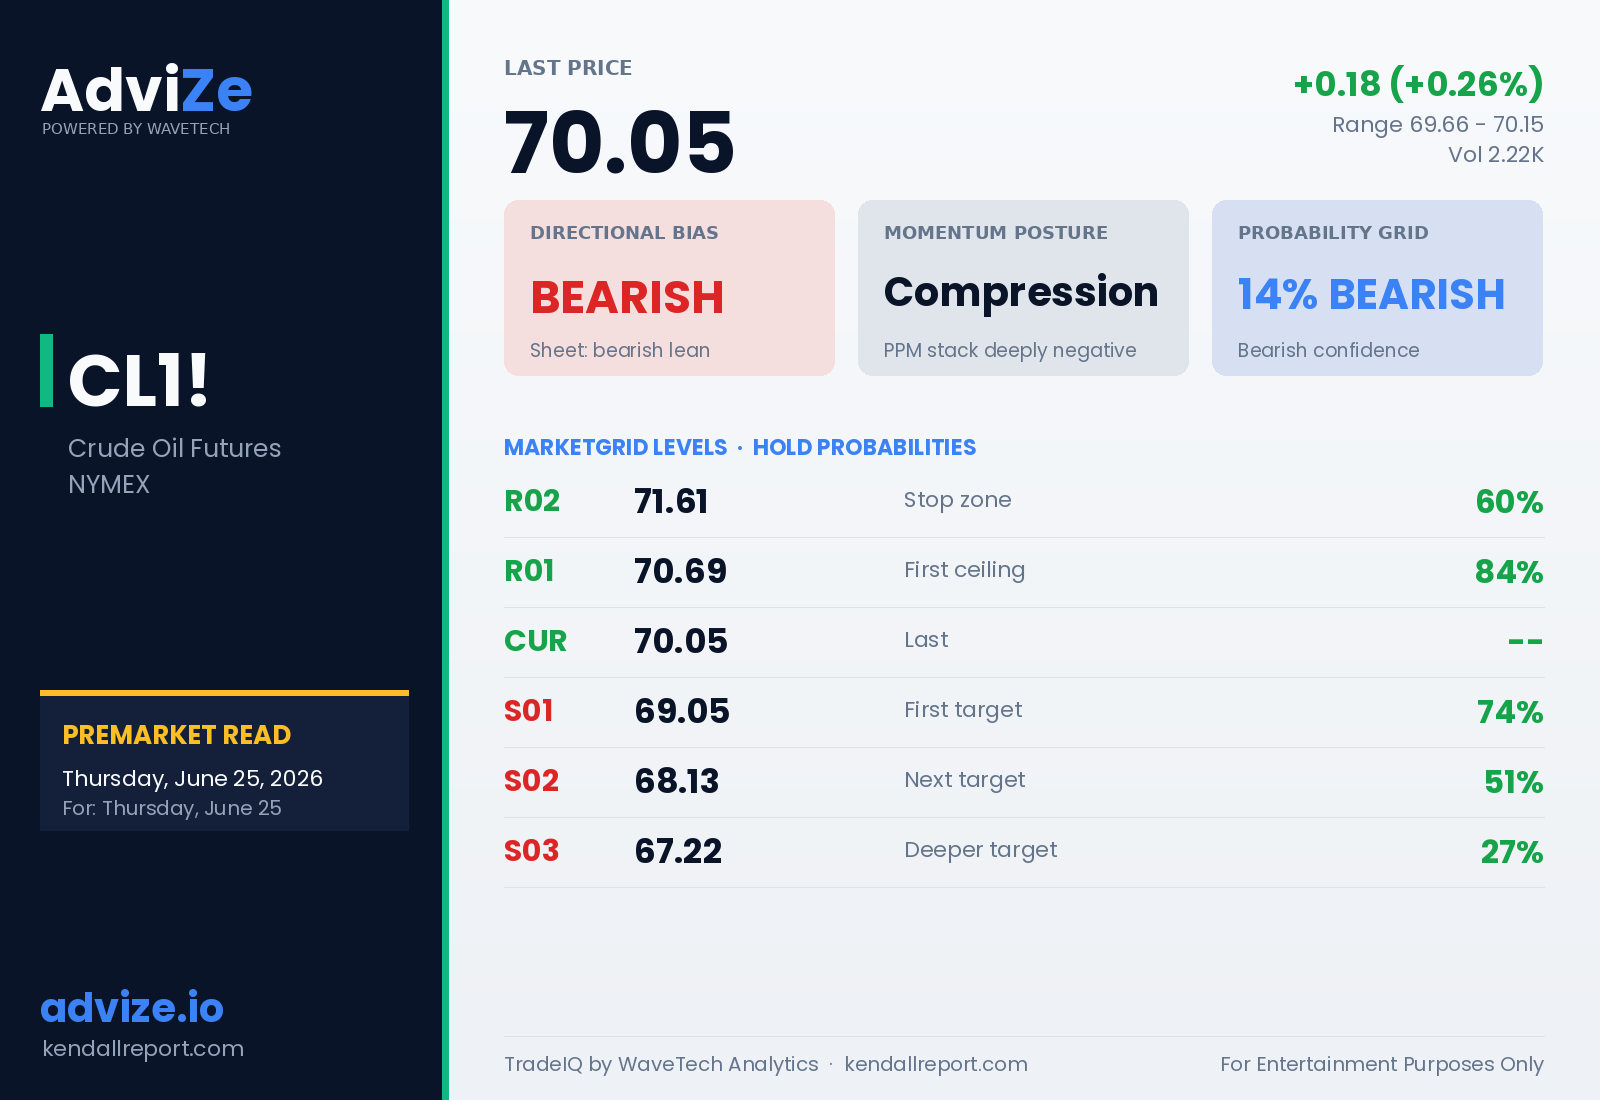
Crude premarket is 70.05, up 0.26 percent on the session, overnight range 69.66 to 70.15. The tape is an extremely compressed bear flag, a 49-cent range coiling between support and resistance after a prolonged downtrend, the kind of energy compression that historically precedes a 2 to 3 times range expansion. The acceleration read is the most negative in the book, with all four trend PPMs deeply negative: PPM1 at -2.767, PPM2 at -1.3123, PPM3 at -0.7971. The primary timeframe derivatives are still accelerating lower, the first derivative at -1.7396 and second at -0.8013, so there is no exhaustion yet on the front of the stack. The one flicker worth monitoring is at the back: PPM200 sits barely positive at +0.0515 with both derivatives positive and climbing, sitting above its second derivative in the only constructive stacking on the sheet. That longest-horizon curl is the first faint precursor to a bottoming process, though emphatically not a reversal signal. The collapse in crude is the same one driving the disinflation read I led with up top. On the MarketGrid, price sits between R01 at 70.69 at an 84 percent hold and S01 at 69.05 at 74 percent, with a dense resistance confluence at 70.69 to 70.94. Short on a failed test of 70.69 targets S01 at 69.05, roughly 1 dollar away at a 74 percent hold, stop above R02 at 71.61. Risk 1.56, reward 1.00. Trade stays unarmed if price closes above 70.69 with PPM1’s second derivative crossing above zero.
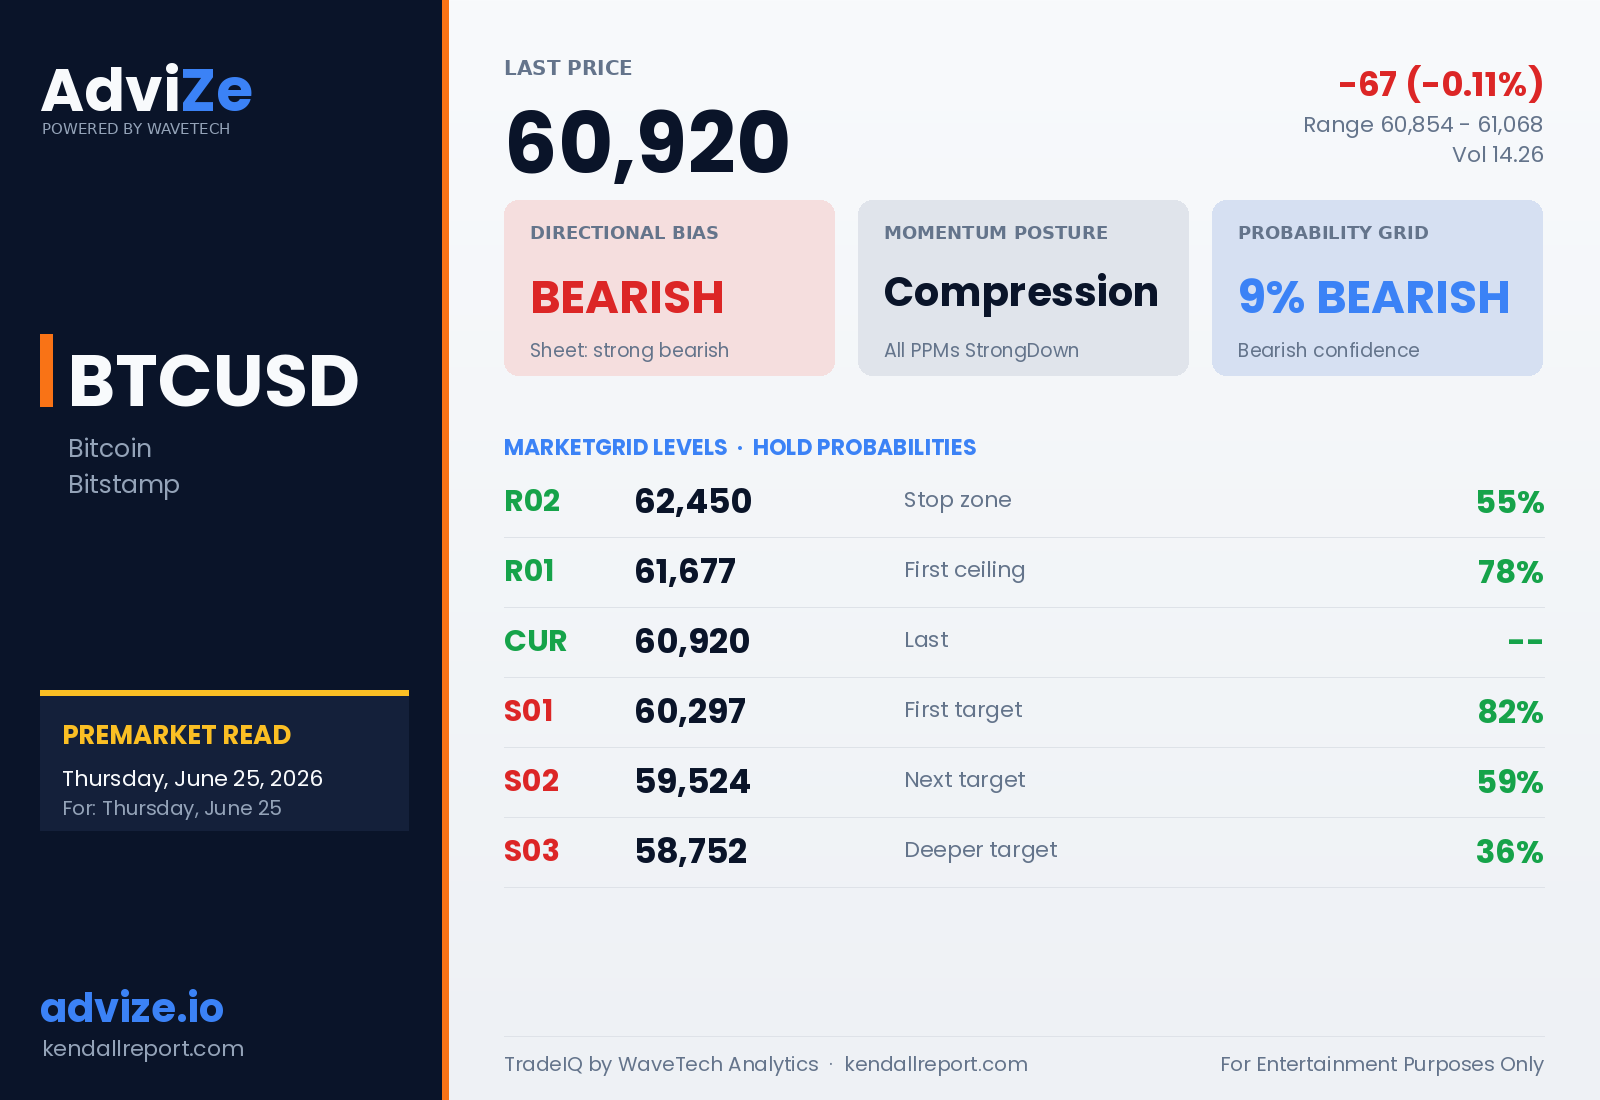
Bitcoin premarket is 60920, down 0.11 percent, overnight range 60854 to 61068. The tape is a bearish momentum cascade with a compressed 214-point candle that signals a directional resolution is near, and the odds favor the downside. The acceleration story is the most synchronized bearish read across the five instruments: all four PPM readings negative with no divergence anywhere to anchor a counter-trade. PPM1 at -0.8392 is deep in StrongDown, and the detail that matters is its second derivative at -0.7281, meaning the rate of deterioration is itself accelerating rather than flattening. PPM2’s derivative pair is the most aggressive in the chain, the first at -0.5677 and second at -0.8321. Even PPM200 has rolled over, both derivatives negative and sitting below its second derivative, so unlike crude and gold there is no structural holdout here. The macro backdrop is confirming the bear rotation rather than fighting it, which is what separates this read from the other negatives in the book. On the MarketGrid, price closed 757 points below R01 at 61677 without an intraday attempt to reclaim it, and S01 at 60297 is the session trigger at an 82 percent hold. Short on a daily close below 60297 targets S02 at 59524, roughly 623 points below the trigger at a 59 percent hold, stop above R01 at 61677. Risk 757 points, reward 773 points. Trade stays unarmed while price holds above S01 and PPM1’s first derivative remains above its current level without turning back toward zero.
Robert Kendall
Chief Analyst
Disclaimer for “The Kendall Report”
The information provided in “The Kendall Report” is for general informational and educational purposes only. The opinions, analyses, and forecasts included in this newsletter are based on the author’s personal views and experiences and are provided as is without warranty of any kind.
While we strive to provide accurate and up-to-date information, we do not guarantee the accuracy, completeness, reliability, or timeliness of any information contained in this newsletter. The information presented should not be construed as financial, investment, legal, or other professional advice. It does not constitute a recommendation or endorsement of any particular investment strategy, financial instrument, product, or service.
Investors should consider their financial situation, objectives, and risk tolerance before making investment decisions based on the information provided. The financial market is subject to high risk and volatility. Past performance is not indicative of future results. Investing in the financial market involves the risk of loss, including the loss of principal.
“The Kendall Report” and its contributors will not be liable for any direct, indirect, incidental, consequential, or exemplary damages arising from the use or inability to use the information provided in this newsletter, including but not limited to losses or missed gains.
By accessing and using “The Kendall Report,” you acknowledge and agree to this disclaimer and assume full responsibility for the use of the information provided. We reserve the right to make changes to the content of this newsletter at any time without notice.
This disclaimer is subject to change at our discretion, and it is the reader’s responsibility to review it regularly for any updates.