
"Santa Claus Rally Loading: All Patterns Point One Direction"
Free Edition!

KR Opinion
As we conclude this week’s trading activity, the markets delivered exactly the kind of action that supports the broader thesis I’ve been developing. The overnight session experienced a significant selloff that caused a sharp reversal, effectively testing the lower boundary of the trading range I’ve been discussing, around the 21-day and 40-day moving averages. We nearly touched those levels before buyers stepped in assertively, and by the close, markets had reversed course and finished higher for the day.
What made this session particularly interesting was the breadth of the reversal. Metals caught a bid and moved higher. Equities across most sectors participated in the recovery. The one notable exception was the NASDAQ, which faced pressure from Oracle’s weakness and ended the day in the red. This kind of divergence within the indexes highlights the rotation and diversity of participation beneath the surface, but the overall message remains consistent with what I’ve emphasized for weeks. The general trend is sideways to up, and we continue to maintain an upward bias as we approach the final stretch of the year.
Looking at the calendar, we have about six to eight days of meaningful trading remaining. Next week will essentially be the last week of active market participation for 2025, even though the final days of December will include some book-balancing and housekeeping trades. This means we’re entering a seasonal period where markets tend to follow established trend lines with a slight upward bias, and there isn’t enough time or enough catalysts to significantly change the course we’ve set.
This week's technical achievement was notable. We finally hit new all-time highs on both the S&P 500 and the Dow Jones Industrial Average for the first time this cycle. The indexes are breaking through the upper boundaries of their recent ranges and reinforcing that upward bias I keep pointing out. Meanwhile, everything else has normalized and settled into a holding pattern. We’re not seeing any dramatic moves in either direction, which perfectly aligns with the sideways, choppy range that has characterized price action since September. Despite the choppy trading, we’ve managed to reach several new highs as we’ve worked through this consolidation, indicating the underlying strength of the market structure.
I was genuinely impressed by the market’s resilience yesterday. From the moment the US session opened, buyers steadily pushed prices higher throughout the entire trading day. There was no dramatic reversal or sudden catalyst, just consistent accumulation that moved us back toward the highs. The short-term database I follow has been steadily climbing and gaining momentum, and my expectation heading into Friday’s run on the intermediate models is that we will not only sustain current bullish readings but possibly increase them. The forward-looking indicators are aligning well as we approach year-end and start positioning for the opening months of 2026.
On the economic front, the Atlanta Fed’s GDPNow estimates indicate growth in the 3.5 to 3.6 percent range, which I will discuss in detail in the annual report released over the next few weeks. The productivity story is becoming impossible to ignore, and I believe we are finally going to see how much these productivity gains can accelerate GDP growth. This will be a major theme in the coming year. We are seeing trillions of dollars in capital expenditure investments flowing into the economy. When you consider the productivity revolution accompanying this spending, it becomes very difficult to imagine any truly adverse economic scenario.
Of course, the market keeps convincing itself that some form of quantitative easing is imminent, citing the roughly $ 40 billion in short-term Treasury purchases as evidence. I want to be clear that this is not QE, despite what many market participants claim. These are routine operations in short-duration instruments, not the kind of balance sheet expansion seen in previous rounds of genuine quantitative easing. The distinction matters because it influences expectations around liquidity conditions and risk asset performance.
Speaking of liquidity narratives, Bitcoin is finally showing some stability after recent volatility. There’s been considerable chatter suggesting that PMI readings, liquidity injections, and supposed Fed QE will send Bitcoin soaring higher. I’ll cover this in detail in the annual report, but the data actually indicates that significant supply has accumulated in the market. As I mentioned in the special report pinned at the top of my Substack newsletter, price discovery in Bitcoin is currently driven by a very small percentage of participants. There’s potential for further accumulation to enter the market, but we’re a long way from any major rallies. The setup calls for patience rather than urgency for those watching the crypto space.
As we wrap up this week and look ahead to what’s left of the year, expect markets to transition into end-of-year rotation mode. The Santa Claus rally everyone mentions will form over the next few days, and all the patterns I’m observing indicate a bullish trend. The combination of technical support, seasonal tailwinds, and strategic positioning suggests we will drift higher into year-end, with trend lines remaining solid.
WaveTech Database
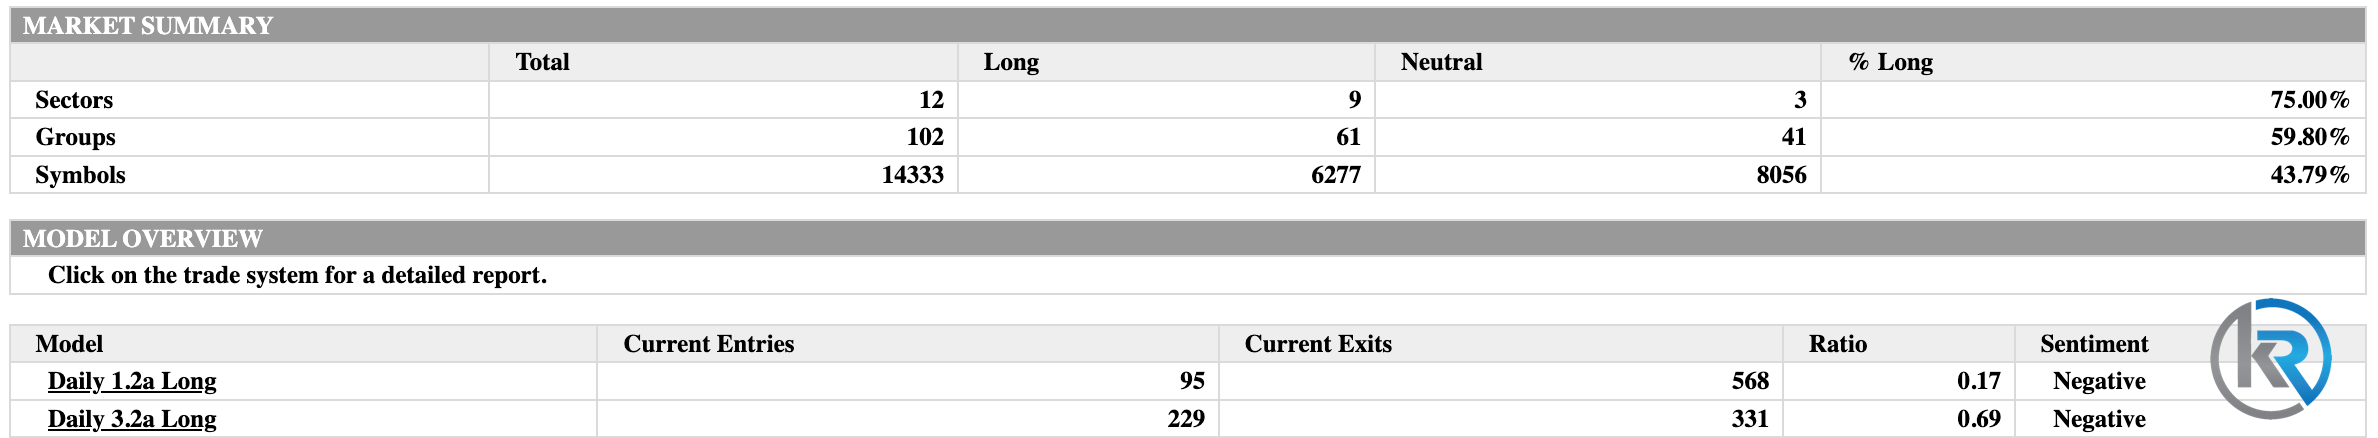
The WaveTech Database currently shows a market at a critical turning point, with hierarchical positioning data indicating a notable divergence pattern that warrants careful attention. At the sector level, the database indicates that 9 of 12 sectors are maintaining long positions. At the same time, 3 remain neutral, resulting in a strong 75.00% long reading that clearly puts sector-level commitment in full investment mode territory. This high reading usually suggests that institutional confidence stays intact at the macro level. However, the more detailed readings tell a different story that needs further analysis.
Moving down the hierarchy, group-level positioning registers at 59.80% long, with 61 of 102 groups maintaining bullish alignment, while 41 sit neutral. This reading positions groups comfortably above the 58% threshold that typically signals a transition toward full investment parameters, suggesting intermediate-level participation remains constructive but not yet at the 62% level that would confirm full commitment.
The most insightful reading comes from symbol-level data: the WaveTech Database shows only 6,277 of 14,333 tracked symbols maintaining long positions, against 8,056 in neutral territory, resulting in a 43.79% extended reading. This figure just exceeds the critical 42% sustainable bias threshold that separates markets with modest upside potential from those entering liquidation mode. The proximity to this key level indicates that any decline in daily model activity could push the database below 42%, shifting the probability toward correction scenarios targeting 28% and potentially 22%.
The WaveTech models are signaling concerns on the daily timeframe. The Daily 1.2a Long model recorded only 95 new entries compared to 568 exits, resulting in an entry-to-exit ratio of 0.17 with negative sentiment classification. This high exit activity suggests active distribution at the individual security level. The Daily 3.2a Long model shows somewhat better but still unfavorable conditions, with 229 entries versus 331 exits, producing a 0.69 ratio that also indicates negative sentiment. Overall, the daily models registered 324 new entries against 899 exits, indicating persistent net liquidation pressure despite sector-level readings being elevated.
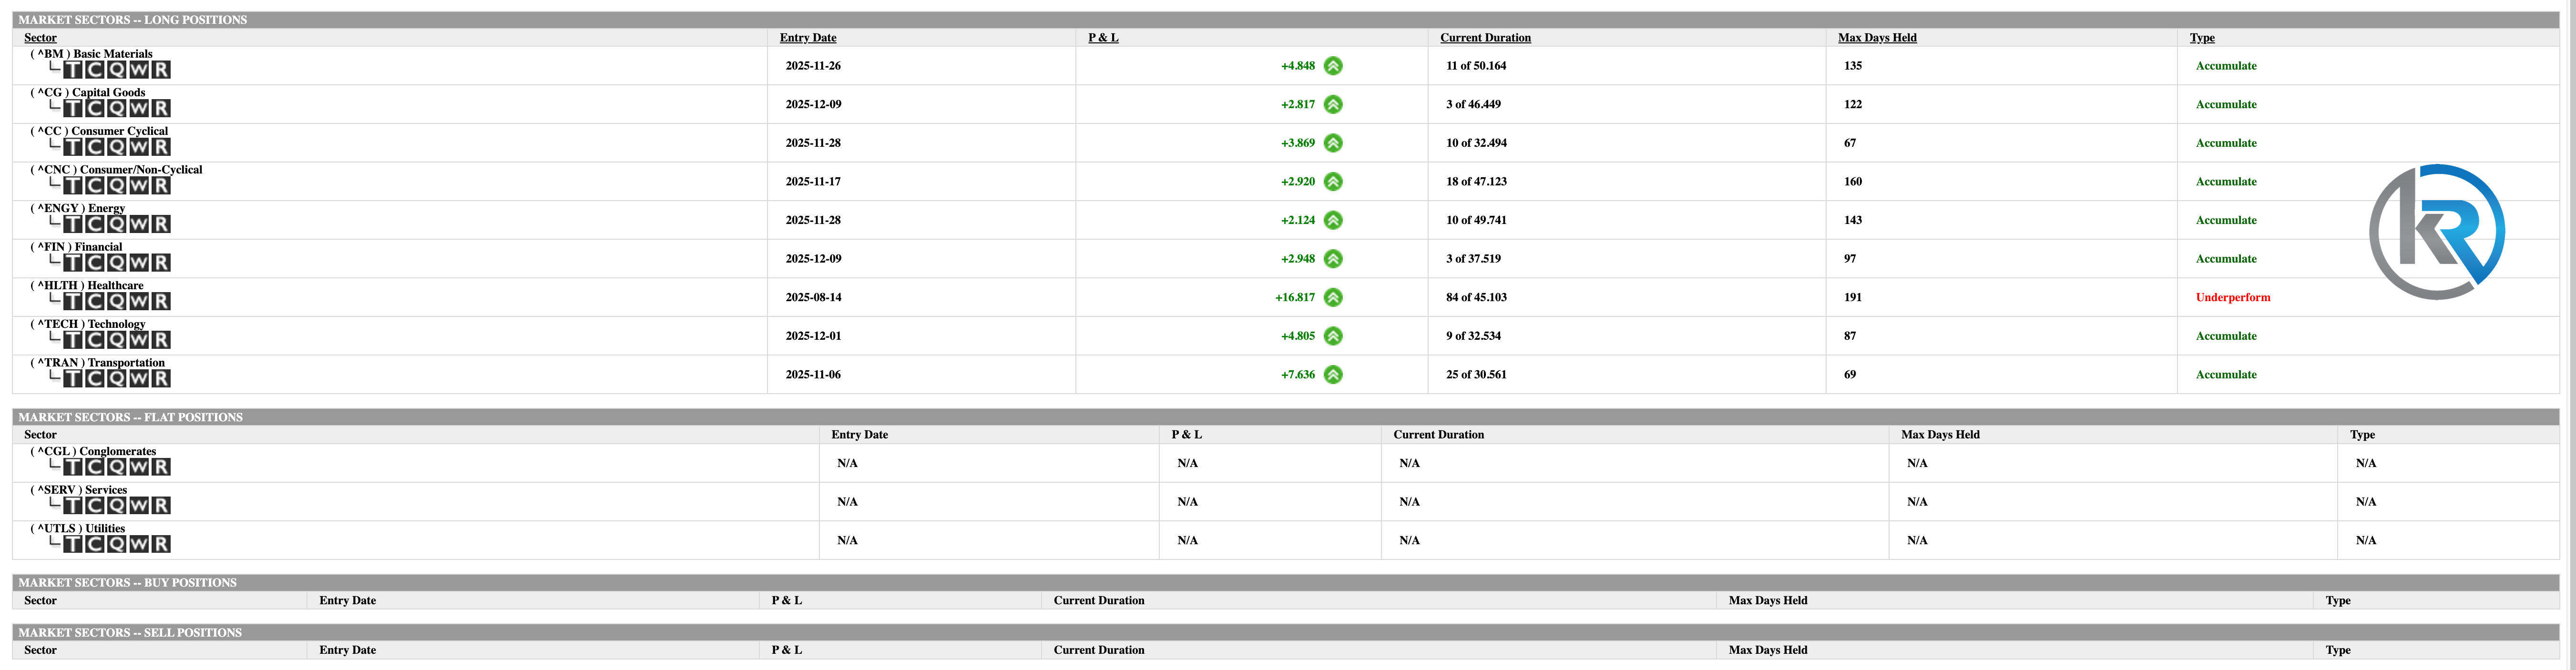
The sector positioning data reveals several positions nearing maturity thresholds that could influence near-term rotation dynamics. Healthcare stands out as the most mature position, having entered on June 14, 2025, and now showing a current duration of 84 days, compared to an average of 45.103 days. This position has already exceeded its statistical maturity window and carries an underperform designation despite gains of 16.817%. The extended duration beyond typical parameters suggests this sector may be a leading candidate for position adjustment or rotation.
Transportation also demands attention from a maturity perspective, with its November 6, 2025 entry now showing 25 days of current duration against an average of 30.561 days. At about 82% through its typical holding period, this sector, which has gained 7.636%, is in a window where historical patterns suggest an increased likelihood of position changes. Similarly, Consumer Cyclical, set to mature on November 28, 2025, shows 10 days of a 32.494-day duration, representing roughly 31% of maturity with a 3.869% gain. It has a reasonable runway but requires monitoring as it approaches the halfway point.
The gap between sector-level positioning at 75% and symbol-level readings at 43.79% shows a significant spread that the WaveTech Database usually warns about. When sectors stay fully committed to investment mode while underlying symbols hover just above the 42% sustainability threshold, the data indicates institutional allocations are still in place, but individual security selection is experiencing notable churn. This situation often resolves either when symbol-level readings increase to confirm sector strength or when sector positioning drops back to match weaker underlying participation.
Given the current daily model ratios showing negative sentiment and total exits significantly exceeding entries, the probability framework favors the latter scenario where the 43.79% symbol reading faces pressure toward the 42% level. If daily model exit activity continues at current levels, a drop below 42% would push the database into liquidation mode, with initial downside targets near the 28% correction zone. Conversely, if daily entries improve and the entry-to-exit ratios move back toward 1.0 or higher, the symbol-level readings could stabilize and potentially rise toward the 52-58% range, indicating broader participation in the ongoing sector strength.
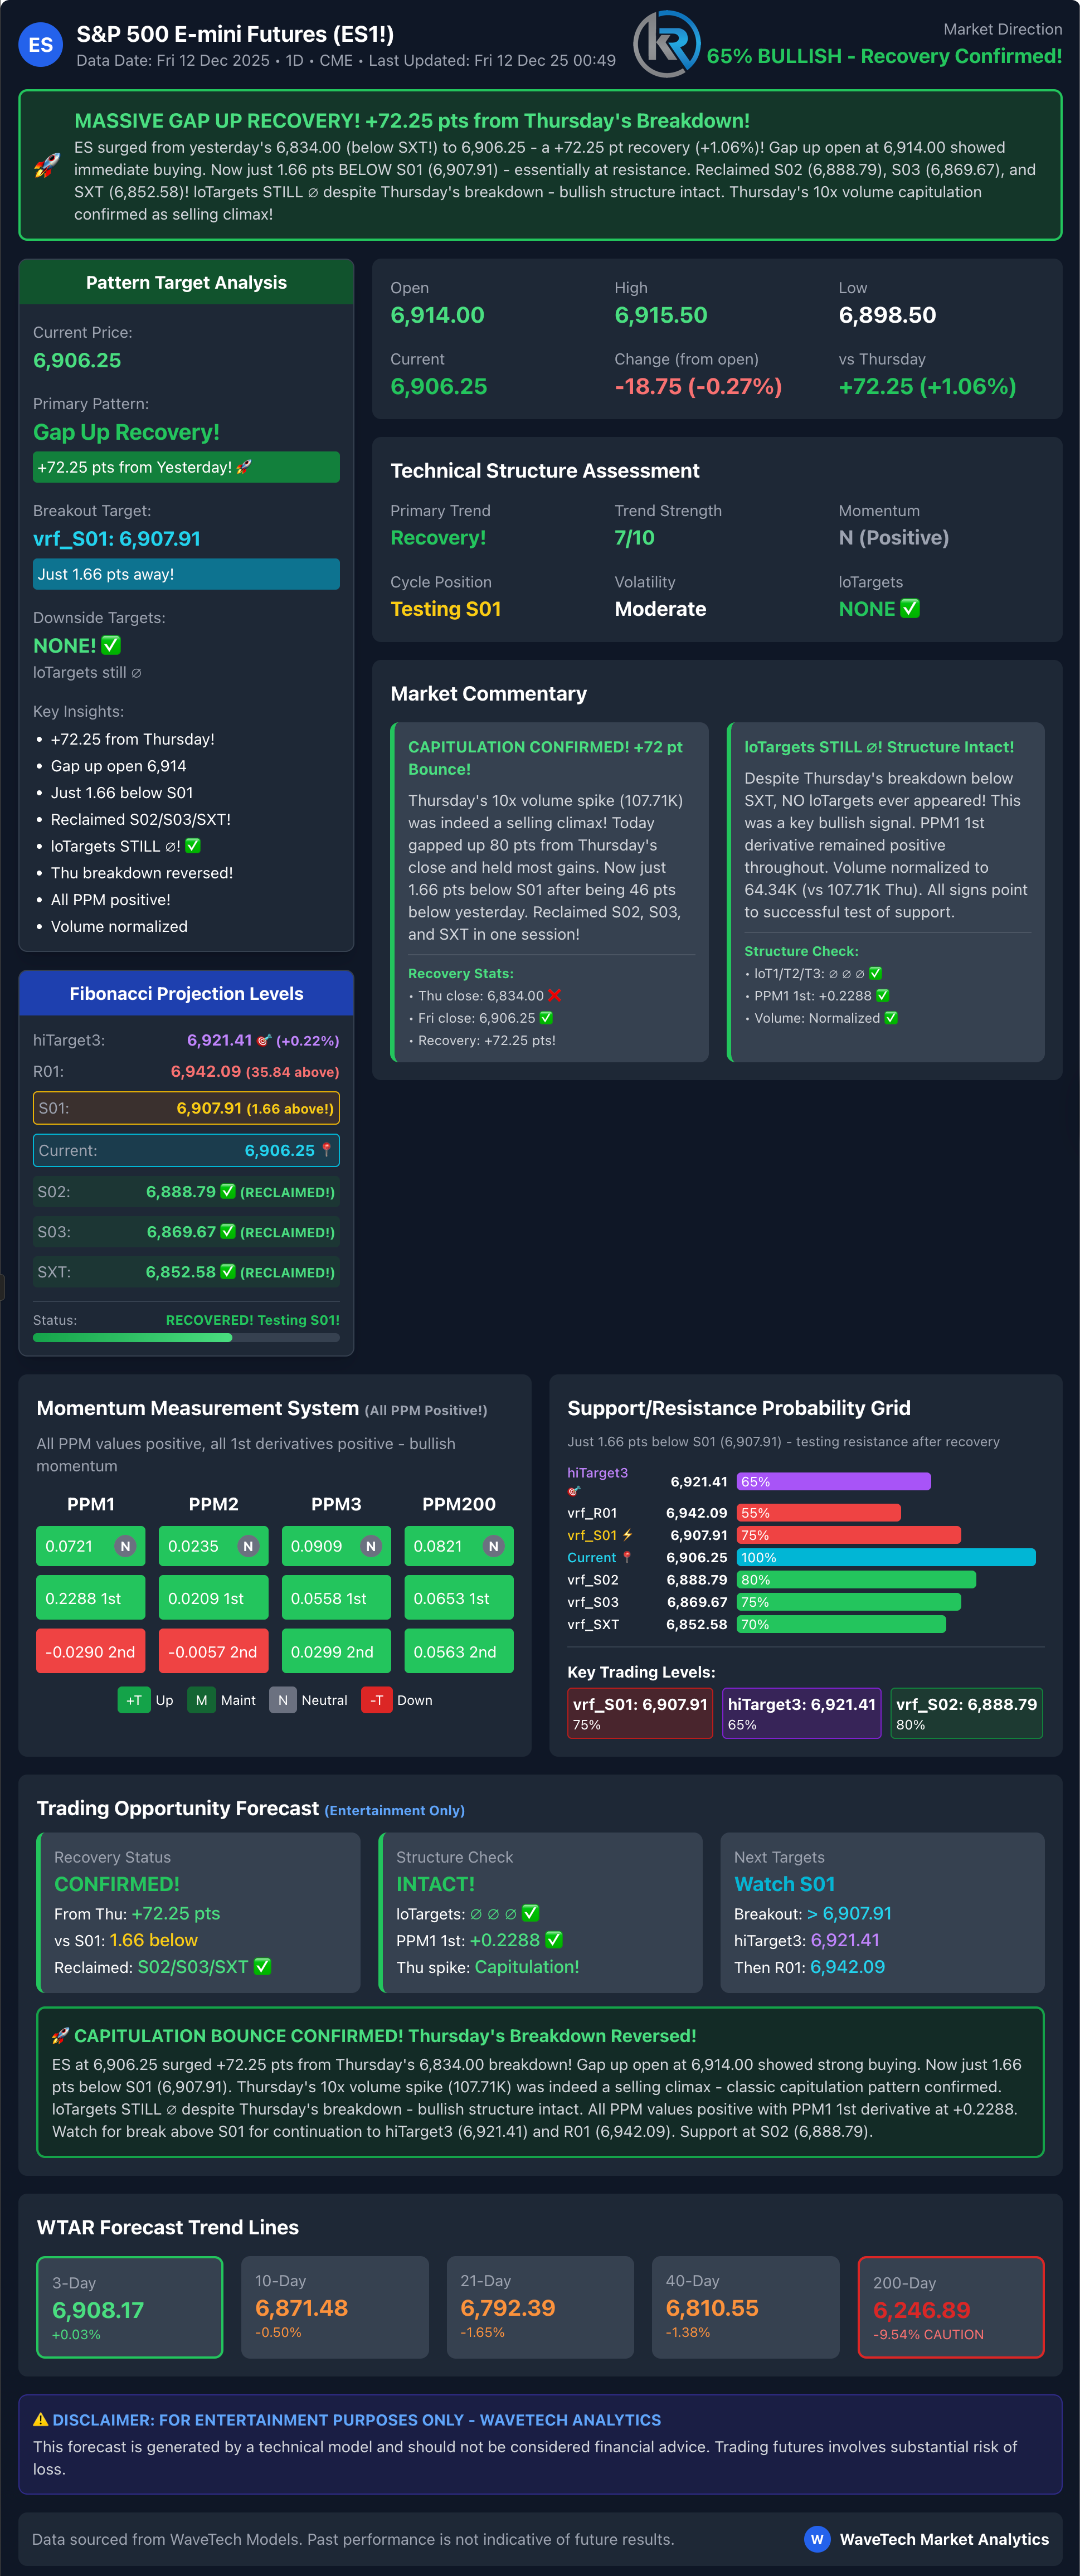
S&P 500 Futures
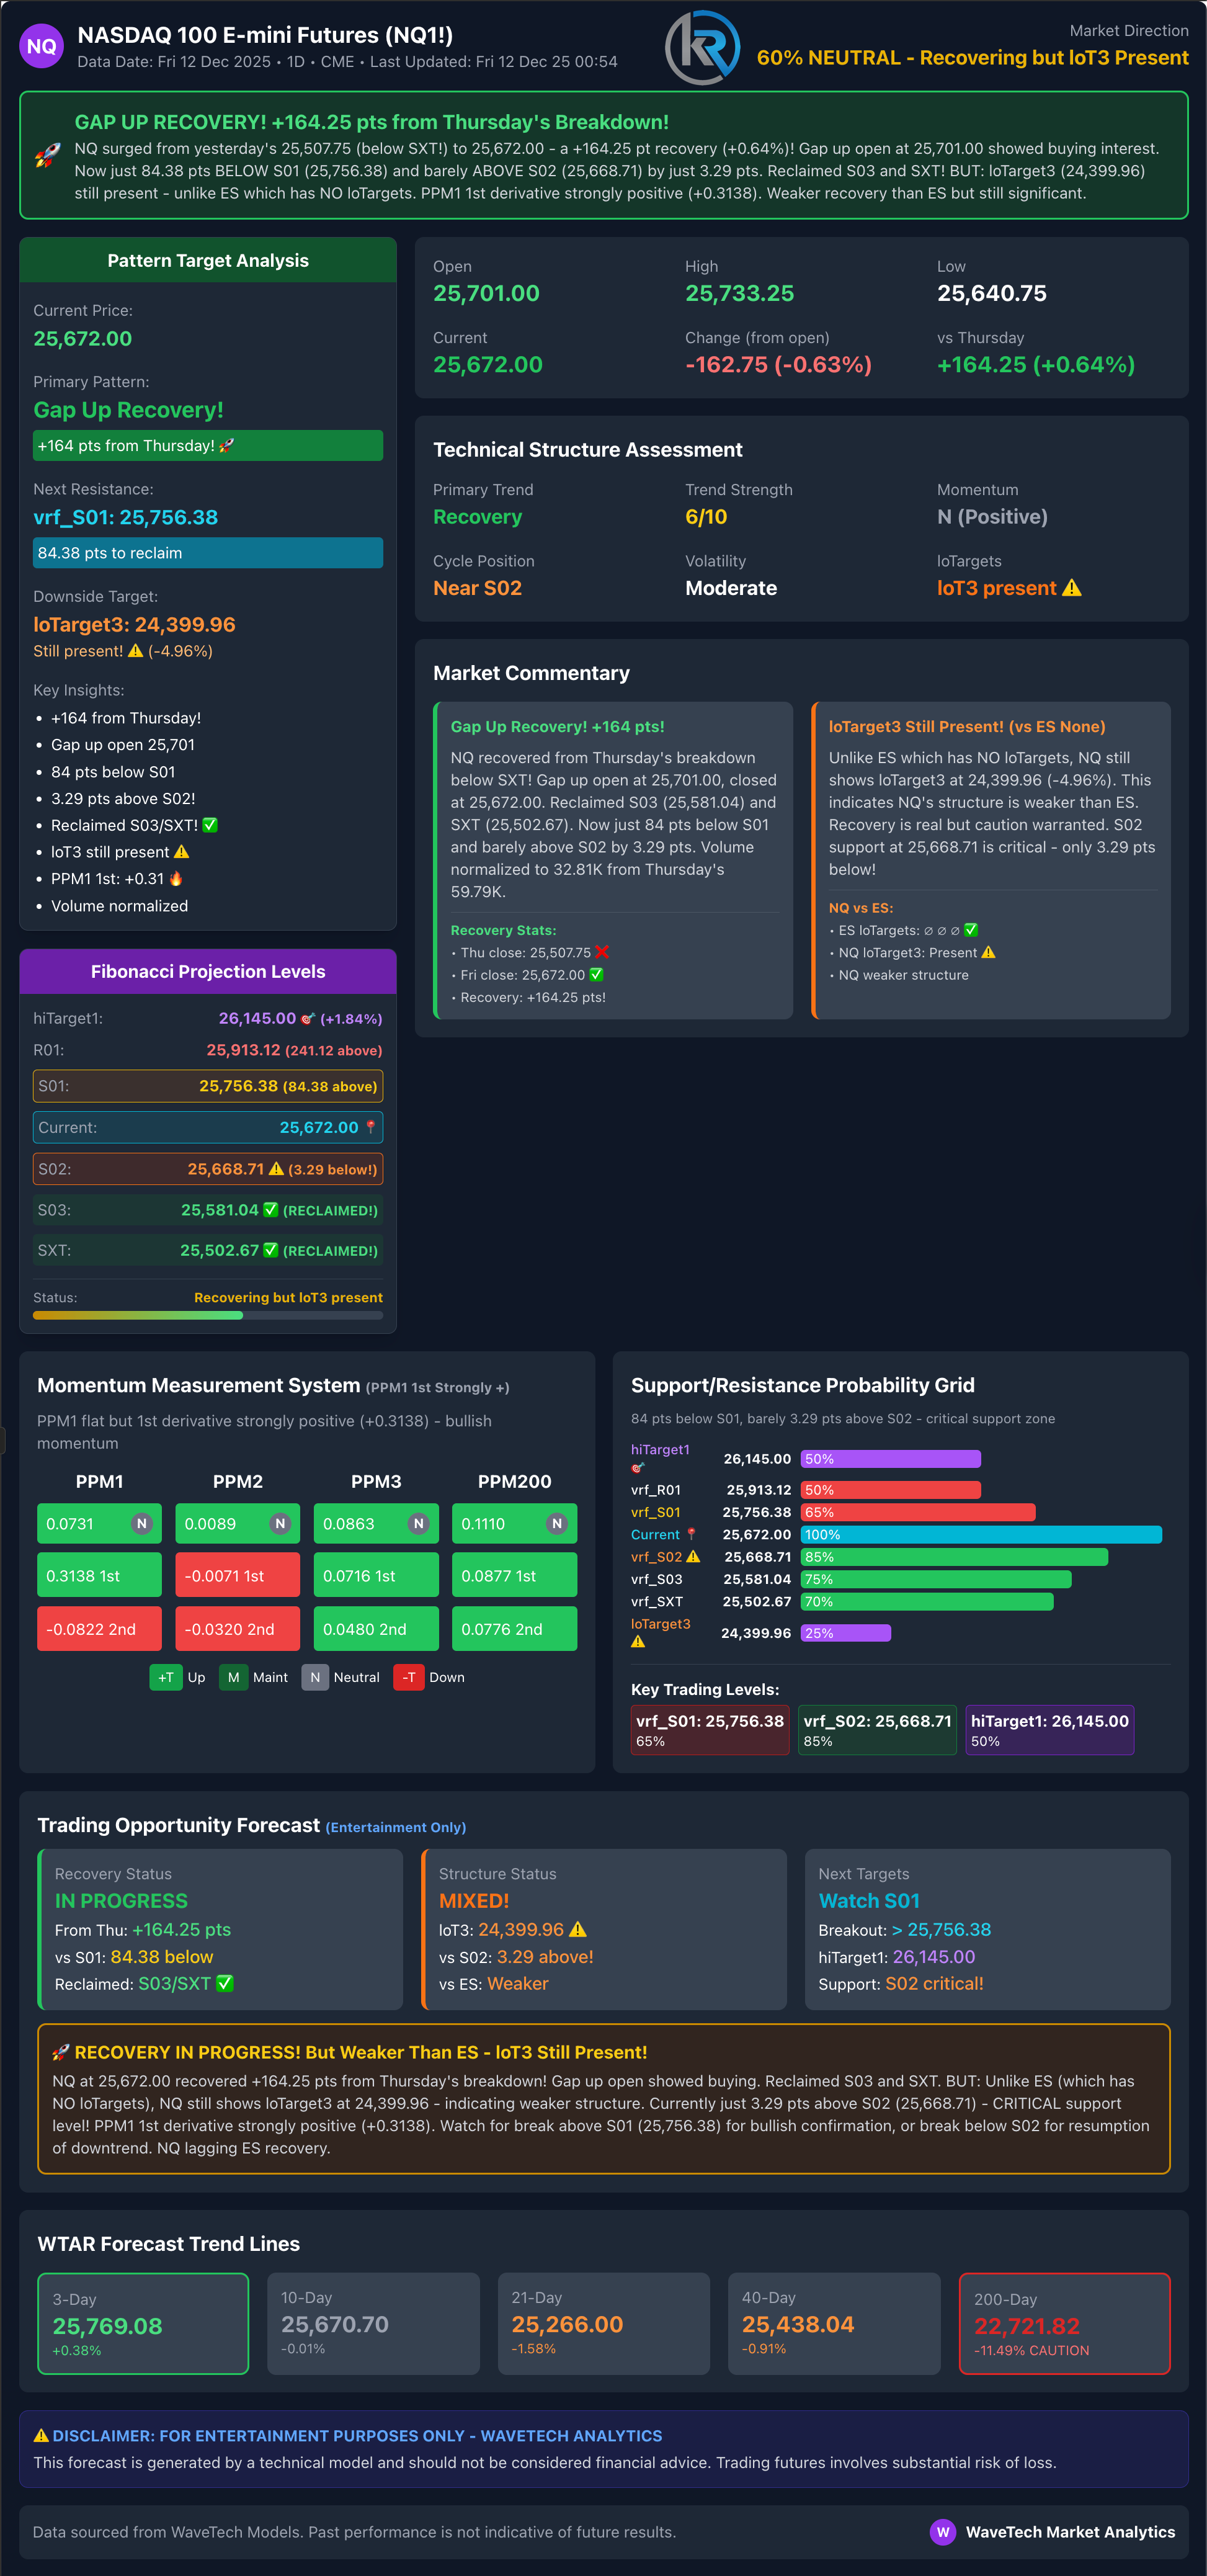
NASDAQ Futures
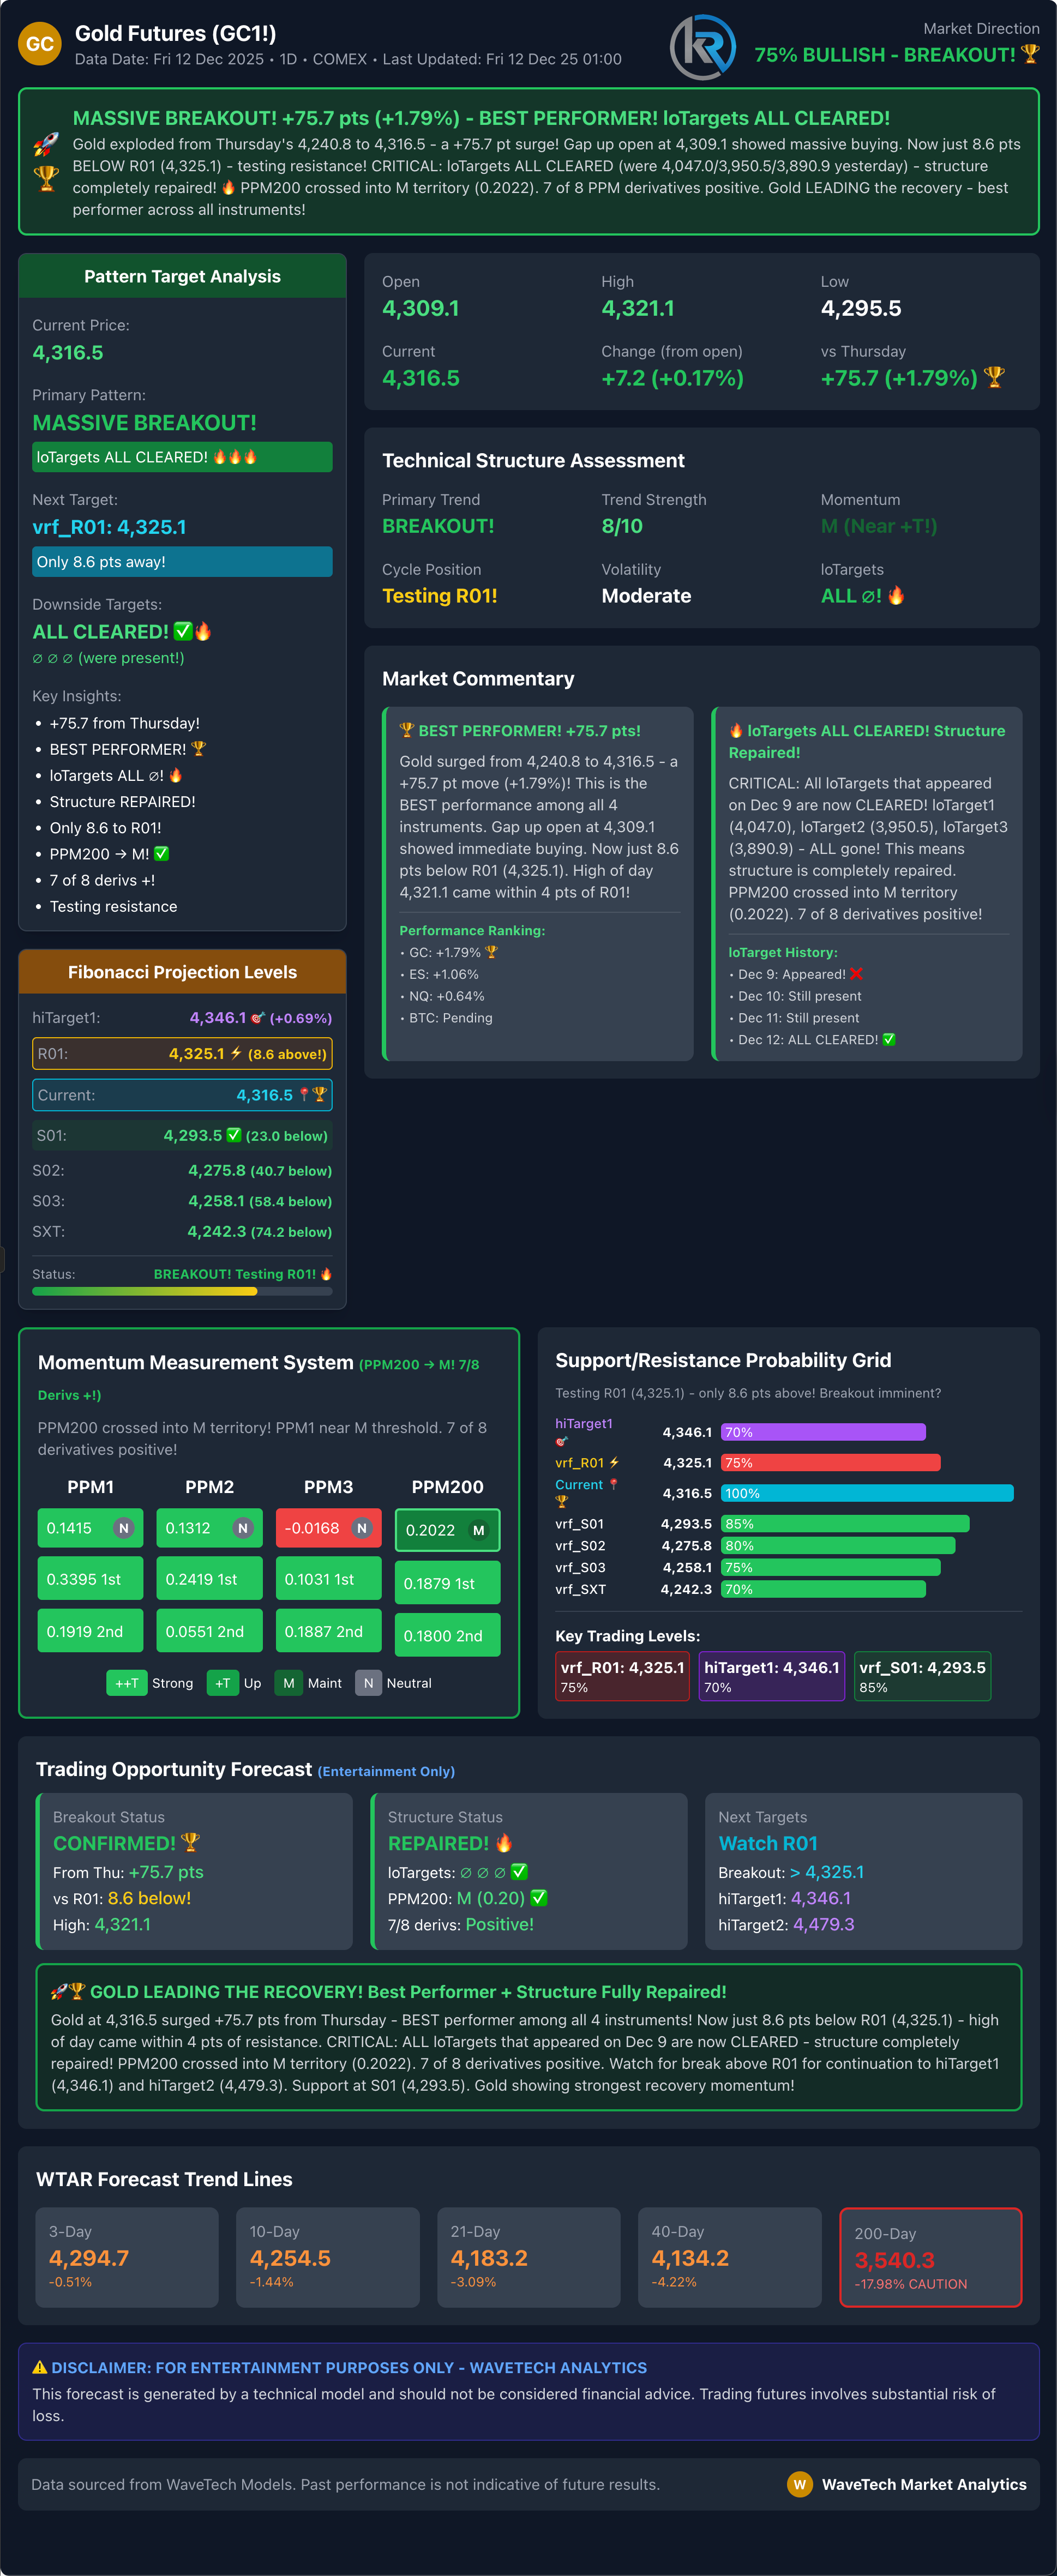
Gold Futures
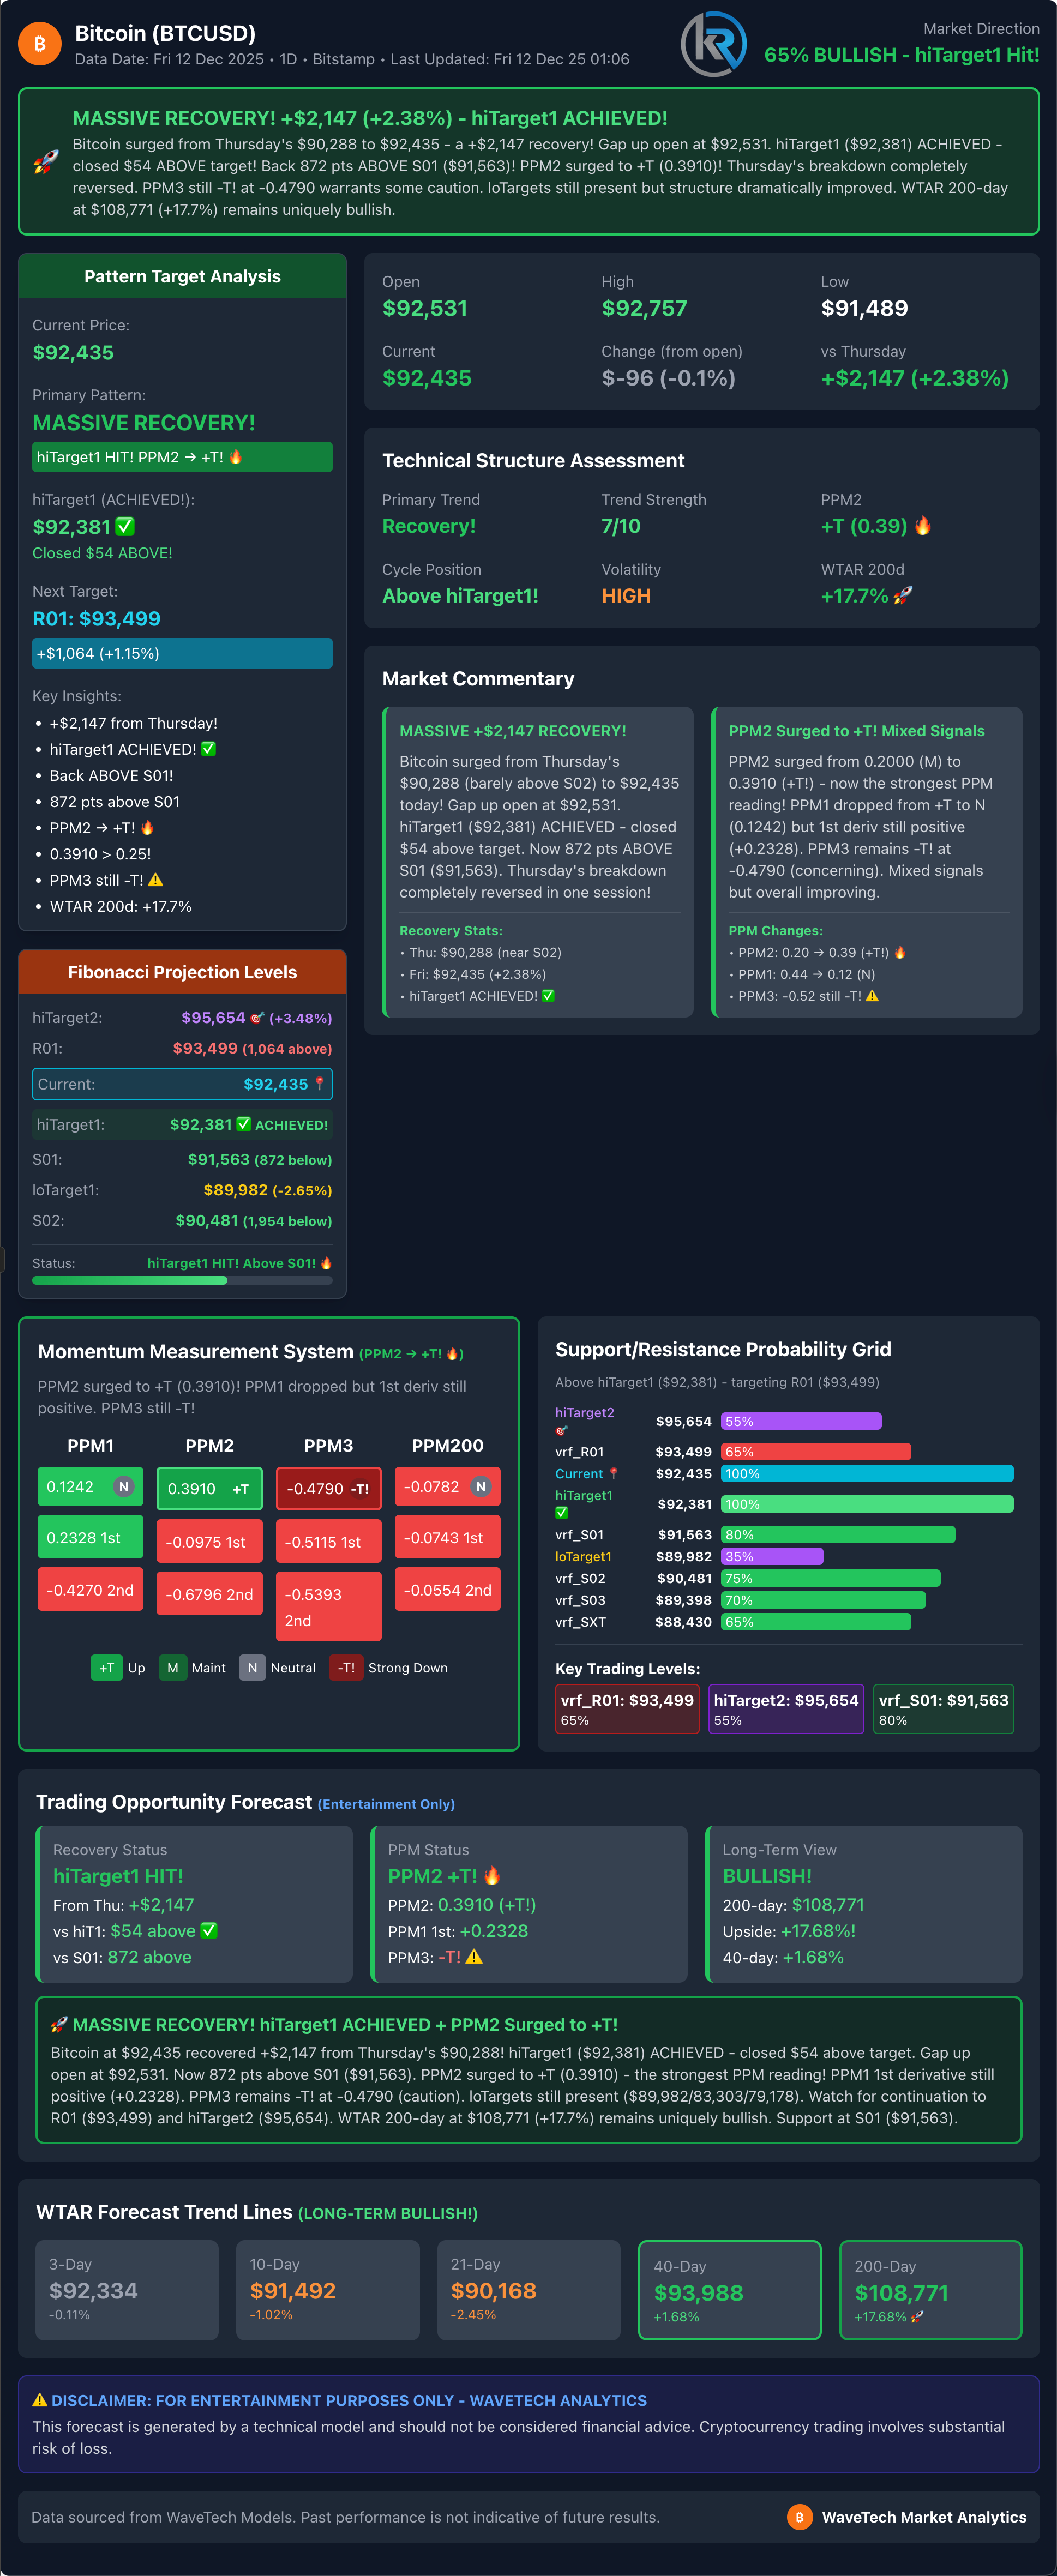
Bitcoin
Robert Kendall
Chief Analyst
“Disclaimer for “The Kendall Report
The information provided in “The Kendall Report” is for general informational and educational purposes only. The opinions, analyses, and forecasts included in this newsletter are based on the author’s personal views and experiences and are provided as is without warranty of any kind.
While we strive to provide accurate and up-to-date information, we do not guarantee the accuracy, completeness, reliability, or timeliness of any information contained in this newsletter. The information presented should not be construed as financial, investment, legal, or other professional advice. It does not constitute a recommendation or endorsement of any particular investment strategy, financial instrument, product, or service.
Investors should consider their financial situation, objectives, and risk tolerance before making investment decisions based on the information provided. The financial market is subject to high risk and volatility. Past performance is not indicative of future results. Investing in the financial market involves the risk of loss, including the loss of principal.
“The Kendall Report” and its contributors will not be liable for any direct, indirect, incidental, consequential, or exemplary damages arising from the use or inability to use the information provided in this newsletter, including but not limited to losses or missed gains.
By accessing and using “The Kendall Report,” you acknowledge and agree to this disclaimer and assume full responsibility for the use of the information provided. We reserve the right to make changes to the content of this newsletter at any time without notice.
This disclaimer is subject to change at our discretion, and it is the reader’s responsibility to review it regularly for any updates.