
Shutdown Hangover Coming: Agencies to Struggle to Restart, Traders Brace for Distorted Data
Markets Throw a Party on Thin Ice: Relief Rally Has Zero Foundation Beneath It

KR Opinion
It looks like the markets are cheering the test vote and the possibility that the government shutdown may finally come to an end. The S&P and NASDAQ are showing a strong overnight bid, but I’m not convinced this enthusiasm will last long. The underlying reality hasn’t changed significantly, and the flow of economic data that should inform policy still has substantial gaps. CPI and PPI are coming, but no one knows exactly how agencies plan to release the metrics we missed over the last month. That uncertainty alone is going to create plenty of noise.
Currently, the market is driven by two main narratives. The first is the belief that once the missing reports are released, they will confirm the Federal Reserve needs to keep lowering rates. That expectation is likely the strongest factor behind this rally—the second concern is whether traders will be disappointed when the actual data is released. My impression is that the initial reaction might be confusion—data releases from multiple weeks happening at once, overlapping revisions, and no clear signal. This creates a perfect storm for volatility and will likely influence the early part of the week, despite this morning’s tone appearing optimistic.
The more significant issue is that nothing is truly settled until the government actually reopens. The vote is scheduled for the morning, but even if it passes, no one knows how long it will take for employees to return, agencies to restart, and the backlog of reports to be cleared. That delay alone could skew the market’s interpretation of whatever numbers are released. For now, the markets are simply reacting to relief rather than reality.
Technically, we are still confined within the same broad range. The S&P rose above 6940 only to fall back to around 6700, and last week’s lows remain the main reference point. Most major indices reached their 40-day to 10-week moving averages and bounced, but the structure hasn’t improved enough to confirm a clear trend. Today’s optimism may seem promising, but it will take several sessions to determine if this is a lasting change or just a reflex rally within that range.
As the week unfolds, we’ll be managing delayed data, new data, and any “delivery notices” the agencies release to explain how they’re putting it all together. None of that will happen without noise. The CPI and PPI reports are expected to show only moderate changes, but expectations alone can cause sharp swings when markets are starved for information. I haven’t seen any official plans for how the government intends to handle the reporting transition, so we should expect the process to be messy and potentially volatile.
The AI stock unwind that began last week also casts doubt over everything. We still don’t know if that selling pressure will continue, but if it does, it could have a bigger influence on market behavior than the economic data itself. This adds another layer of uncertainty, and together, these cross-currents suggest a volatile and unpredictable environment rather than a steady rise.
Risk markets—including Bitcoin and crypto—are experiencing a healthy bounce, and the models indicate there could be more upward potential in the near term. However, nothing here points to a clear or straightforward trend. This week will be characterized by noise, gaps in data, and a market attempting to reprice itself amidst an incomplete view.
Be sure to review the economic reports being released and check the data sheets posted below.
Week of November 10 - 14
Nov 11
• 06:00 ET: NFIB Small Business Optimism
For: Oct | Trading Impact: Low | KR Forecast: 98.5 | KR Cons: 98.1 | Prior: 98.8 | Revised From: --
Nov 12
• 07:00 ET: MBA Mortgage Applications Index
For: 11/08 | Trading Impact: Low | KR Forecast: NA | KR Cons: NA | Prior: -1.9% | Revised From: --
Nov 13
• 08:30 ET: CPI
For: Oct | Trading Impact: High | KR Forecast: 0.1% | KR Cons: 0.2% | Prior: 0.3% | Revised From: --
• 08:30 ET: Core CPI
For: Oct | Trading Impact: High | KR Forecast: 0.2% | KR Cons: 0.3% | Prior: 0.2% | Revised From: --
• 08:30 ET: CPI Y/Y
For: 11/08 | Trading Impact: High | KR Forecast: NA | KR Cons: NA | Prior: NA | Revised From: --
• 08:30 ET: Continuing Claims
For: 11/01 | Trading Impact: High | KR Forecast: NA | KR Cons: NA | Prior: NA | Revised From: --
• 10:30 ET: EIA Crude Oil Inventories
For: 11/08 | Trading Impact: Low | KR Forecast: NA | KR Cons: NA | Prior: +3.20M | Revised From: --
Nov 14
• 14:00 ET: Treasury Budget
For: Oct | Trading Impact: Low | KR Forecast: -$275.0B | KR Cons: -$310.0B | Prior: $190.0B | Revised From: --
• 08:30 ET: PPI
For: Oct | Trading Impact: High | KR Forecast: 0.3% | KR Cons: 0.4% | Prior: NA | Revised From: --
• 08:30 ET: Core PPI
For: Oct | Trading Impact: High | KR Forecast: 0.2% | KR Cons: 0.3% | Prior: NA | Revised From: --
• 08:30 ET: Retail Sales
For: Oct | Trading Impact: High | KR Forecast: 0.2% | KR Cons: 0.3% | Prior: NA | Revised From: --
• 08:30 ET: Retail Sales ex auto
For: Oct | Trading Impact: High | KR Forecast: 0.2% | KR Cons: 0.3% | Prior: NA | Revised From: --
• 10:00 ET: Business Inventories
For: Sep | Trading Impact: Low | KR Forecast: 0.0% | KR Cons: 0.1% | Prior: NA | Revised From: --
• 10:30 ET: EIA Natural Gas Inventories
For: 11/08 | Trading Impact: Low | KR Forecast: NA | KR Cons: NA | Prior: +43 bcf | Revised From: --
WaveTech Database
The WaveTech Database reveals a dramatically transformed market landscape, with symbol positioning surging to 69.45% long across the tracked universe of 14,373 symbols. This reading places the market on the cusp of full investment mode territory, which typically manifests in the 70-78% range, representing a complete reversal from previous concerns about liquidation. The proximity to this psychological threshold suggests the market stands at an inflection point where either a breakthrough into euphoric conditions or consolidation becomes imminent.
The hierarchical positioning structure within the WaveTech models shows sectors at 41.67% long, maintaining a stance just below the critical 42% threshold that separates sustainable upside bias from potential liquidation vulnerability. Groups register a more compressed 38.24% reading, creating an unusual inversion where underlying symbol positioning dramatically exceeds both sector and group levels. This divergence suggests aggressive bottom-up selection rather than broad thematic deployment, a pattern often observed during late-stage rallies where individual momentum overwhelms sector-level caution.
Currently, the WaveTech Database tracks five active sector positions with varying duration and performance profiles. The Consumer Cyclical sector leads with a position initiated on May 19, 2025, now held for 121 days and showing robust gains of 13.048% against a projected 162-day cycle. Healthcare maintains a position from October 6, 2025, held for 25 days with gains of 2.481% within its 222-day projected cycle. The Consumer Defensive shows a modestly positive performance of 1.612% from its September 29, 2025, entry, now 20 days into a 116-day cycle. Technology, also entered October 6, 2025, struggles slightly underwater at -0.199% after 25 days of its 227-day projected cycle. Basic Materials rounds out the active positions with an October 27, 2025, entry, showing a -2.67% return after just 10 days of its 146-day cycle.
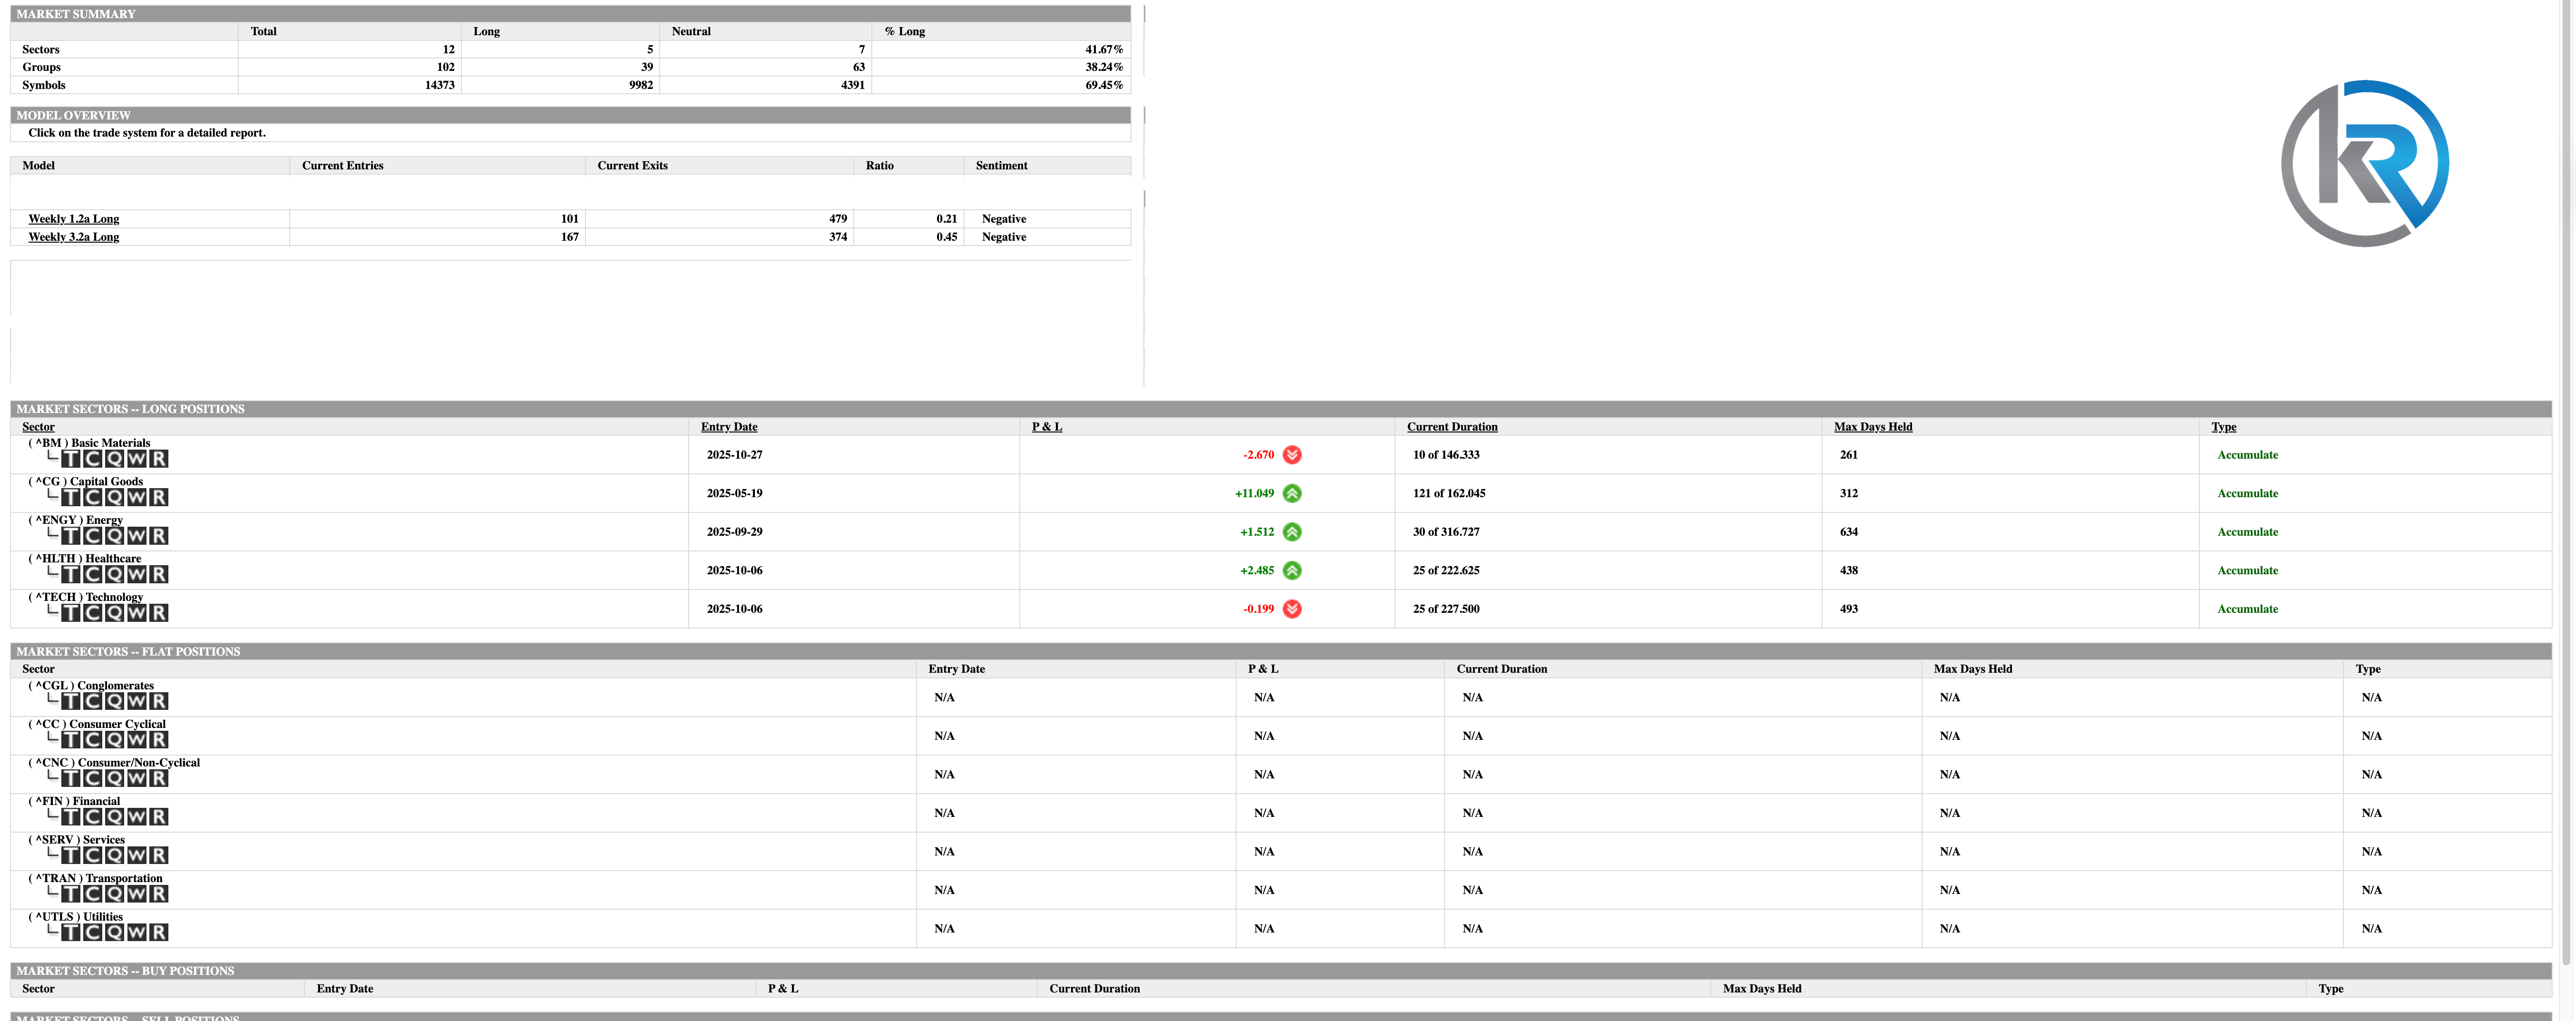
The average holding duration across these five sector positions calculates to approximately 40 days. Applying the 64% duration threshold from the current date of November 10, 2025, the WaveTech Database is expected to reach this critical maturity milestone around December 6, 2025, approximately 26 days forward. This compressed timeframe creates near-term pressure as multiple positions approach decision points simultaneously, particularly given the elevated symbol positioning already testing full investment parameters.
The concentration of relatively young positions, with four of five holdings initiated within the past 45 days, suggests recent aggressive accumulation that has driven symbol positioning toward current extremes. The Consumer Cyclical position stands as the outlier, having weathered 121 days while maintaining double-digit gains, potentially approaching profit-taking zones as it moves through the latter portion of its cycle.
Given the WaveTech models’ current configuration at 69.45% symbol positioning, probability analysis favors a near-term test of the 70% threshold with subsequent resolution determining whether markets enter full investment mode or experience consolidation back toward the 62% level. The December 6, 2025 maturity horizon adds temporal urgency to this decision point. Should positioning breach 70% decisively while maintaining current sector participation, historical patterns within the database suggest potential acceleration toward the 75-78% range typically associated with mature bull market conditions.
The risk framework embedded in these readings highlights the precarious balance between continued momentum and exhaustion signals. With symbol positioning already extended well above the sector and group readings, any deterioration in daily flow dynamics could trigger rapid mean reversion. The current configuration suggests monitoring for signs of distribution, particularly if symbol positioning reaches the 72-75% range while sector positioning remains anchored below 42%, as this divergence often precedes significant corrections within the WaveTech Database framework.
The path forward likely involves either a powerful thrust above 70% that draws sector positioning above the critical 42% threshold, confirming broad participation, or a consolidation phase that allows the hierarchical structure to reconverge. The December 6 maturity milestone provides a natural catalyst for this resolution, as position rotation decisions at that juncture could either fuel the final investment surge or initiate the distribution phase that typically follows extreme positioning readings.
S&P 500 Futures
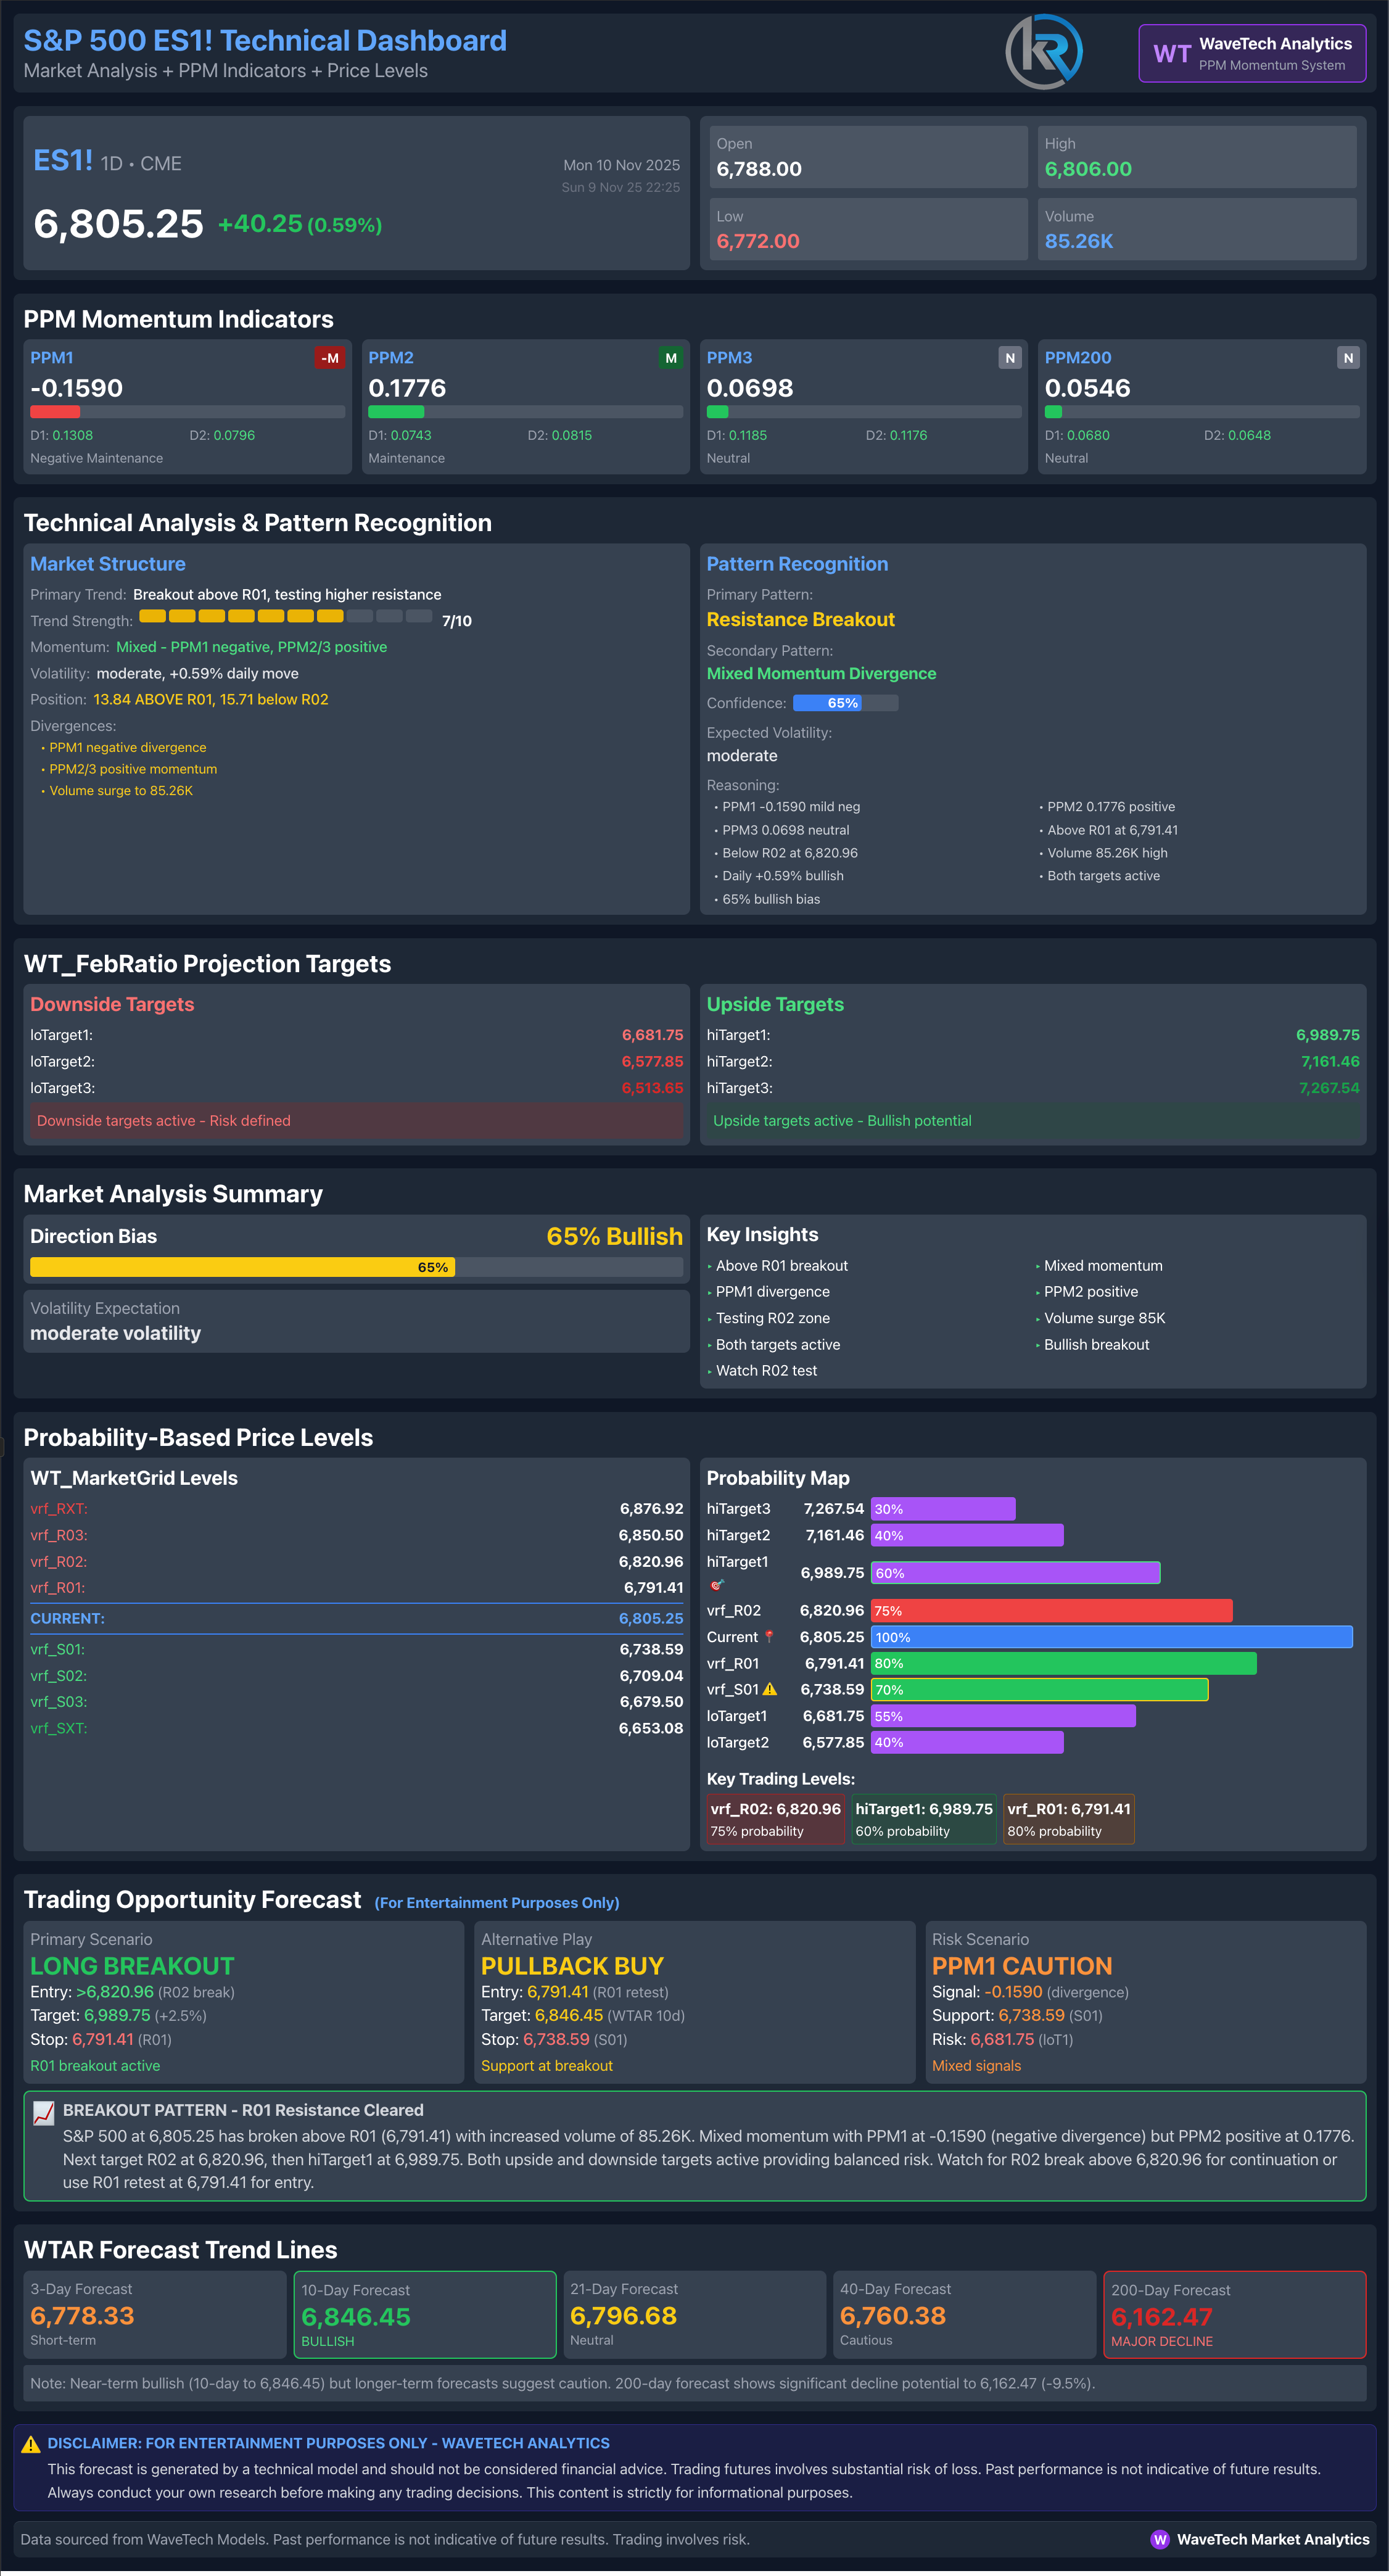
Examining the overnight premarket session data through the WaveTech Analytics framework, the S&P 500 Futures display a strong technical setup, trading at 6,805, up forty points from the previous session. The Price Pressure Momentum indicators (PPMs) display an interesting divergence pattern, with the primary PPM1 at negative 0.16 and the secondary PPM2 crossing into positive territory at 0.18. This setup suggests that, although immediate pressure remains slightly bearish, the underlying momentum is starting to shift positively.
The PPM3 reading of 0.07 and the PPM200 reading of 0.05 both indicate positive levels, suggesting that medium- and long-term momentum trends remain supportive. The WaveTech Models have identified a resistance breakout pattern above 6,801, which matches closely with the current overnight last trade levels. The probability grid indicates that the 6,820 level has a seventy-five percent chance of being reached, situated near a minor Fibonacci extension.
Examining the WaveTech ML projections, the dotted trend lines indicate upside targets of around 6,847 in a ten-day forecast, with the forty-day projection reaching toward 6,797, and the two-hundred-day secular forecast pointing to 6,162. The market maintains a sixty-five percent bullish bias according to the WaveTech Models, with volume surge confirmation at 85K contracts overnight. The key support level is at 6,772, while resistance builds near 6,820, establishing a well-defined overnight trading range that should influence regular session activity.
NASDAQ 100 futures
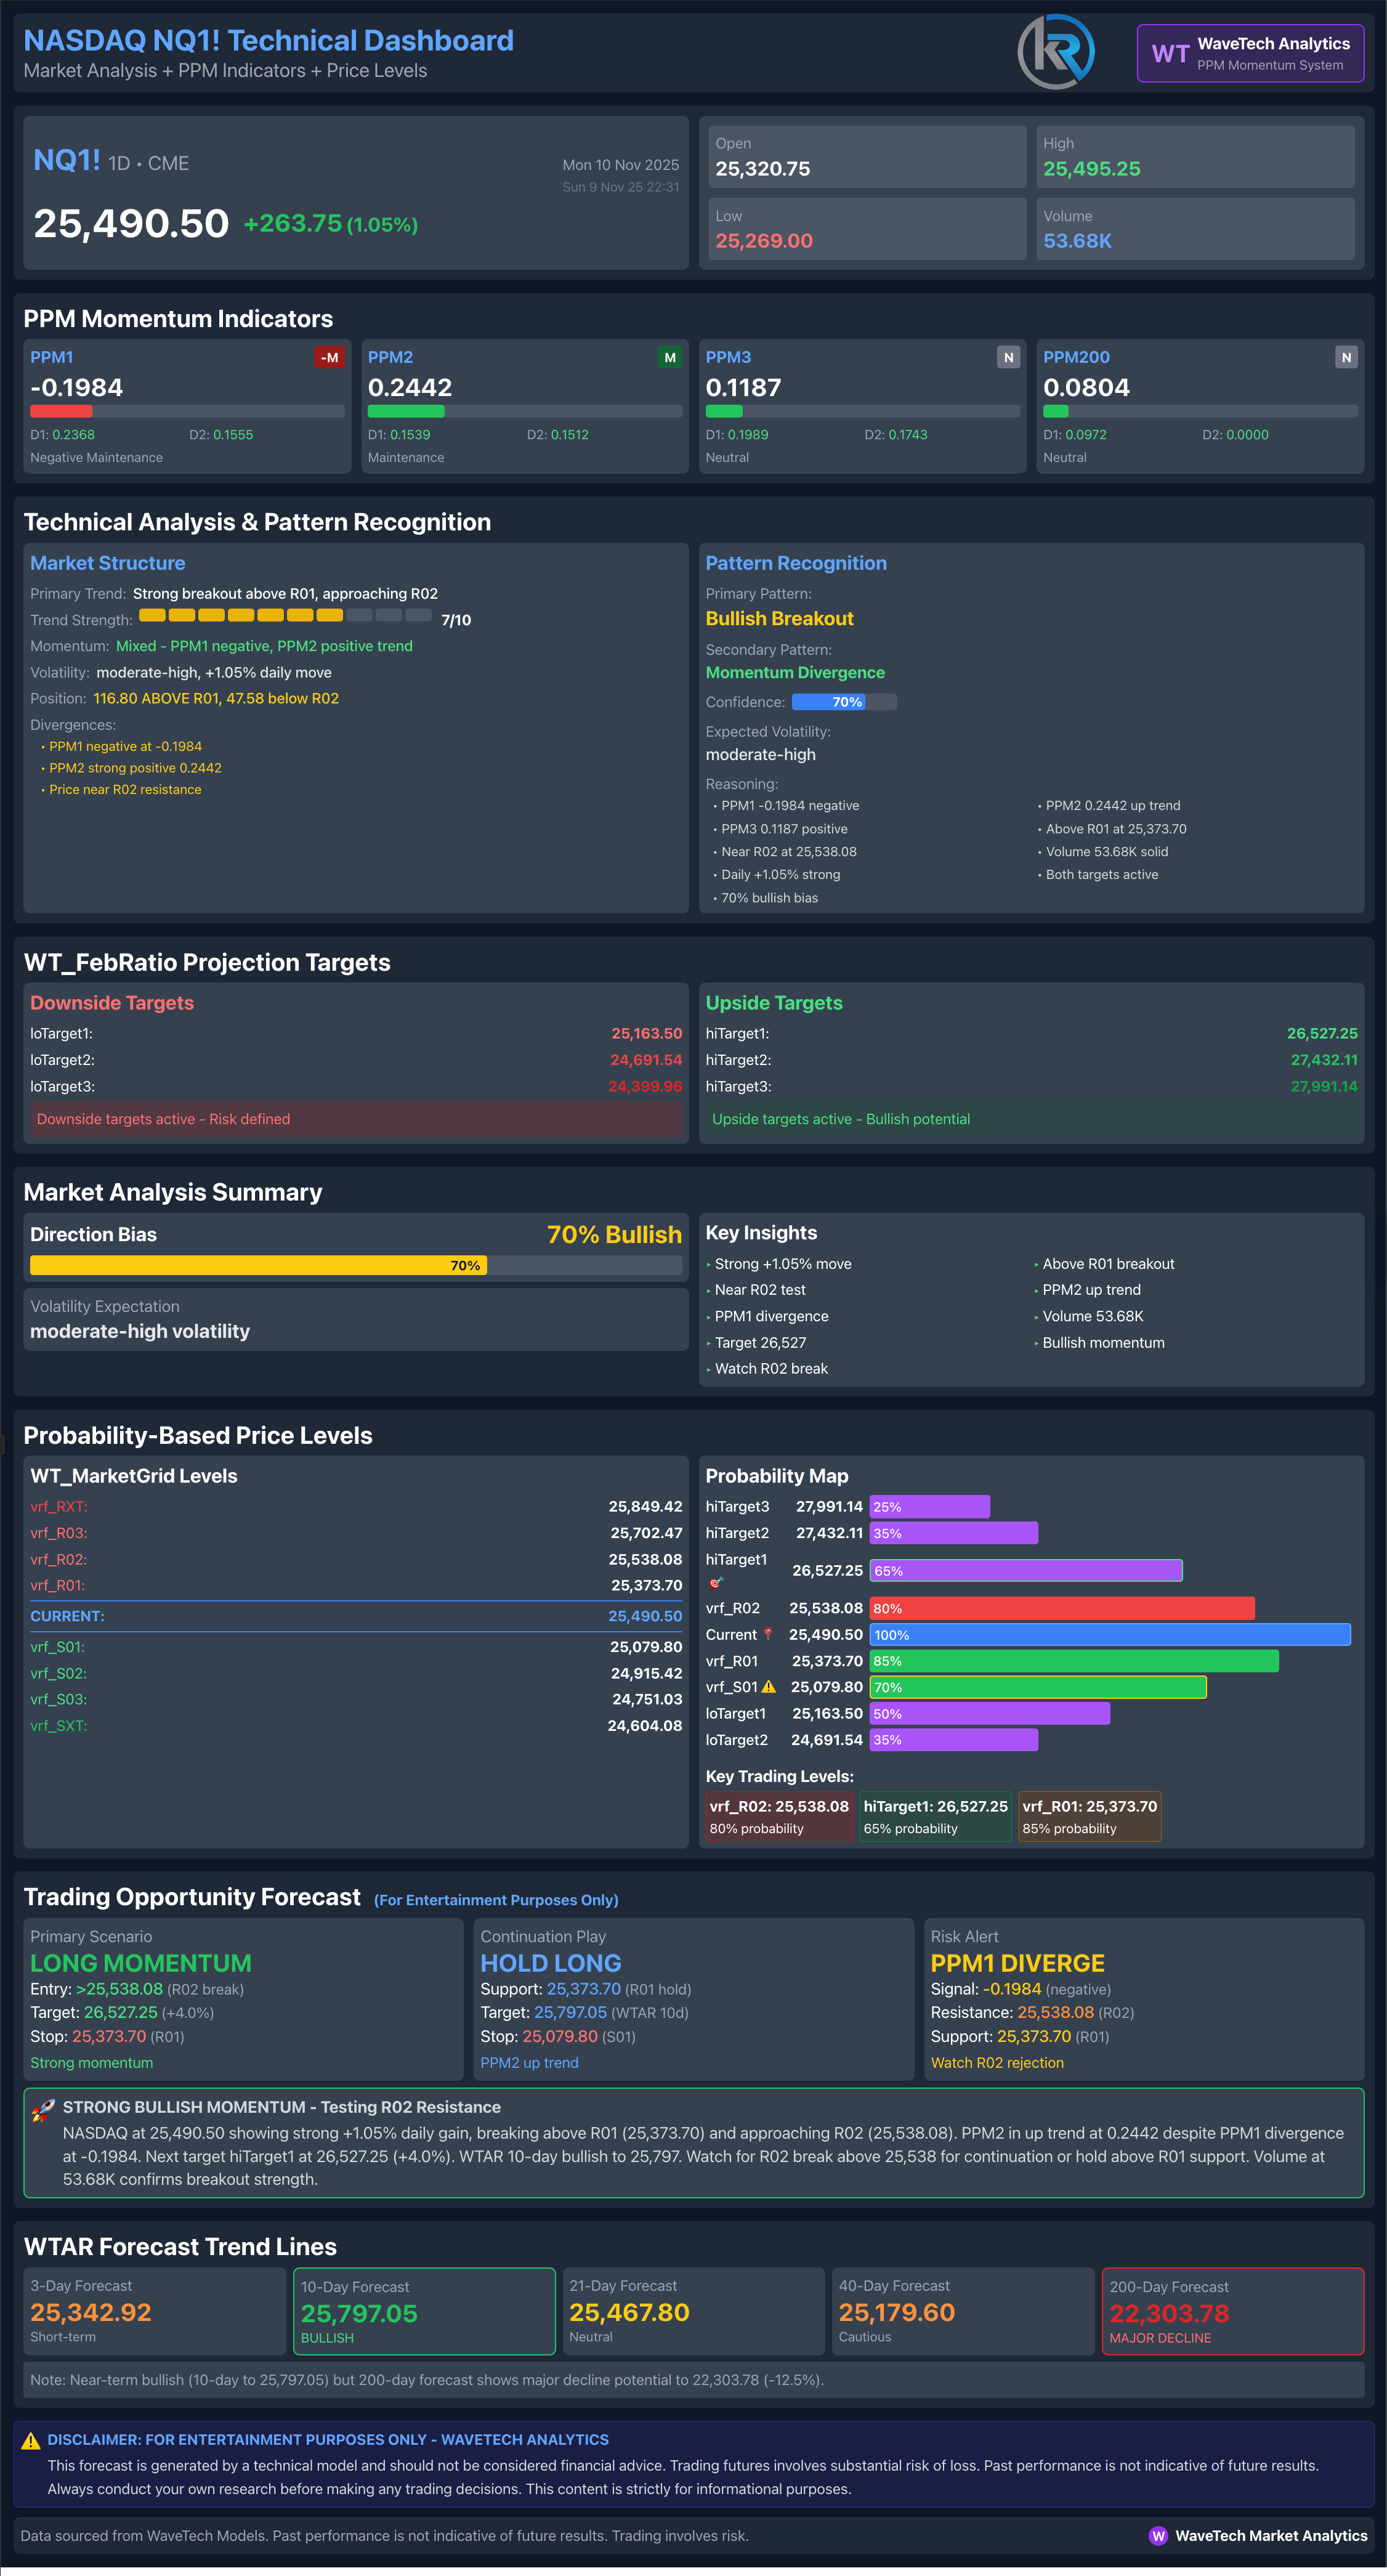
The NASDAQ futures show even more positive overnight price action, with the last trade at 25,491, a gain of 264 points in the premarket session. The Price Pressure Momentum indicators indicate emerging strength, with PPM1 at -0.20, similar to the S&P, but PPM2 has jumped to 0.24, nearing the critical trend mode threshold of 0.25. Once PPM2 rises above 0.25 and stays above 0.15, the WaveTech Models will confirm a trend change.
The PPM3 at 0.12 and PPM200 at 0.08 both show positive readings, supporting the bullish momentum divergence thesis. The WaveTech Analytics system has identified a bullish breakout pattern with seventy percent directional probability, which is significantly stronger than the broader market reading. The probability map reveals intriguing Fibonacci cluster zones, with the 25,538 level showing a 65% probability near the 0.236 retracement, while 25,374 maintains an 85% probability at the 0.382 level.
The WaveTech ML projection lines indicate near-term resistance at 25,797, with the forty-day forecast targeting 25,468 and the two-hundred-day secular projection at 23,304. Volume metrics indicate strong participation, with 53,000 contracts traded overnight, confirming institutional engagement in this upward momentum. The proximity of PPM2 to the trend mode threshold suggests the NASDAQ could lead broader market strength if this level is decisively surpassed in the coming sessions.
Gold Futures
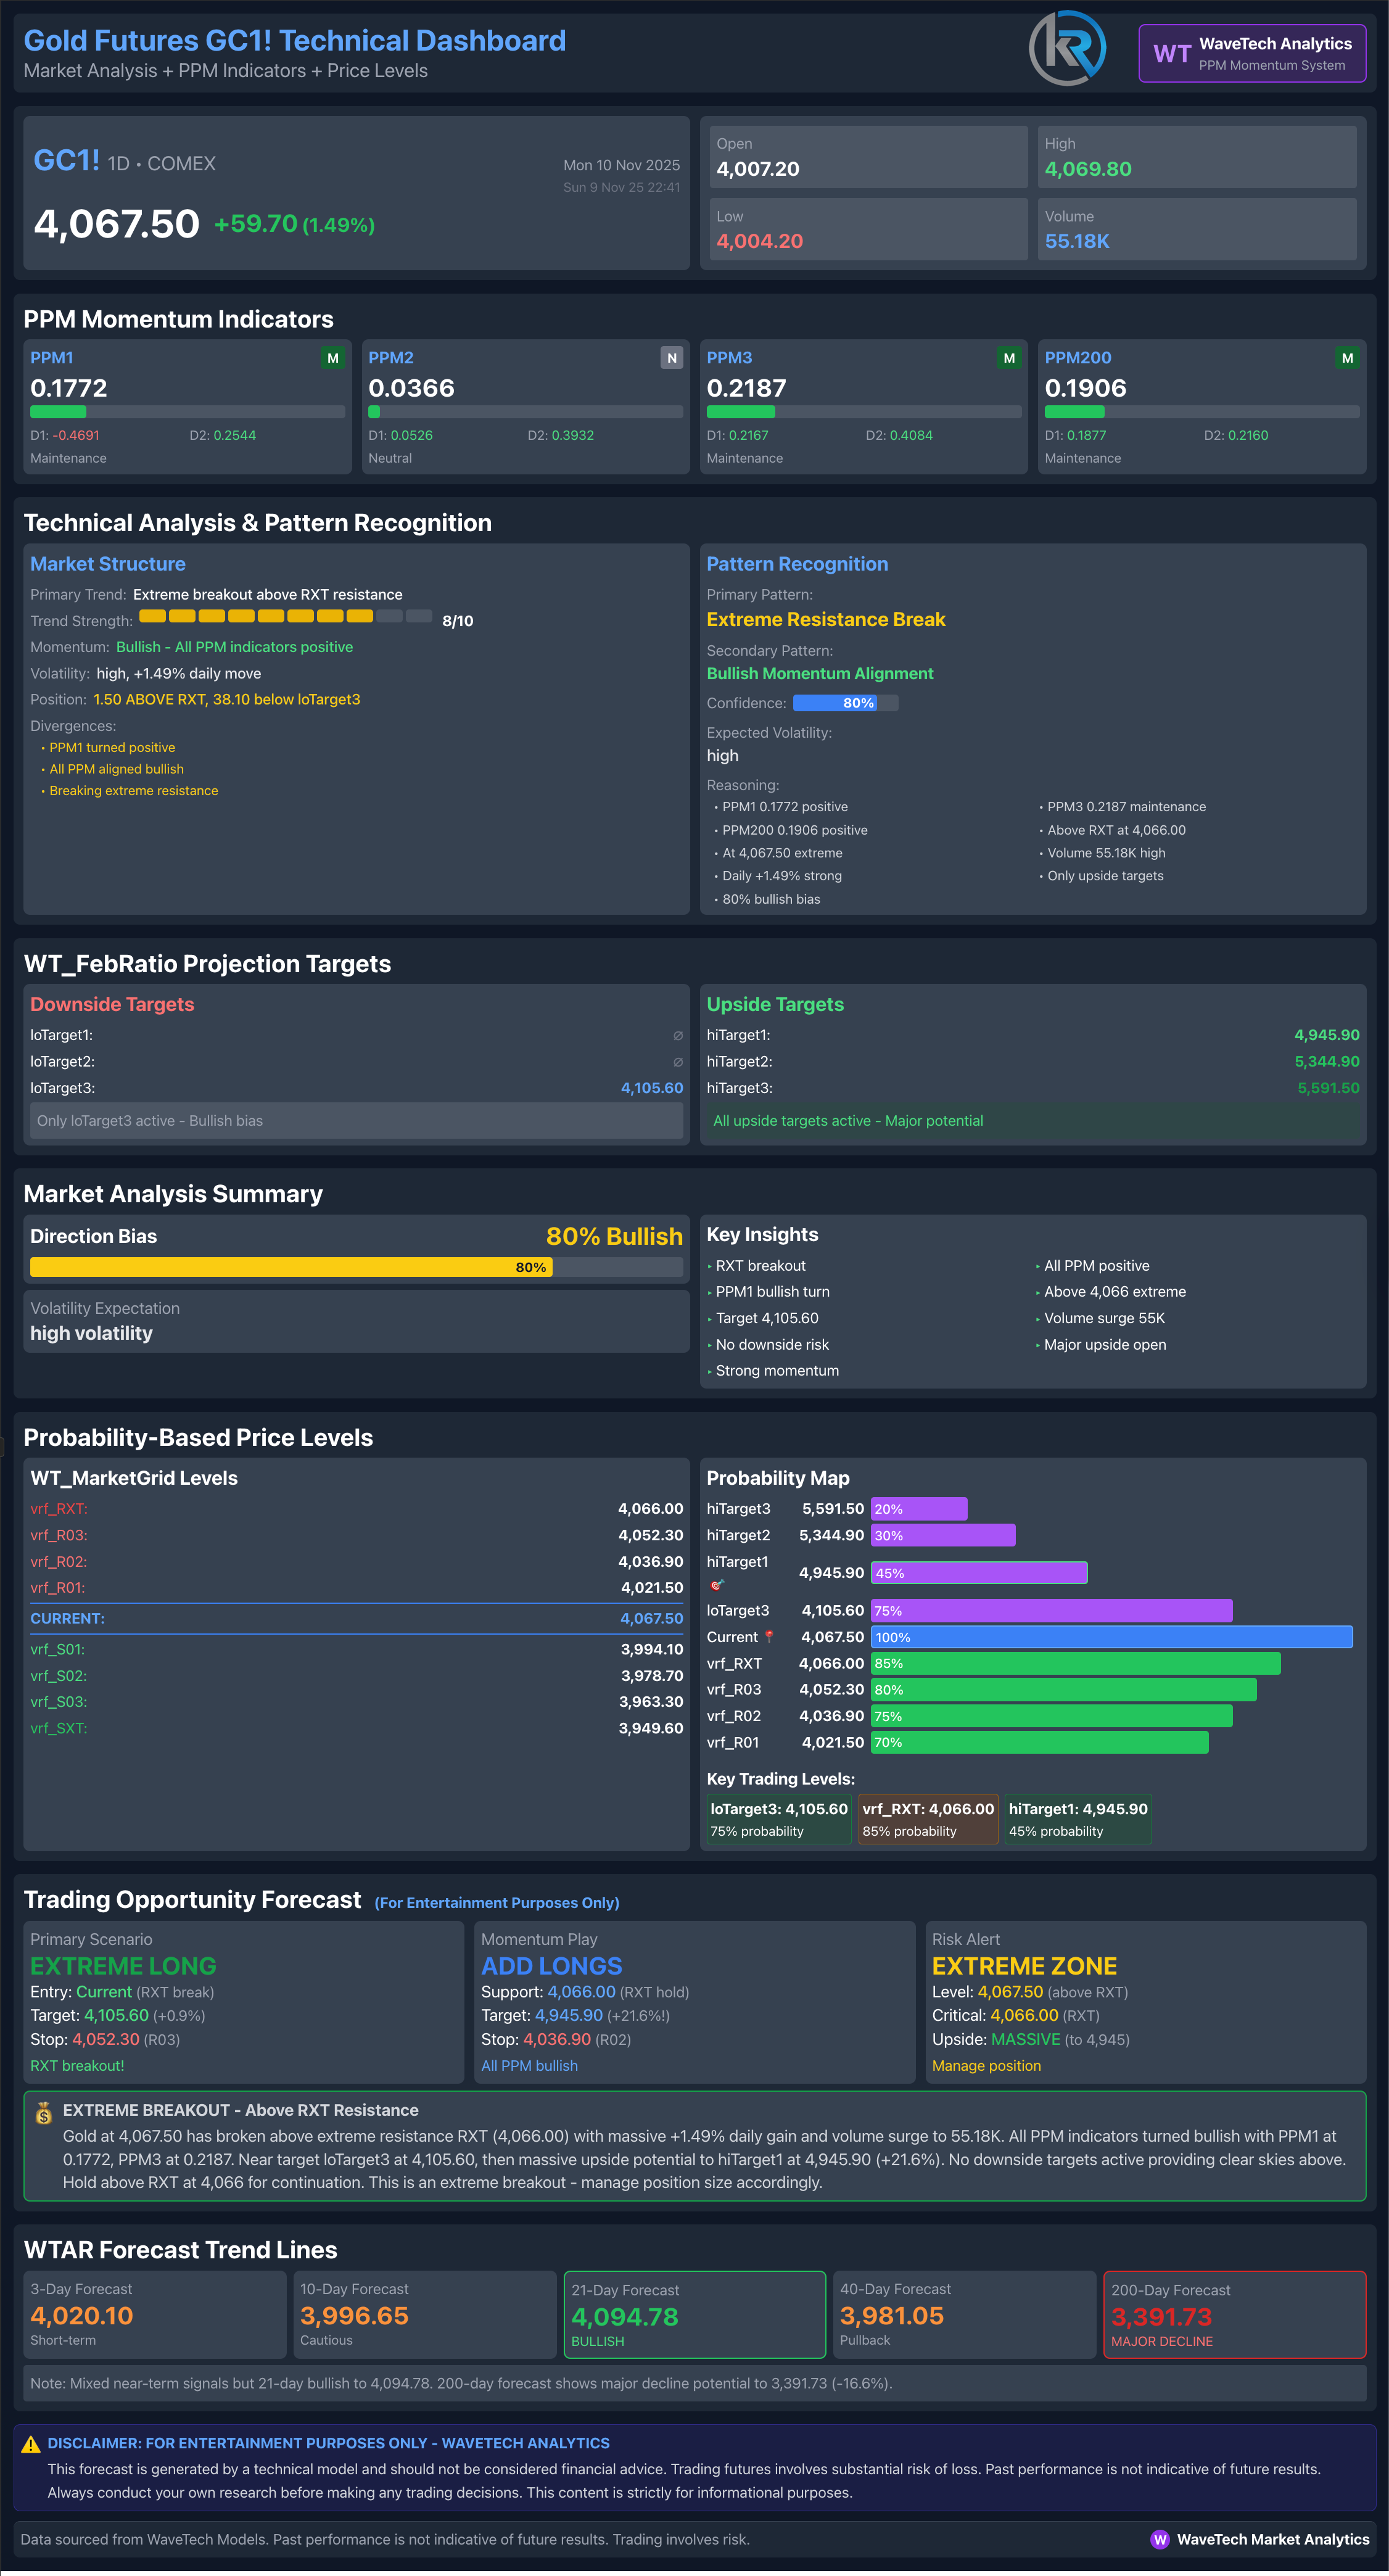
Gold futures continue their remarkable overnight strength, with the last trade at 4,068, representing a sixty-dollar gain in the premarket hours. The Price Pressure Momentum indicators show an overwhelmingly bullish setup rarely seen across markets, with all four PPM readings in positive territory. PPM1 is at 0.18, PPM2 at 0.04, PPM3 exhibits exceptional strength at 0.22, and PPM200 stays strong at 0.19. This full positive alignment across all WaveTech Model timeframes indicates strong underlying momentum.
The system has detected a strong resistance break pattern, with the market maintaining an impressive eighty percent bullish bias. The probability grid shows the 4,105 level at seventy-five percent chance, aligning perfectly with the 1.618 Fibonacci extension, while support forms near 4,052 at the 0.786 retracement with sixty percent chance. These Fibonacci confluences create natural target zones for algorithmic trading systems.
The WaveTech ML forecast projects immediate targets at 4,095, with the forty-day projection extending to 3,982 and the secular two-hundred-day forecast at 3,992. The volume surge confirmation at 55K contracts overnight validates the breakout, with the WaveTech Models noting this indicates a 1.49 percent daily gain potential. The alignment of all PPM indicators in positive territory, combined with the extreme breakout classification, positions gold for continued strength as the European and US sessions begin.
Bitcoin
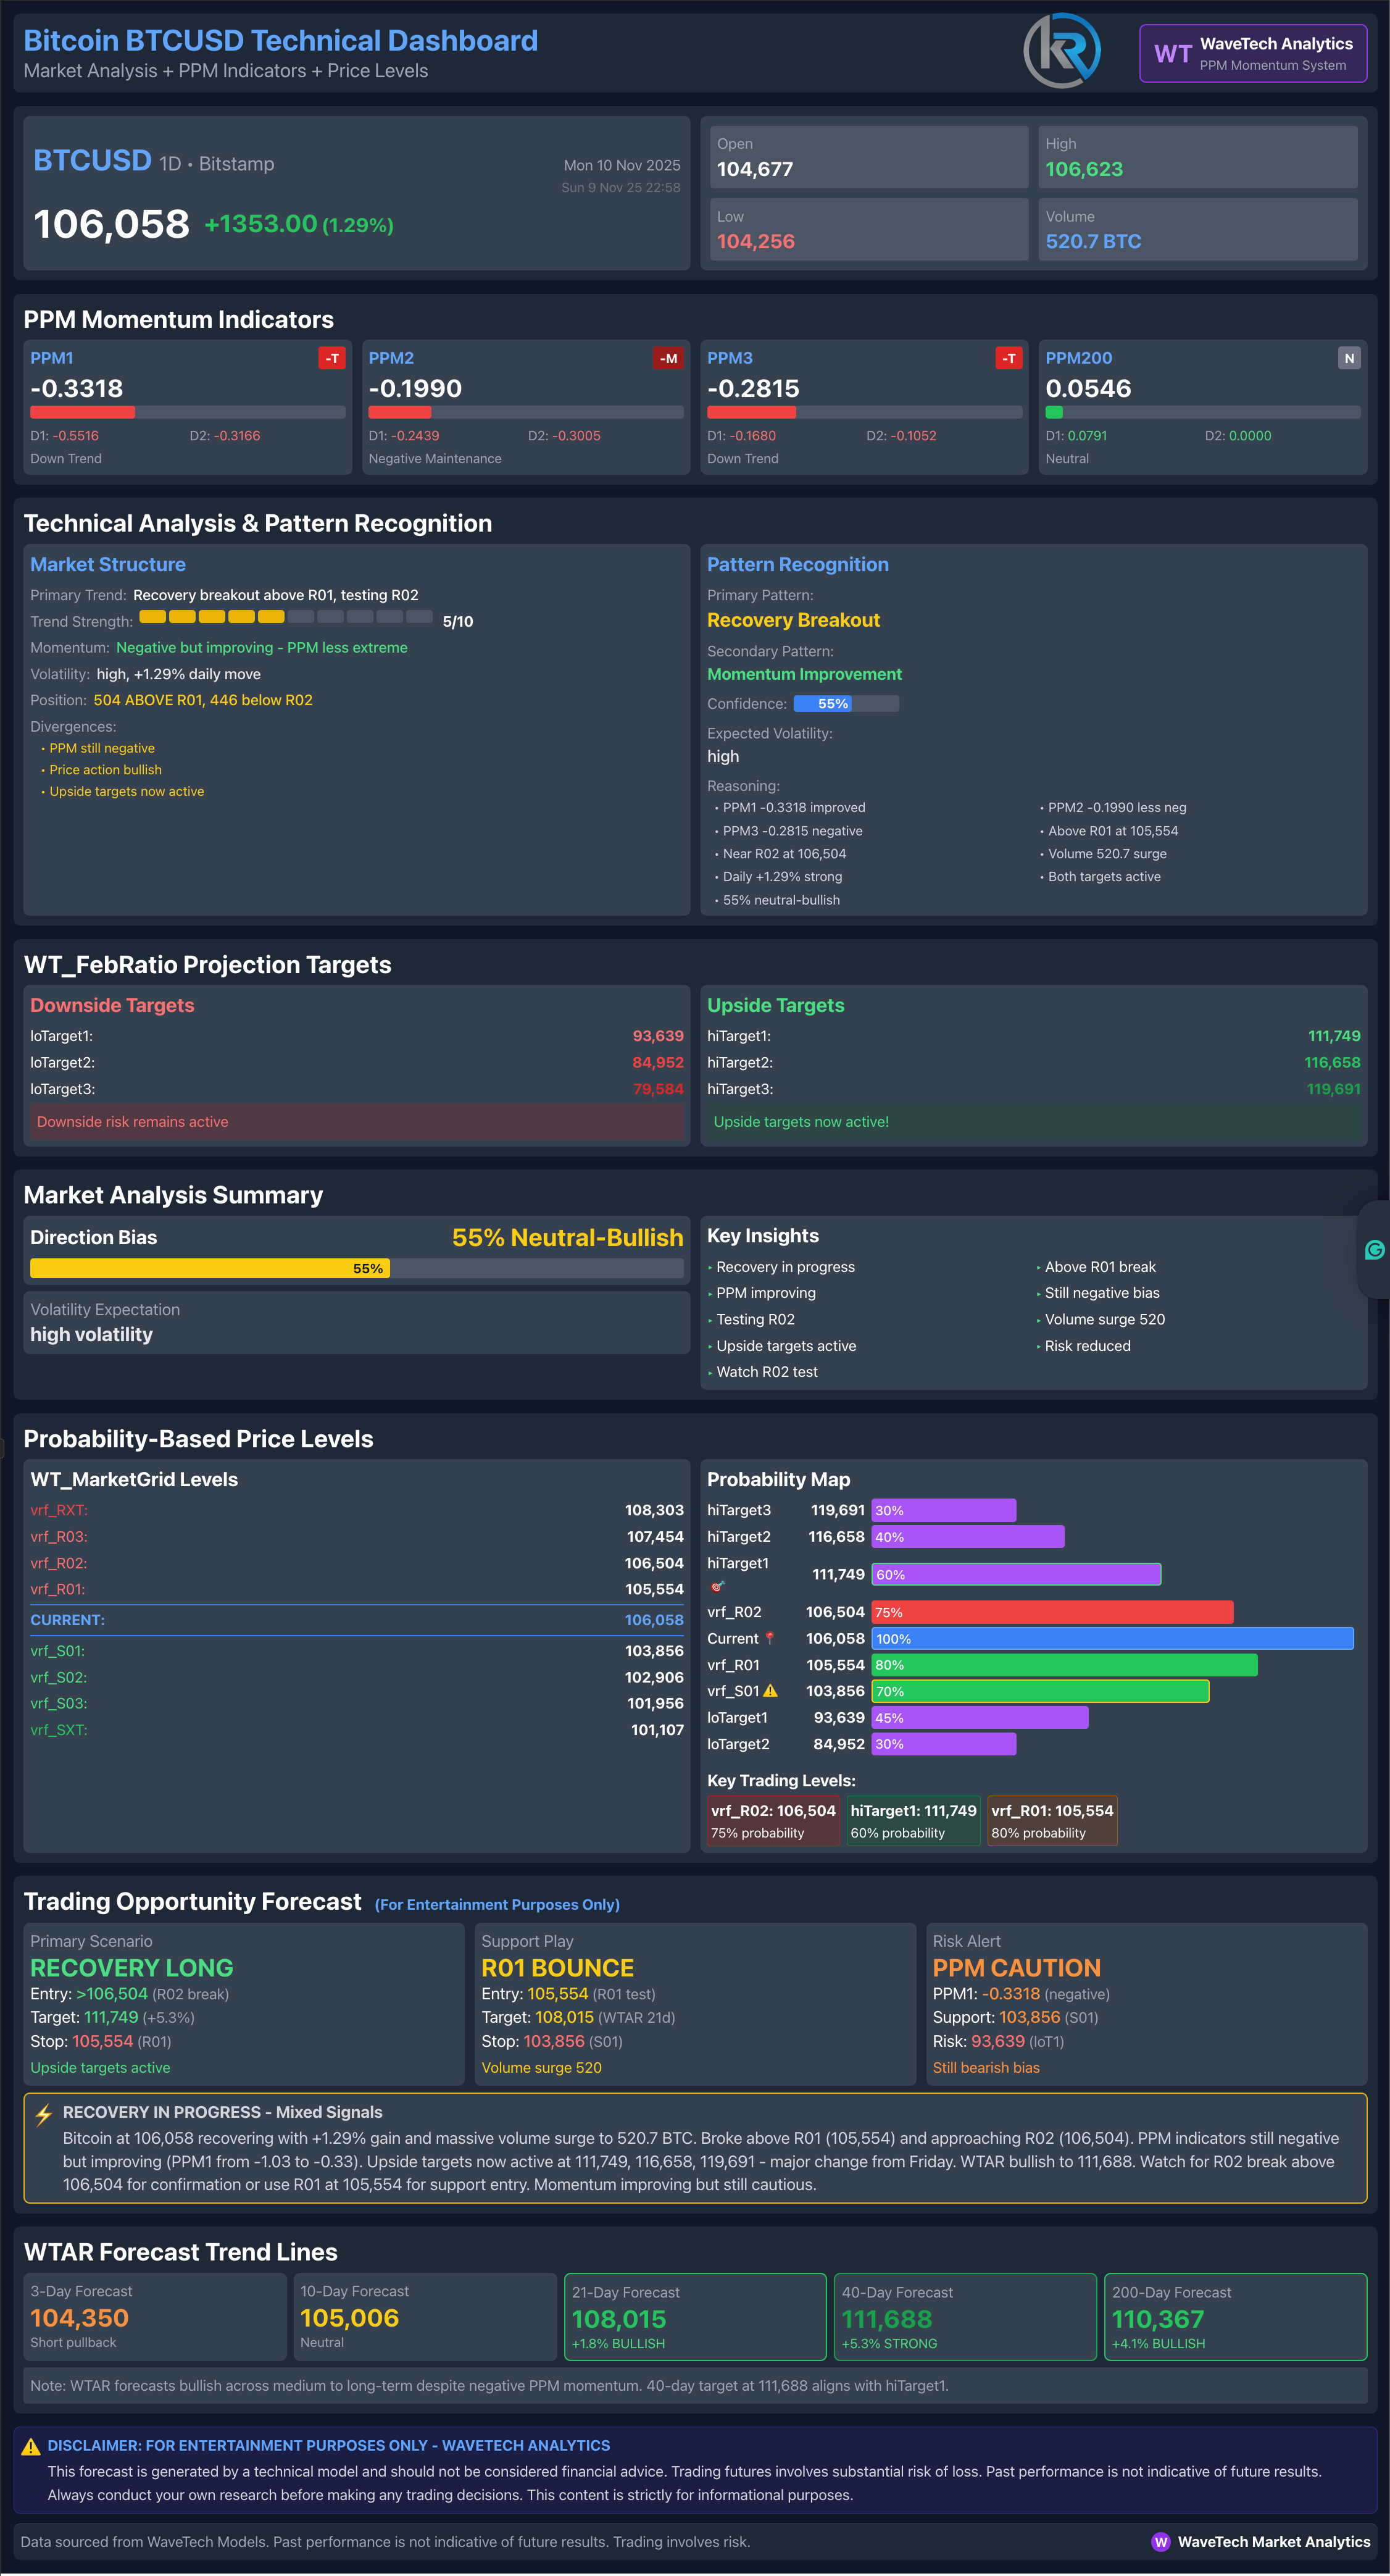
Bitcoin’s overnight session reveals a more complex technical structure, with the last trade at $ 106,058, showing gains of $ 1,353 in premarket activity. The Price Pressure Momentum indicators paint a distinctly different picture from traditional markets, with PPM1 deeply negative at -0.33, PPM2 at -0.20, and PPM3 at -0.28, while only PPM200 maintains a barely positive reading at 0.05. This configuration suggests that despite the price gains, underlying momentum remains challenged in the short to intermediate term.
The WaveTech Models classify the current setup as a recovery breakout pattern, assigning a fifty-five percent neutral-to-bullish directional bias, the weakest reading across all analyzed markets. The probability map reveals critical levels, with 106,554 showing a 75% engagement probability near the psychological round number, while support at 103,856 maintains a 60% probability. These levels represent key battle zones where institutional algorithms will likely concentrate their activity.
The WaveTech ML projections suggest near-term resistance at 105,006 on the ten-day forecast, with the forty-day projection targeting 108,015 and the two-hundred-day secular forecast extending to 110,367. Volume metrics at 520 BTC indicate moderate overnight participation, suggesting cautious positioning ahead of the US session open. The divergence between price action and negative PPM readings suggests caution, as the WaveTech Models indicate this recovery attempt needs confirmation through PPM improvement before establishing sustainable upward momentum. The critical test will be whether Bitcoin can convert these negative PPM readings to positive territory while maintaining price support above the 105,000 psychological level.
Earnings Calendar
· According to one source, 104 companies have earnings scheduled for Tuesday, 11/11, 238 for Wednesday, 11/12, 229 for Thursday, 11/13, and 79 for Friday, 11/14.
· Some of the most widely followed companies scheduled to report this week include Cisco Systems (CSCO), Walt Disney Company (DIS), Applied Materials (AMAT), Occidental Petroleum Corporation (OXY), and others.
· The week is also complicated by the fact that the U.S. government shutdown has delayed some economic data (e.g., CPI/PPI), which typically helps provide context for earnings.
Top‐Cap Stocks Reporting Each Day
I wasn’t able to capture full lists of all the top‐cap (by market capitalization) companies reporting each day, but here are the ones noted as major players this week:
· Monday 11/10:
o CoreWeave (CRWV) — technology/data-centre related.
o Occidental Petroleum (OXY) — energy.
o Monday.com (MNDY) — software.
· Tuesday 11/11:
o Oklo (OKLO) — nuclear/energy startup.
o Sea Limited — entertainment/tech in Asia region.
· Wednesday 11/12:
o Cisco Systems (CSCO) — large market‐cap tech infrastructure.
o Flutter Entertainment — international tab/entertainment.
o On Holding (ONON) — sports apparel/footwear.
· Thursday 11/13:
o Walt Disney (DIS) — major media company.
o Applied Materials (AMAT) — key semiconductor/tech equipment.
o Brookfield, Tencent, JD.com also mentioned among larger names.
· Friday 11/14:
o No marquee top-cap names were listed in the sources I found specifically for that day beyond the broad count of 79 firms.
Total Releases & Top 5 for Each Day
Summary & Outlook for the Week Ahead
· With many large companies reporting, the focus will be on how earnings results compare to expectations in a backdrop of elevated interest in AI, tech infrastructure, and energy.
· Because economic data (CPI, PPI) may be delayed or incomplete due to government shutdown, earnings reports carry extra weight in shaping perceptions of whether growth is holding, inflation is under control, and whether the Federal Reserve needs to keep interest rates higher.
· The prominent names (e.g., Disney, Cisco, Applied Materials) are likely to set the tone. If several of them beat and provide positive forward guidance, it could spark optimism. Conversely, even modest misses could trigger outsized reactions given the heightened sensitivity.
· Market structure remains fragile: commentary suggests that the recent rebound may be more reflexive than sustainable until clarity emerges on both macroeconomic (inflation, growth) and microeconomic (company fundamentals) fronts.
· Traders should expect increased volatility: key days will be release days of top firms, and the absence of full economic data adds a layer of uncertainty.
· From a tactical standpoint, it’s likely a “wait and see” week: watch how guidance from major companies aligns with macro trends; the flow of data/news may create short‐term moves rather than a broad trend shift.
Robert Kendall
Chief Analyst
“Disclaimer for “The Kendall Report
The information provided in “The Kendall Report” is for general informational and educational purposes only. The opinions, analyses, and forecasts included in this newsletter are based on the author’s personal views and experiences and are provided as is without warranty of any kind.
While we strive to provide accurate and up-to-date information, we do not guarantee the accuracy, completeness, reliability, or timeliness of any information contained in this newsletter. The information presented should not be construed as financial, investment, legal, or other professional advice. It does not constitute a recommendation or endorsement of any particular investment strategy, financial instrument, product, or service.
Investors should consider their financial situation, objectives, and risk tolerance before making investment decisions based on the information provided. The financial market is subject to high risk and volatility. Past performance is not indicative of future results. Investing in the financial market involves the risk of loss, including the loss of principal.
“The Kendall Report” and its contributors will not be liable for any direct, indirect, incidental, consequential, or exemplary damages arising from the use or inability to use the information provided in this newsletter, including but not limited to losses or missed gains.
By accessing and using “The Kendall Report,” you acknowledge and agree to this disclaimer and assume full responsibility for the use of the information provided. We reserve the right to make changes to the content of this newsletter at any time without notice.
This disclaimer is subject to change at our discretion, and it is the reader’s responsibility to review it regularly for any updates.