
The WaveTech Database Is Whispering but Not Shouting

KR Opinion
As we enter the sixth week of the conflict between the United States and Iran, there is no sign of any resolution on the horizon. President Trump continues to escalate the rhetoric, threatening to send Iran back to the Stone Age and openly discussing the possibility of striking civilian infrastructure, including electrical grids and utility systems. Whether or not those strikes actually happen, just the idea of targeting civilian facilities raises serious questions under the Geneva Convention, and the fact that it is even being considered says a lot about the direction of this situation. Meanwhile, Iran has shown no signs of backing down. They keep fighting, continue launching strikes against Israel, and the entire war effort seems to be escalating rather than moving toward any kind of resolution. There is no clear exit plan, no diplomatic breakthrough in sight, and no indication from either side that a ceasefire is even seriously being considered.
The Strait of Hormuz remains effectively closed, and nothing about that situation has changed in any meaningful way. Oil continues to trade well above $110, and the trend suggests prices are likely to push higher from here. It is worth noting that some oil still gets through the strait, but the key point is that Iran controls what moves and what doesn’t. They remain firmly in charge of that chokepoint, meaning the global energy market operates on their terms. As this continues each week, the damage to global trade routes, insurance costs, and shipping logistics worsens, even if the headline price of crude still grabs the most attention.
On the economic front, the employment data released on Friday showed 175,000 new jobs created, and the unemployment rate ticked down slightly to 4.3 percent. This is exactly the kind of dynamic I have been discussing for weeks. We are still looking at data from a month ago, before the full impact of this conflict had a chance to influence the economy. The real test will come when we reach May and start seeing reports that detail April’s activity. Until then, we are somewhat in the dark. The weekly jobless claims and continuing claims figures are not indicating any significant deterioration so far. Gas prices have increased slightly, putting some pressure on consumers, but nothing has reached a level that is drastically halting economic activity. From a short-term perspective, I do not anticipate much evidence of economic damage appearing in the data just yet.
Looking at the stock market, the overall trend remains under pressure, but we are beginning to see some early signs worth watching. The Wave Tech Database detected a modest increase in buying activity on both daily and weekly readings, though nothing significant. The intermediate reading is just above 42 percent, indicating we are not in territory signaling a meaningful trend change. However, there are faint hints of a possible bottoming pattern emerging, with the database readings gradually rising into the low 20s on the short-term side. Think of it as grassroots activity—the kind of early movement that could eventually develop into something more substantial if it continues, but it is still too soon to call it a definitive reversal.
Iran continues to reject every demand made, and the ongoing strikes on energy assets across the Middle East keep the situation strained. Additional U.S. aircraft carriers have arrived in the region, but their presence hasn’t visibly altered the situation on the ground. The disruption remains significant, and the military posture on both sides indicates this will likely continue without any quick breakthrough.
This week features a busy schedule of economic reports. We have durable goods orders, consumer credit data, and personal income figures coming out, along with CPI on Friday. I don’t expect any of these to show significant deterioration related to the conflict. There might be slight increases in inflation readings, but nothing that will drastically change the overall story. The FOMC meeting is also scheduled, and I wouldn’t anticipate any major news from it. The Fed is essentially limited by a supply-driven inflation problem that rate policy can’t fix, and they are aware of this. Expect the usual language and no surprises.
The main message this week is that we are in a stable to slightly improving technical environment within a still very uncertain macro backdrop. The weekly algorithmic bias is trending slightly higher, which suggests we could see a somewhat firmer tone develop in the equity markets over the next few sessions. However, do not mistake this for an all-clear signal. The overall environment remains characterized by headline-driven chop, low liquidity, and ongoing geopolitical risks. We will monitor these conditions daily and make adjustments as the data and readings evolve.

Economic Releases Calendar
Apr 06
10:00 ET: ISM Non-Manufacturing Index
For: Mar | Trading Impact: High | KR Forecast: 55.0% | Cons: 54.9% | Prior: 56.1%
Apr 07
08:30 ET: Durable Orders
For: Feb | Trading Impact: Medium | KR Forecast: 0.4% | Cons: 0.5% | Prior: 0.0%
08:30 ET: Durable Orders -ex transportation
For: Feb | Trading Impact: Medium | KR Forecast: 0.7% | Cons: 0.5% | Prior: 0.4%
15:00 ET: Consumer Credit
For: Feb | Trading Impact: Low | KR Forecast: $5.5B | Cons: $7.0B | Prior: $8.1B
Apr 08
07:00 ET: MBA Mortgage Applications Index
For: 04/04 | Trading Impact: Low | KR Forecast: NA | Cons: NA | Prior: -10.4%
10:30 ET: EIA Crude Oil Inventories
For: 04/04 | Trading Impact: High | KR Forecast: NA | Cons: NA | Prior: +5.45M
14:00 ET: FOMC Minutes
For: Mar | Trading Impact: Medium | KR Forecast: NA | Cons: NA | Prior: NA
Apr 09
08:30 ET: Personal Income
For: Feb | Trading Impact: High | KR Forecast: 0.4% | Cons: 0.5% | Prior: 0.4%
08:30 ET: Personal Spending
For: Feb | Trading Impact: High | KR Forecast: 0.7% | Cons: 0.6% | Prior: 0.4%
08:30 ET: PCE Prices
For: Feb | Trading Impact: High | KR Forecast: 0.4% | Cons: 0.4% | Prior: 0.3%
08:30 ET: PCE Prices - Core
For: Feb | Trading Impact: High | KR Forecast: 0.4% | Cons: 0.3% | Prior: 0.4%
08:30 ET: Initial Claims
For: 04/04 | Trading Impact: High | KR Forecast: 199K | Cons: 215K | Prior: 202K
08:30 ET: Continuing Claims
For: 03/28 | Trading Impact: High | KR Forecast: NA | Cons: NA | Prior: 1841K
08:30 ET: GDP - Third Estimate
For: Q4 | Trading Impact: Low | KR Forecast: 0.9% | Cons: 0.7% | Prior: 0.7%
08:30 ET: GDP Deflator - Third Estimate
For: Q4 | Trading Impact: Low | KR Forecast: 3.8% | Cons: 3.8% | Prior: 3.8%
10:00 ET: Wholesale Inventories
For: Feb | Trading Impact: Low | KR Forecast: -0.1% | Cons: -0.2% | Prior: NA
10:30 ET: EIA Natural Gas Inventories
For: 04/04 | Trading Impact: Low | KR Forecast: NA | Cons: NA | Prior: +36 bcf
Apr 10
08:30 ET: CPI
For: Mar | Trading Impact: High | KR Forecast: 0.6% | Cons: 0.7% | Prior: 0.3%
08:30 ET: Core CPI
For: Mar | Trading Impact: High | KR Forecast: 0.4% | Cons: 0.3% | Prior: 0.2%
10:00 ET: Factory Orders
For: Feb | Trading Impact: Low | KR Forecast: 0.4% | Cons: 0.5% | Prior: 0.1%
10:00 ET: Univ. of Michigan Consumer Sentiment - Prelim
For: Apr | Trading Impact: High | KR Forecast: 52.5 | Cons: 52.0 | Prior: 53.3
14:00 ET: Treasury Budget
For: Mar | Trading Impact: Low | KR Forecast: -$145.0B | Cons: -$160.0B | Prior: -$307.5B
WaveTech Database
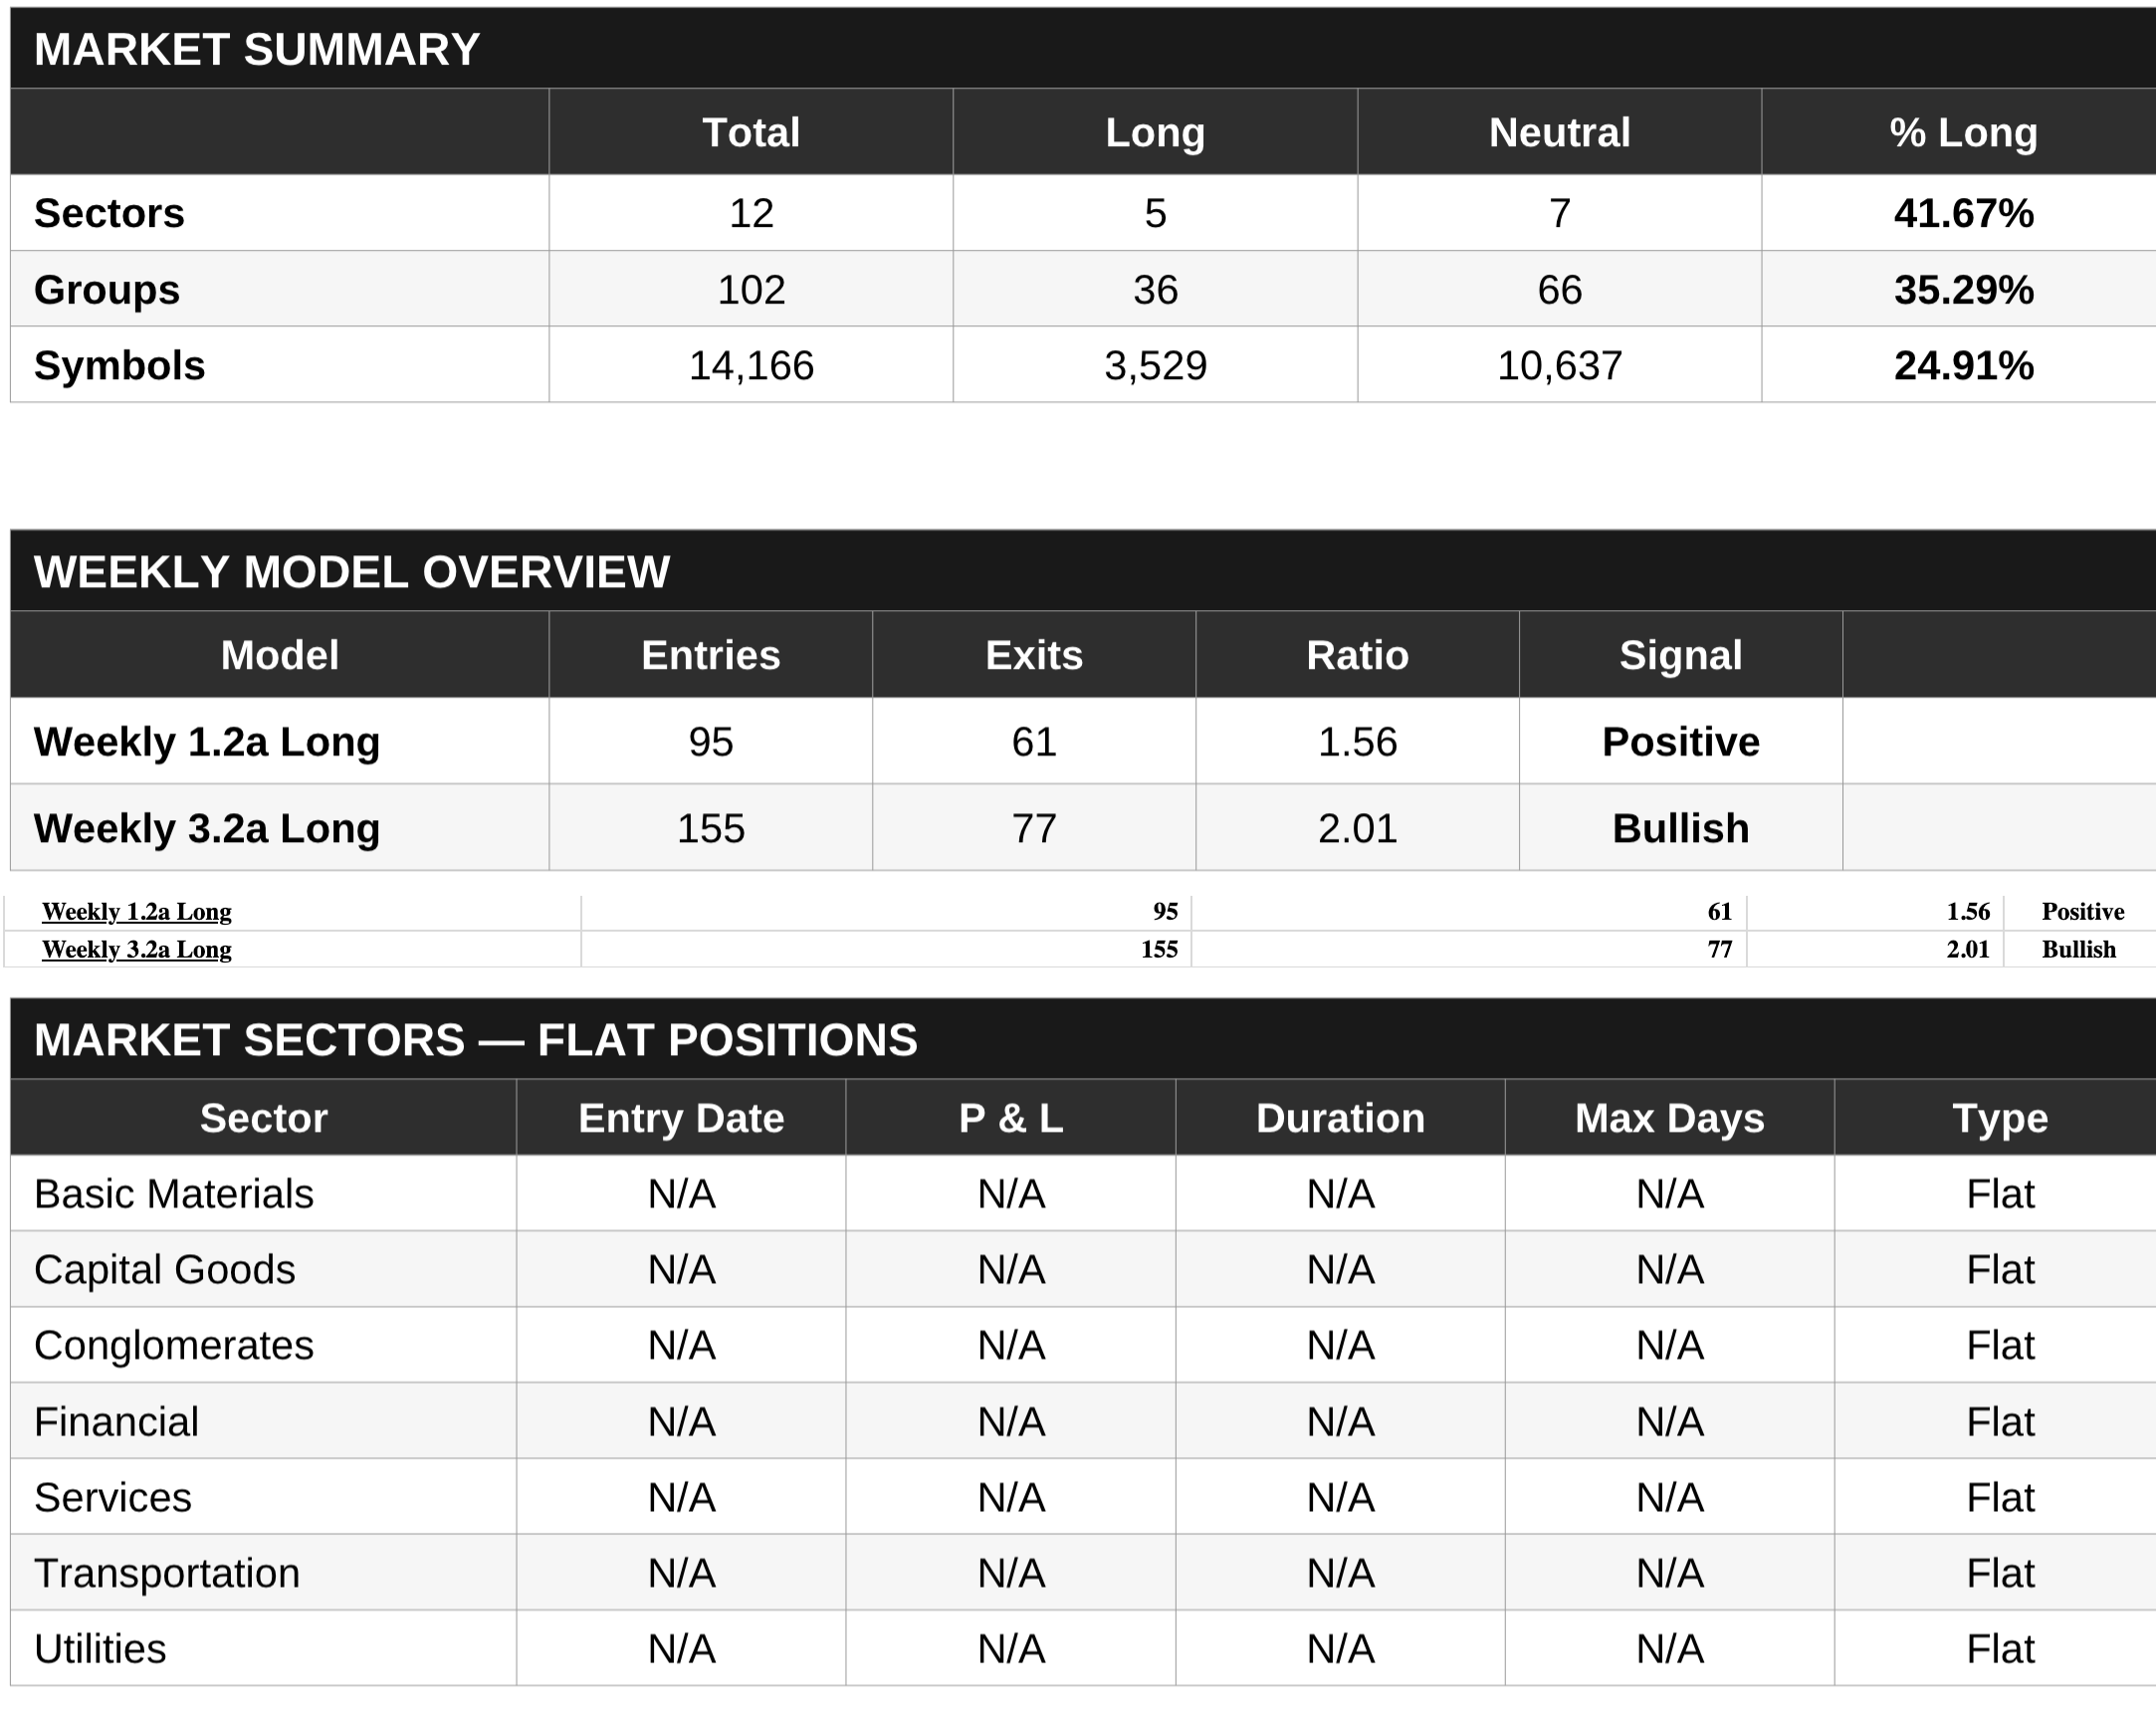
The Wave Tech database currently tracks 14,166 symbols across 12 sectors and 102 industry groups. Of these, 3,529 symbols are long, and 10,637 are neutral, resulting in an overall bullish percentage of 24.91%. At the sector level, 5 out of 12 sectors are long, making up 41.67%, while 36 out of 102 groups are long, or 35.29%. This 24.91% reading on symbols is well below the critical 42% positive rotation threshold and falls within the 22% to 28% neutral-to-negative zone, indicating the broad market lacks the internal breadth needed for sustained upside. Although the market has not broken the 22% full liquidation level—which is positive—it is still far from the 48% to 52% zone of adequate traction or the 58% to 62% confirmed uptrend range.
The Weekly 1.2A Long model shows 95 buys versus 61 exits, resulting in a 1.56 ratio classified as Positive, while the Weekly 3.2A Long model displays 155 buys against 77 exits, giving a 2.01 ratio labeled as Bullish. Combined, these models generate 250 total buy signals versus 138 exits, yielding more than 1.8 new buys for every exit. This is notable because, despite the subdued 24.91% bullish percentage, the models are identifying emerging opportunities at a rate that significantly exceeds the deterioration rate, suggesting that a base-building process may be occurring at the individual symbol level underneath.
All seven tracked market sectors—Basic Materials, Capital Goods, Conglomerates, Financials, Services, Transportation, and Utilities—show completely flat positions, with N/A readings across Entry Date, P&L, Current Duration, Max Days Held, and Type. There are no active buy or sell positions at the sector level, indicating no sector has generated enough internal momentum to trigger a directional commitment. This uniform flatness aligns with the low overall bullish reading and confirms that any symbol-level activity the models are initiating remains dispersed and granular rather than focused on specific sector themes.
The overall outlook shows mixed signals that call for careful patience. The macro breadth indicator indicates the market is in a neutral to slightly negative zone, with the 22% full liquidation level being the primary downside risk. However, the positive buy-to-sell ratios from both models suggest that the likelihood favors a potential upward move in the bullish percentage rather than further decline. Until the 42% threshold is breached and a positive rotation is confirmed, the data suggests we remain cautious, recognizing that individual stock entries are establishing a base, but the broader market has not yet demonstrated sufficient breadth to justify changing our strategic stance.
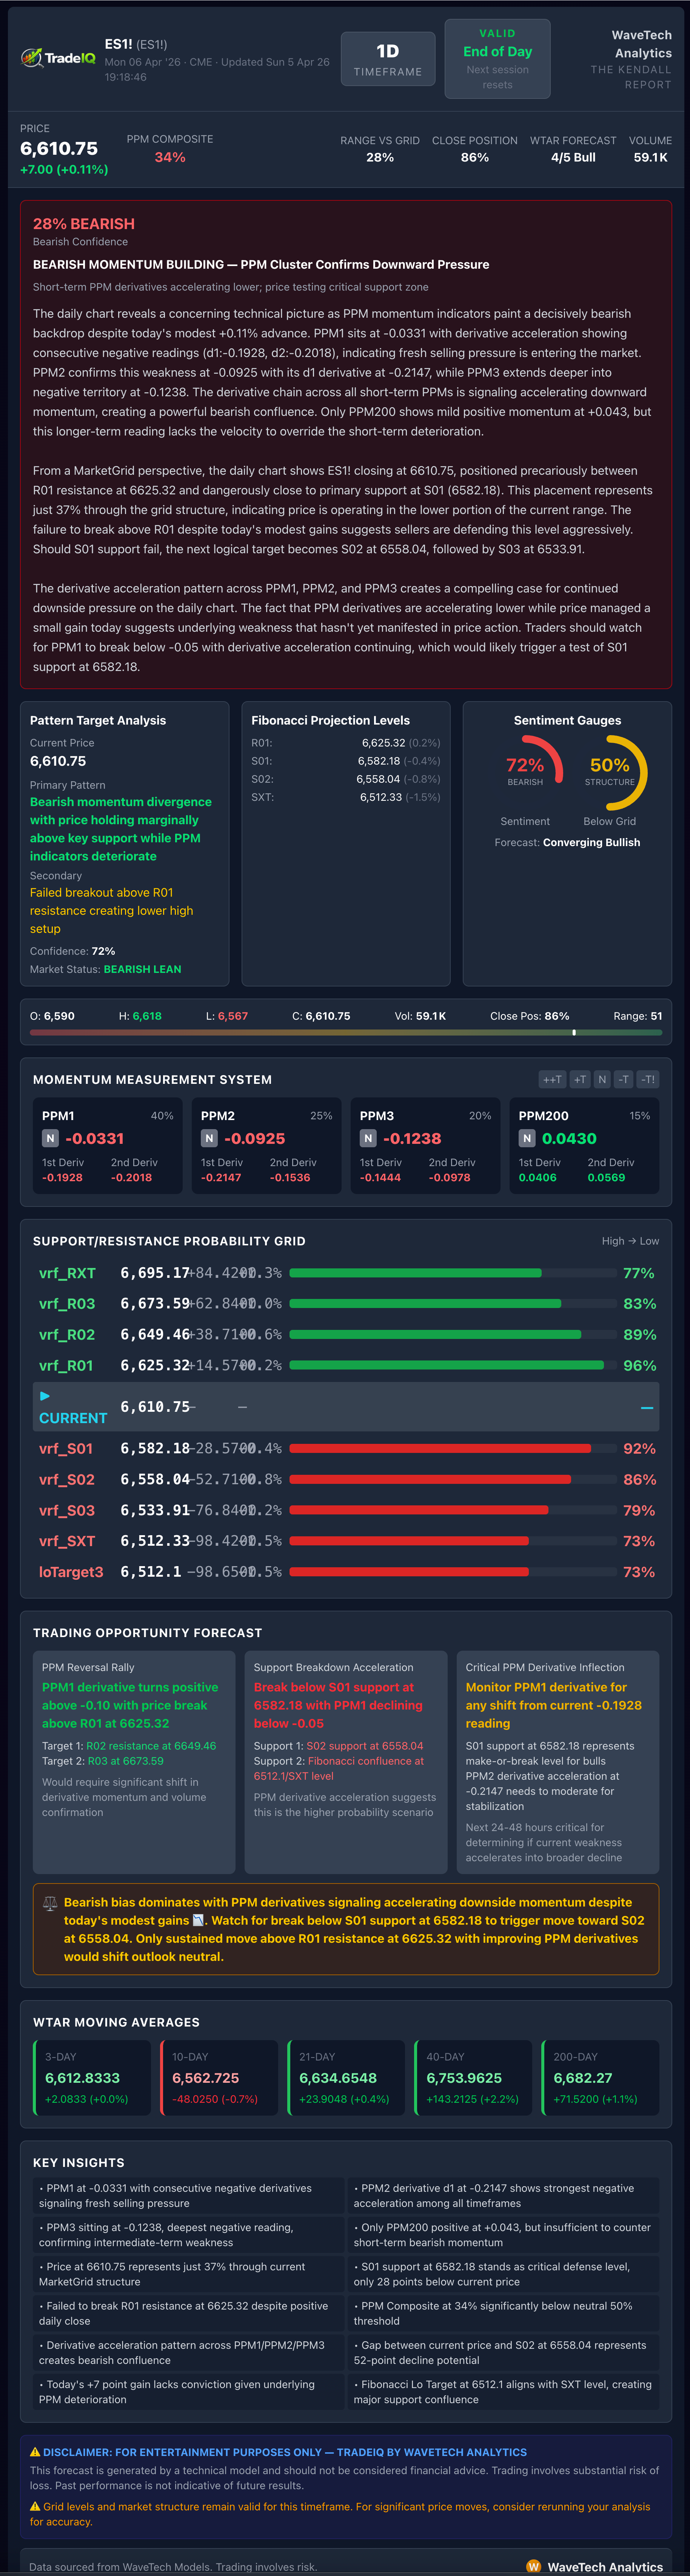
S&P 500 Futures
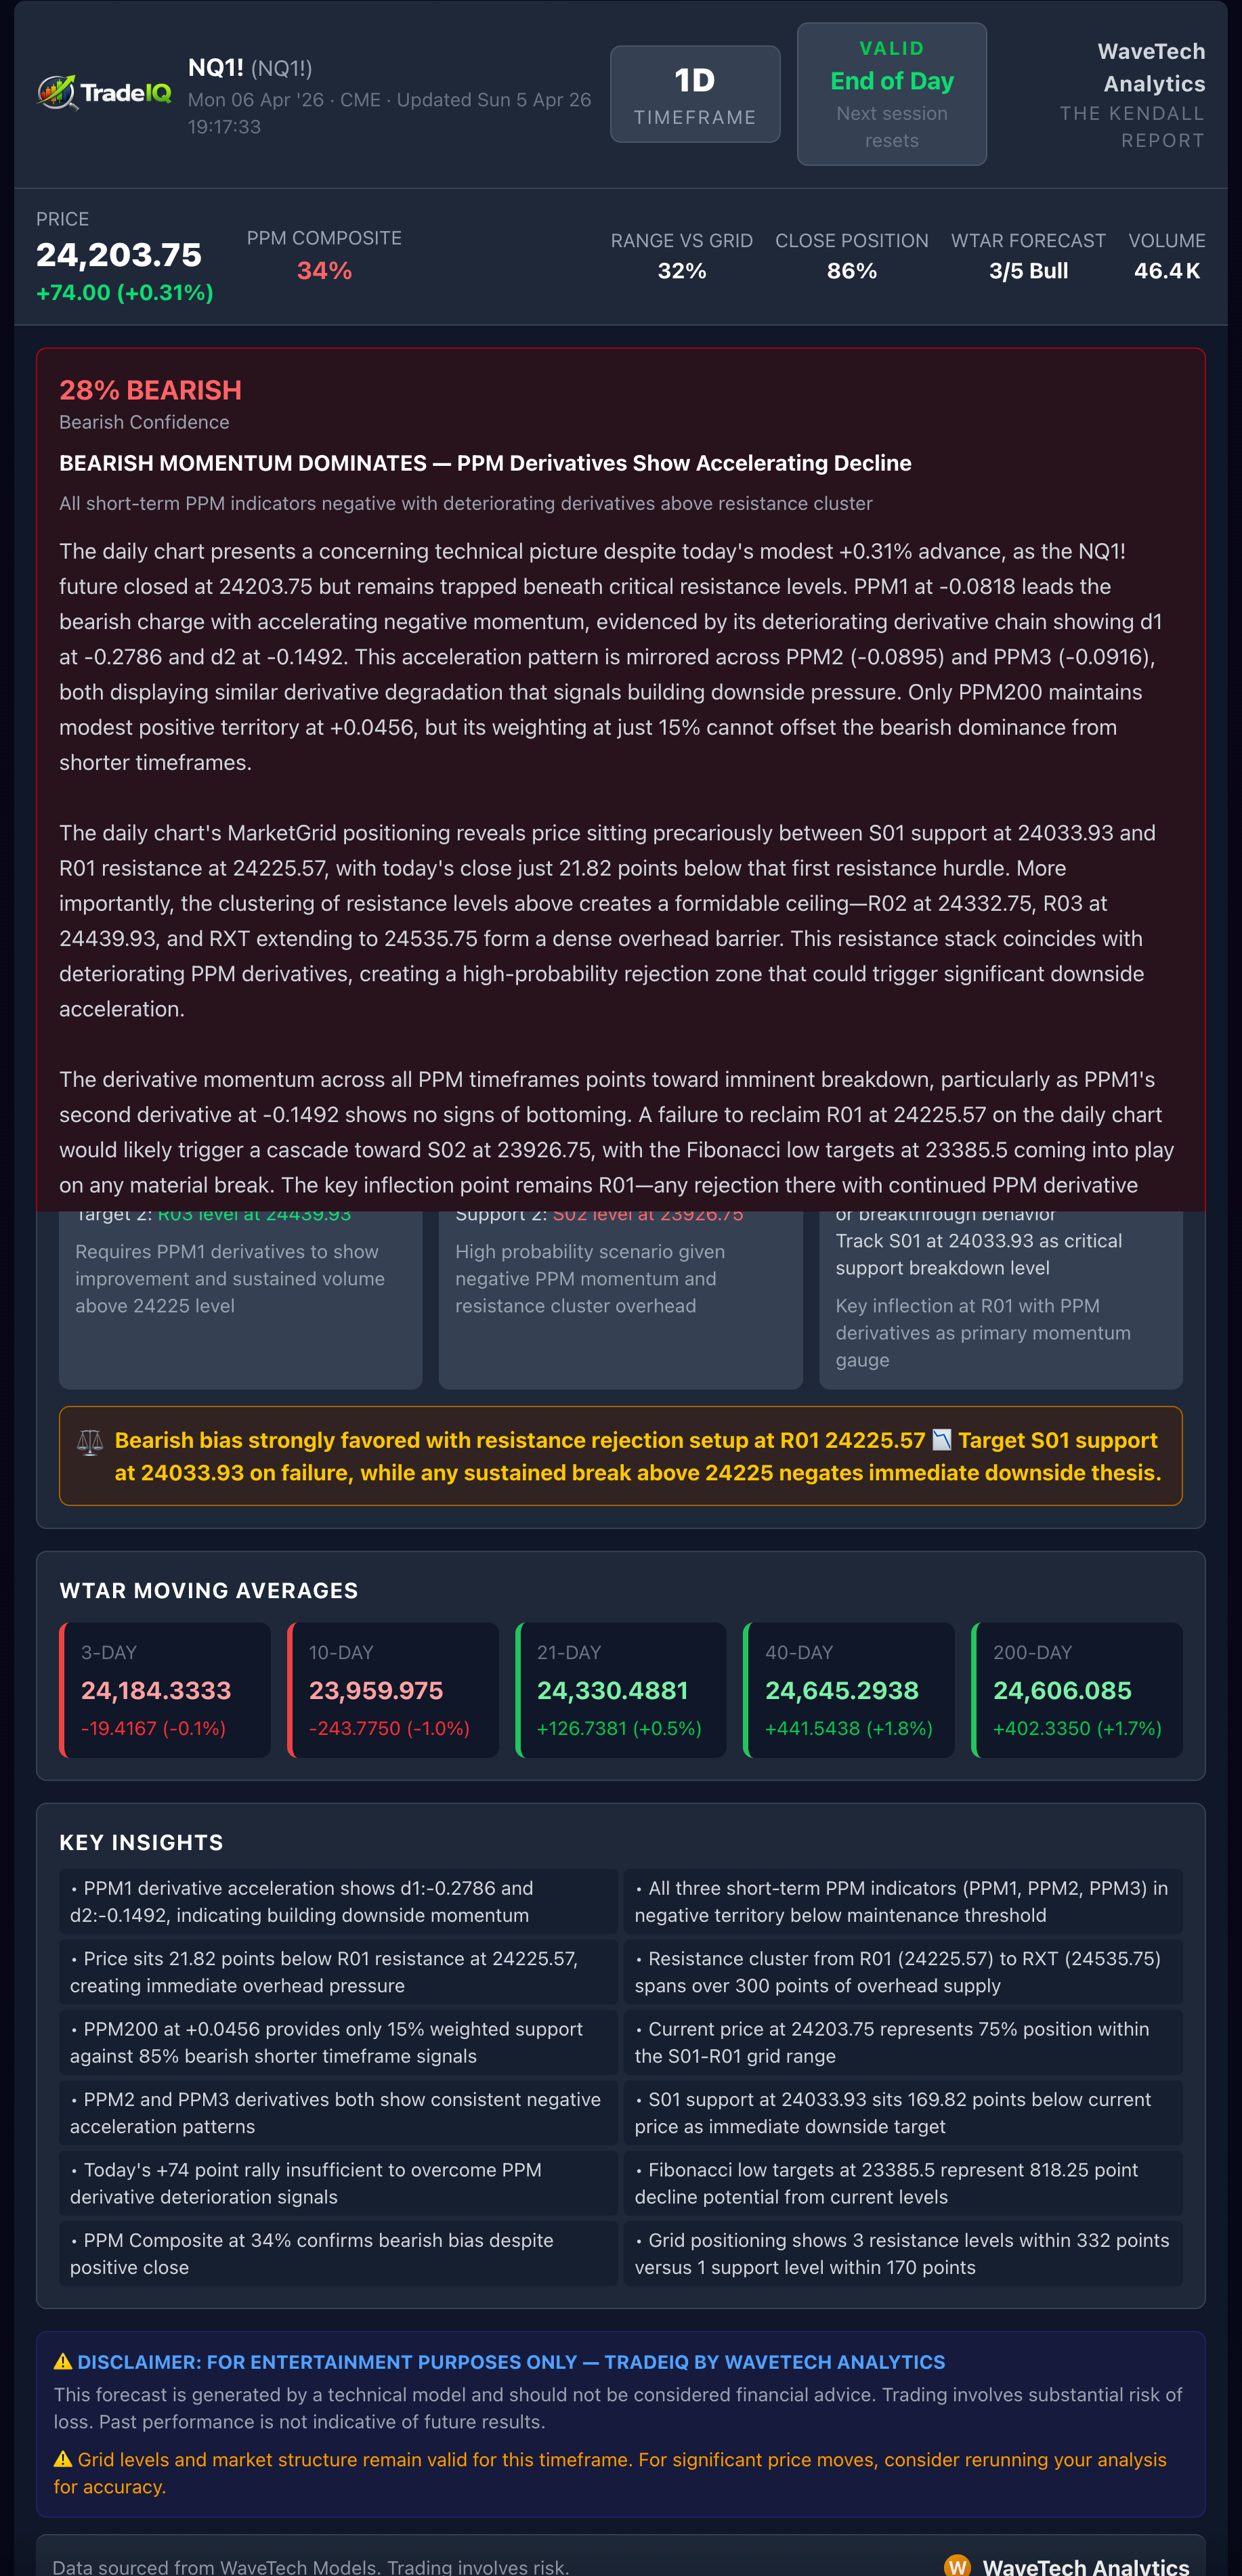
NASDAQ Futures
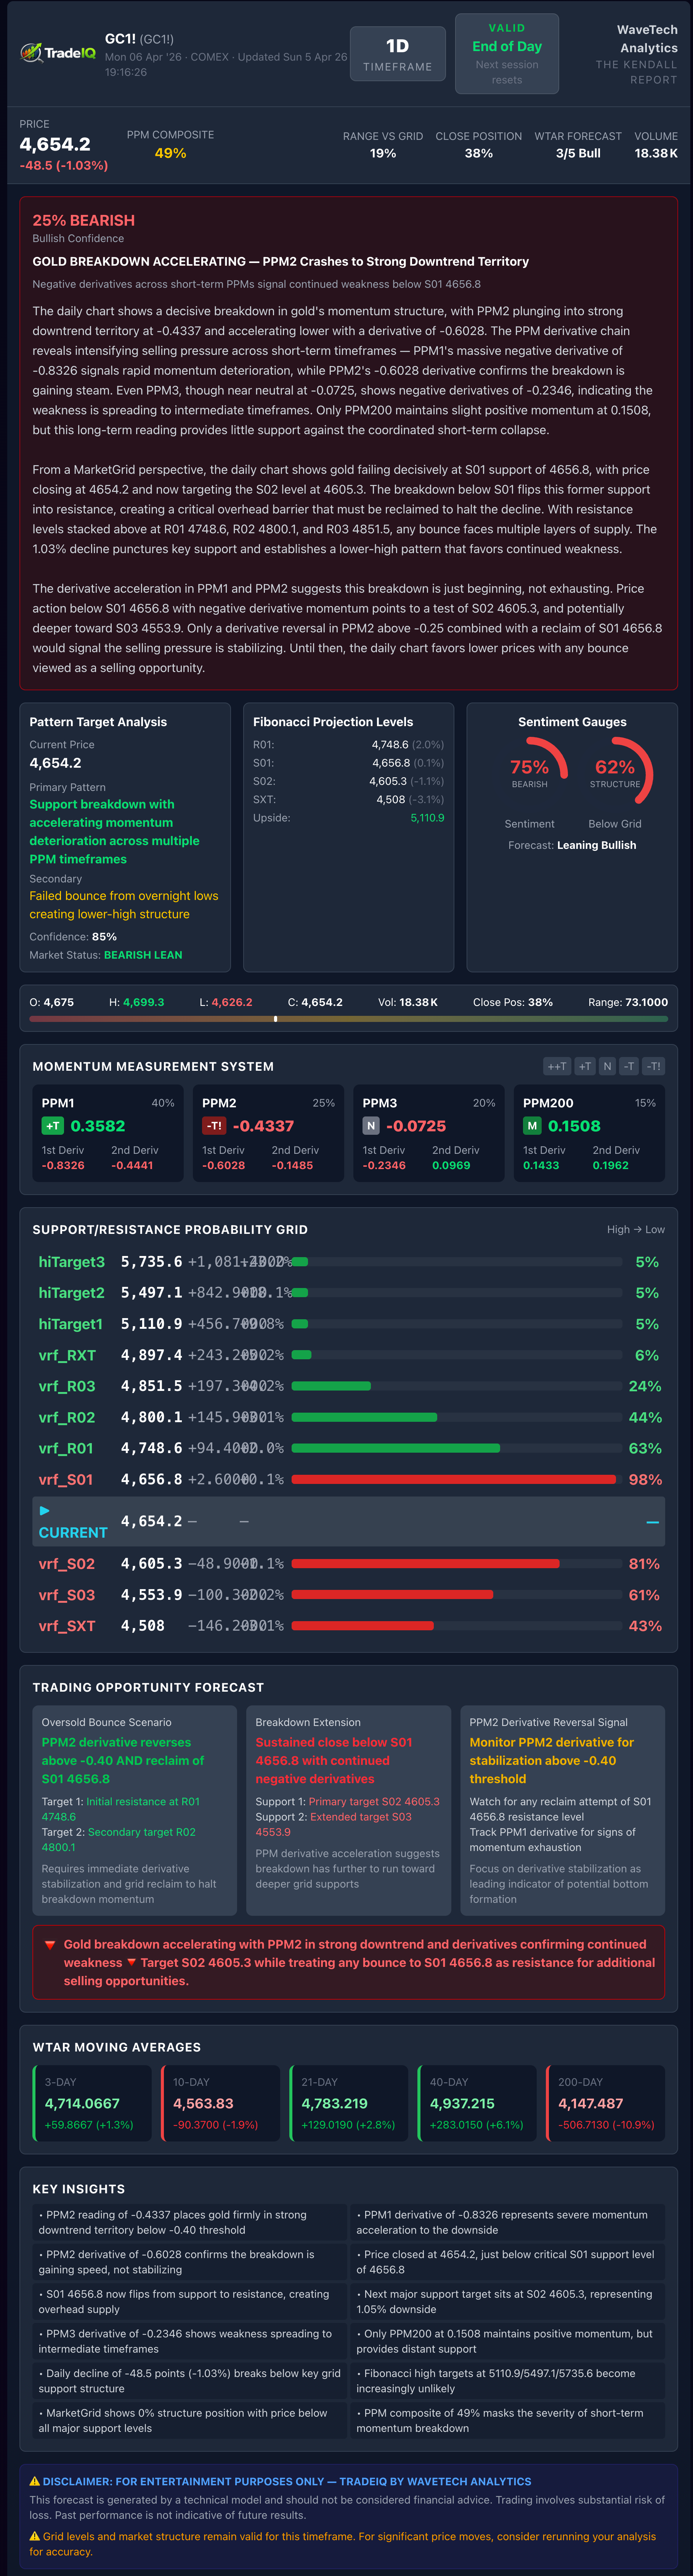
Gold Futures
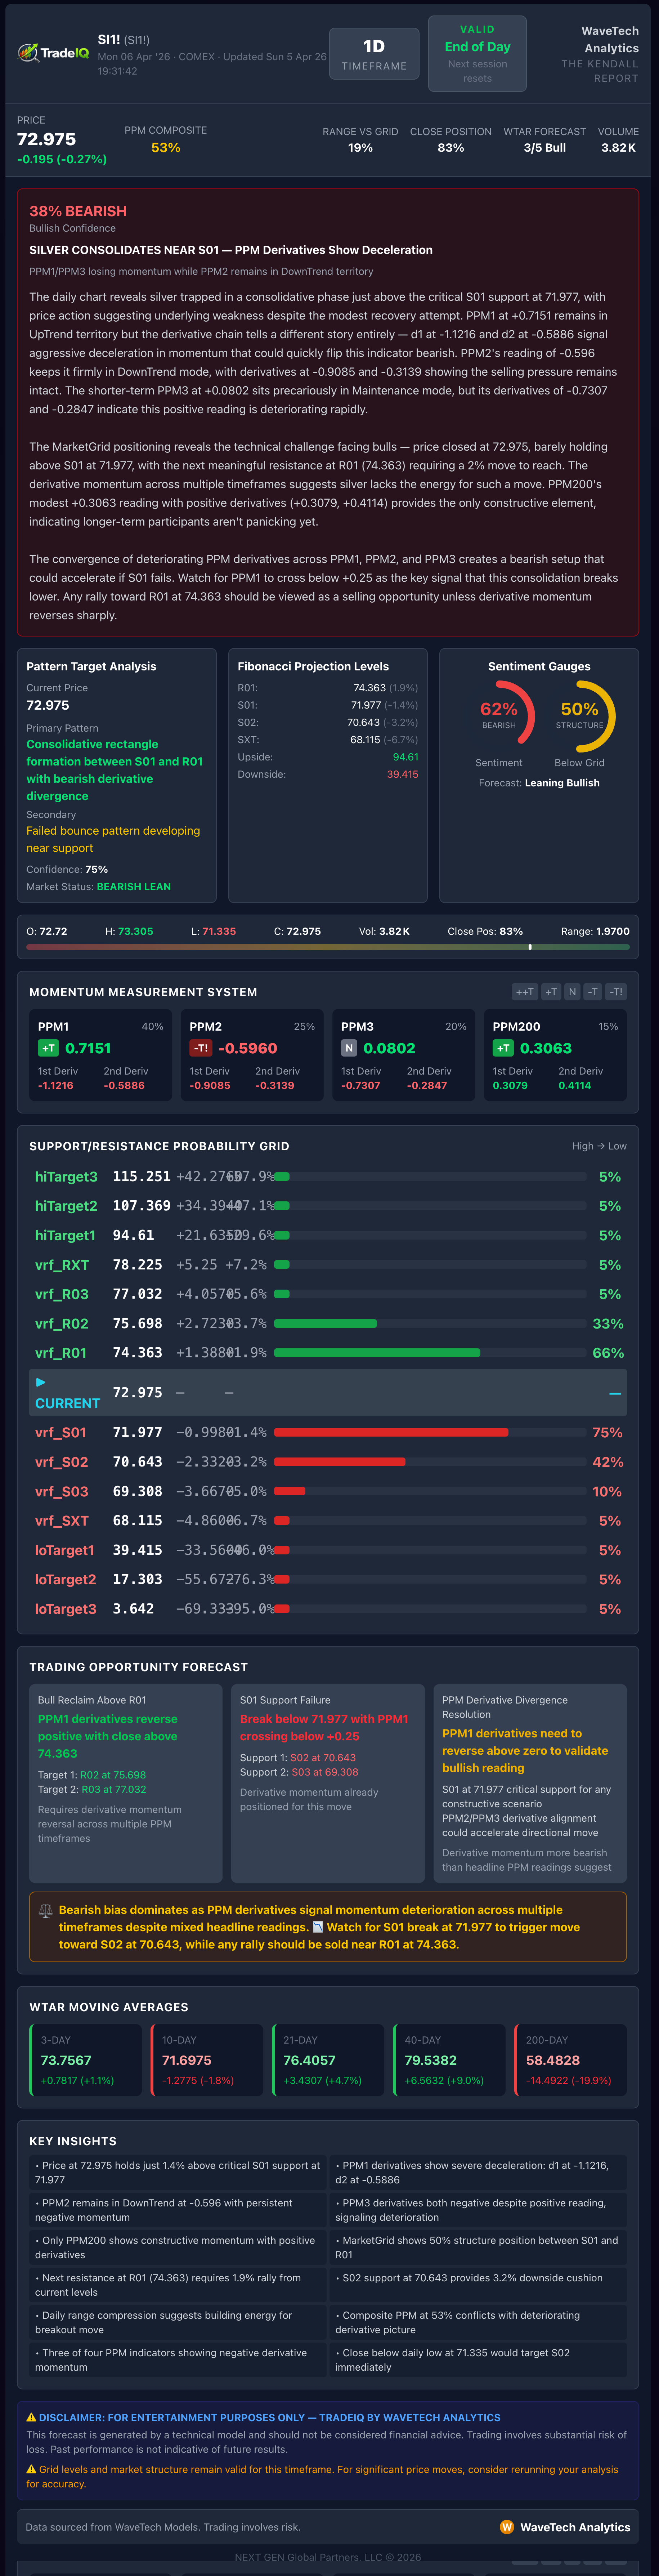
Silver Futures
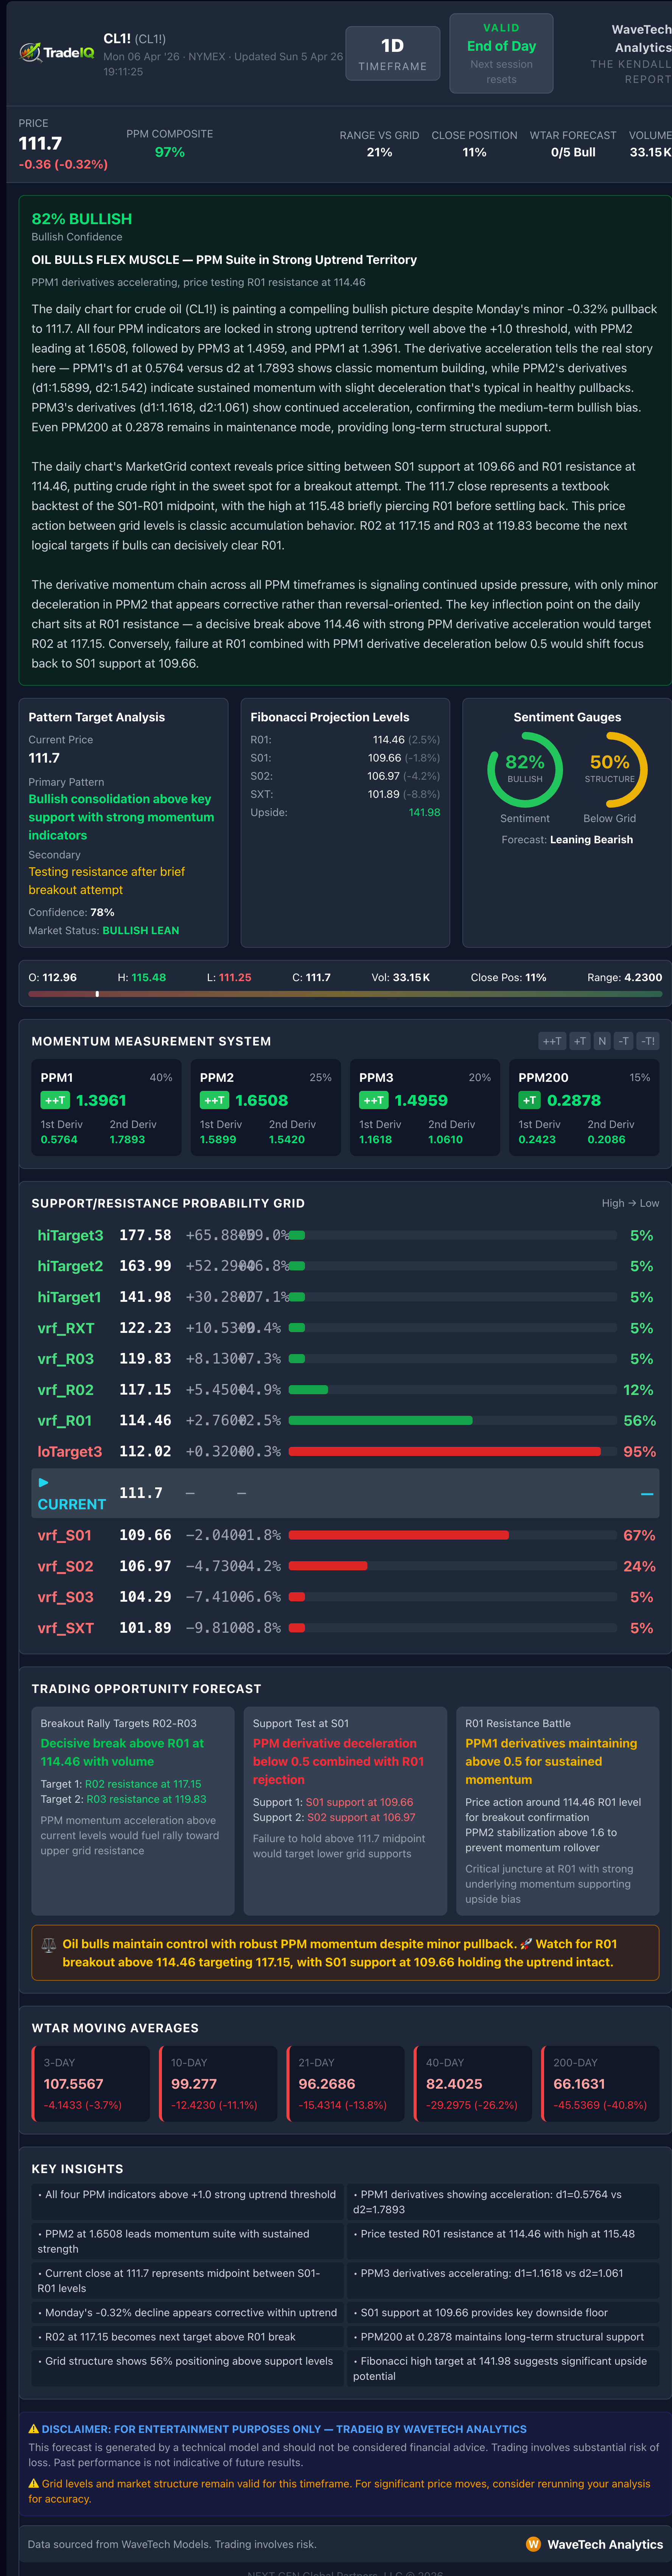
Crude Oil
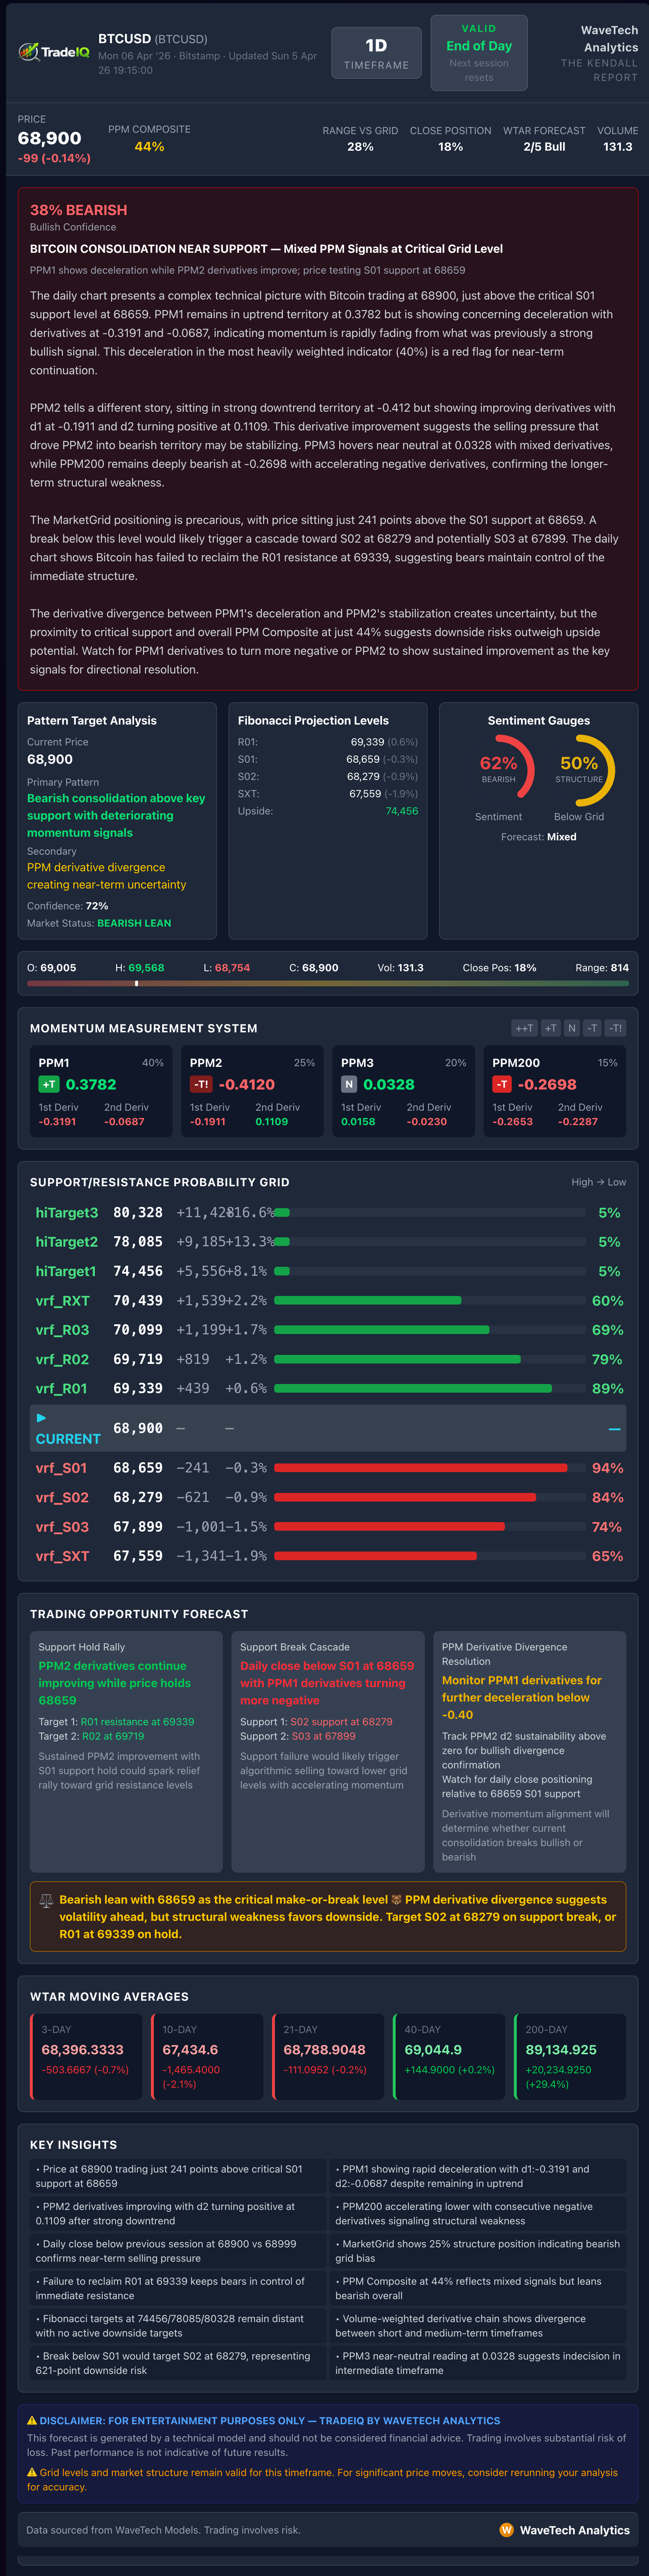
Bitcoin
Robert Kendall
Chief Analyst
“Disclaimer for “The Kendall Report
The information provided in “The Kendall Report” is for general informational and educational purposes only. The opinions, analyses, and forecasts included in this newsletter are based on the author’s personal views and experiences and are provided as is without warranty of any kind.
While we strive to provide accurate and up-to-date information, we do not guarantee the accuracy, completeness, reliability, or timeliness of any information contained in this newsletter. The information presented should not be construed as financial, investment, legal, or other professional advice. It does not constitute a recommendation or endorsement of any particular investment strategy, financial instrument, product, or service.
Investors should consider their financial situation, objectives, and risk tolerance before making investment decisions based on the information provided. The financial market is subject to high risk and volatility. Past performance is not indicative of future results. Investing in the financial market involves the risk of loss, including the loss of principal.
“The Kendall Report” and its contributors will not be liable for any direct, indirect, incidental, consequential, or exemplary damages arising from the use or inability to use the information provided in this newsletter, including but not limited to losses or missed gains.
By accessing and using “The Kendall Report,” you acknowledge and agree to this disclaimer and assume full responsibility for the use of the information provided. We reserve the right to make changes to the content of this newsletter at any time without notice.
This disclaimer is subject to change at our discretion, and it is the reader’s responsibility to review it regularly for any updates.