
Wild Week Ends!
Bitcoin seeks higher levels!

KR Opinion
The market moved modestly on Thursday, a notable contrast to the intense 36-hour period following the election. What was anticipated as one of the year's pivotal weeks delivered significant market developments and a remarkable post-election rally.
The Federal Reserve's 0.25% rate cut aligns with broader expectations of continued measured reductions. Current projections suggest the Fed funds rate will methodically decline to 3.25%, potentially further reducing to 2.75% by late 2025. This reflects a carefully orchestrated approach to monetary policy normalization.
Chairman Powell's communications revealed sophisticated strategic positioning. The Fed is pursuing parallel objectives: normalizing the front end of the yield curve while maintaining Quantitative Tightening (QT). Powell's careful avoidance of discussing QT's impact on long-term yields suggests deliberate compartmentalization in the Fed's approach to different aspects of monetary policy.
Powell offered a nuanced perspective regarding inflation, acknowledging non-linear progress toward targets and suggesting that five-year inflation expectations are only partially fixed at current levels. This represents an evolution from previous characterizations of inflation as "transitory," indicating a more sophisticated understanding of inflation dynamics.
Despite the media's focus on potential tensions between Powell and President-elect Trump, particularly regarding Powell's position, the analysis suggests these concerns may be overstated. The Fed's primary focus remains on achieving a normalized yield curve that supports traditional banking functions, enabling institutions to maintain profitable spreads between short-term borrowing and long-term lending.
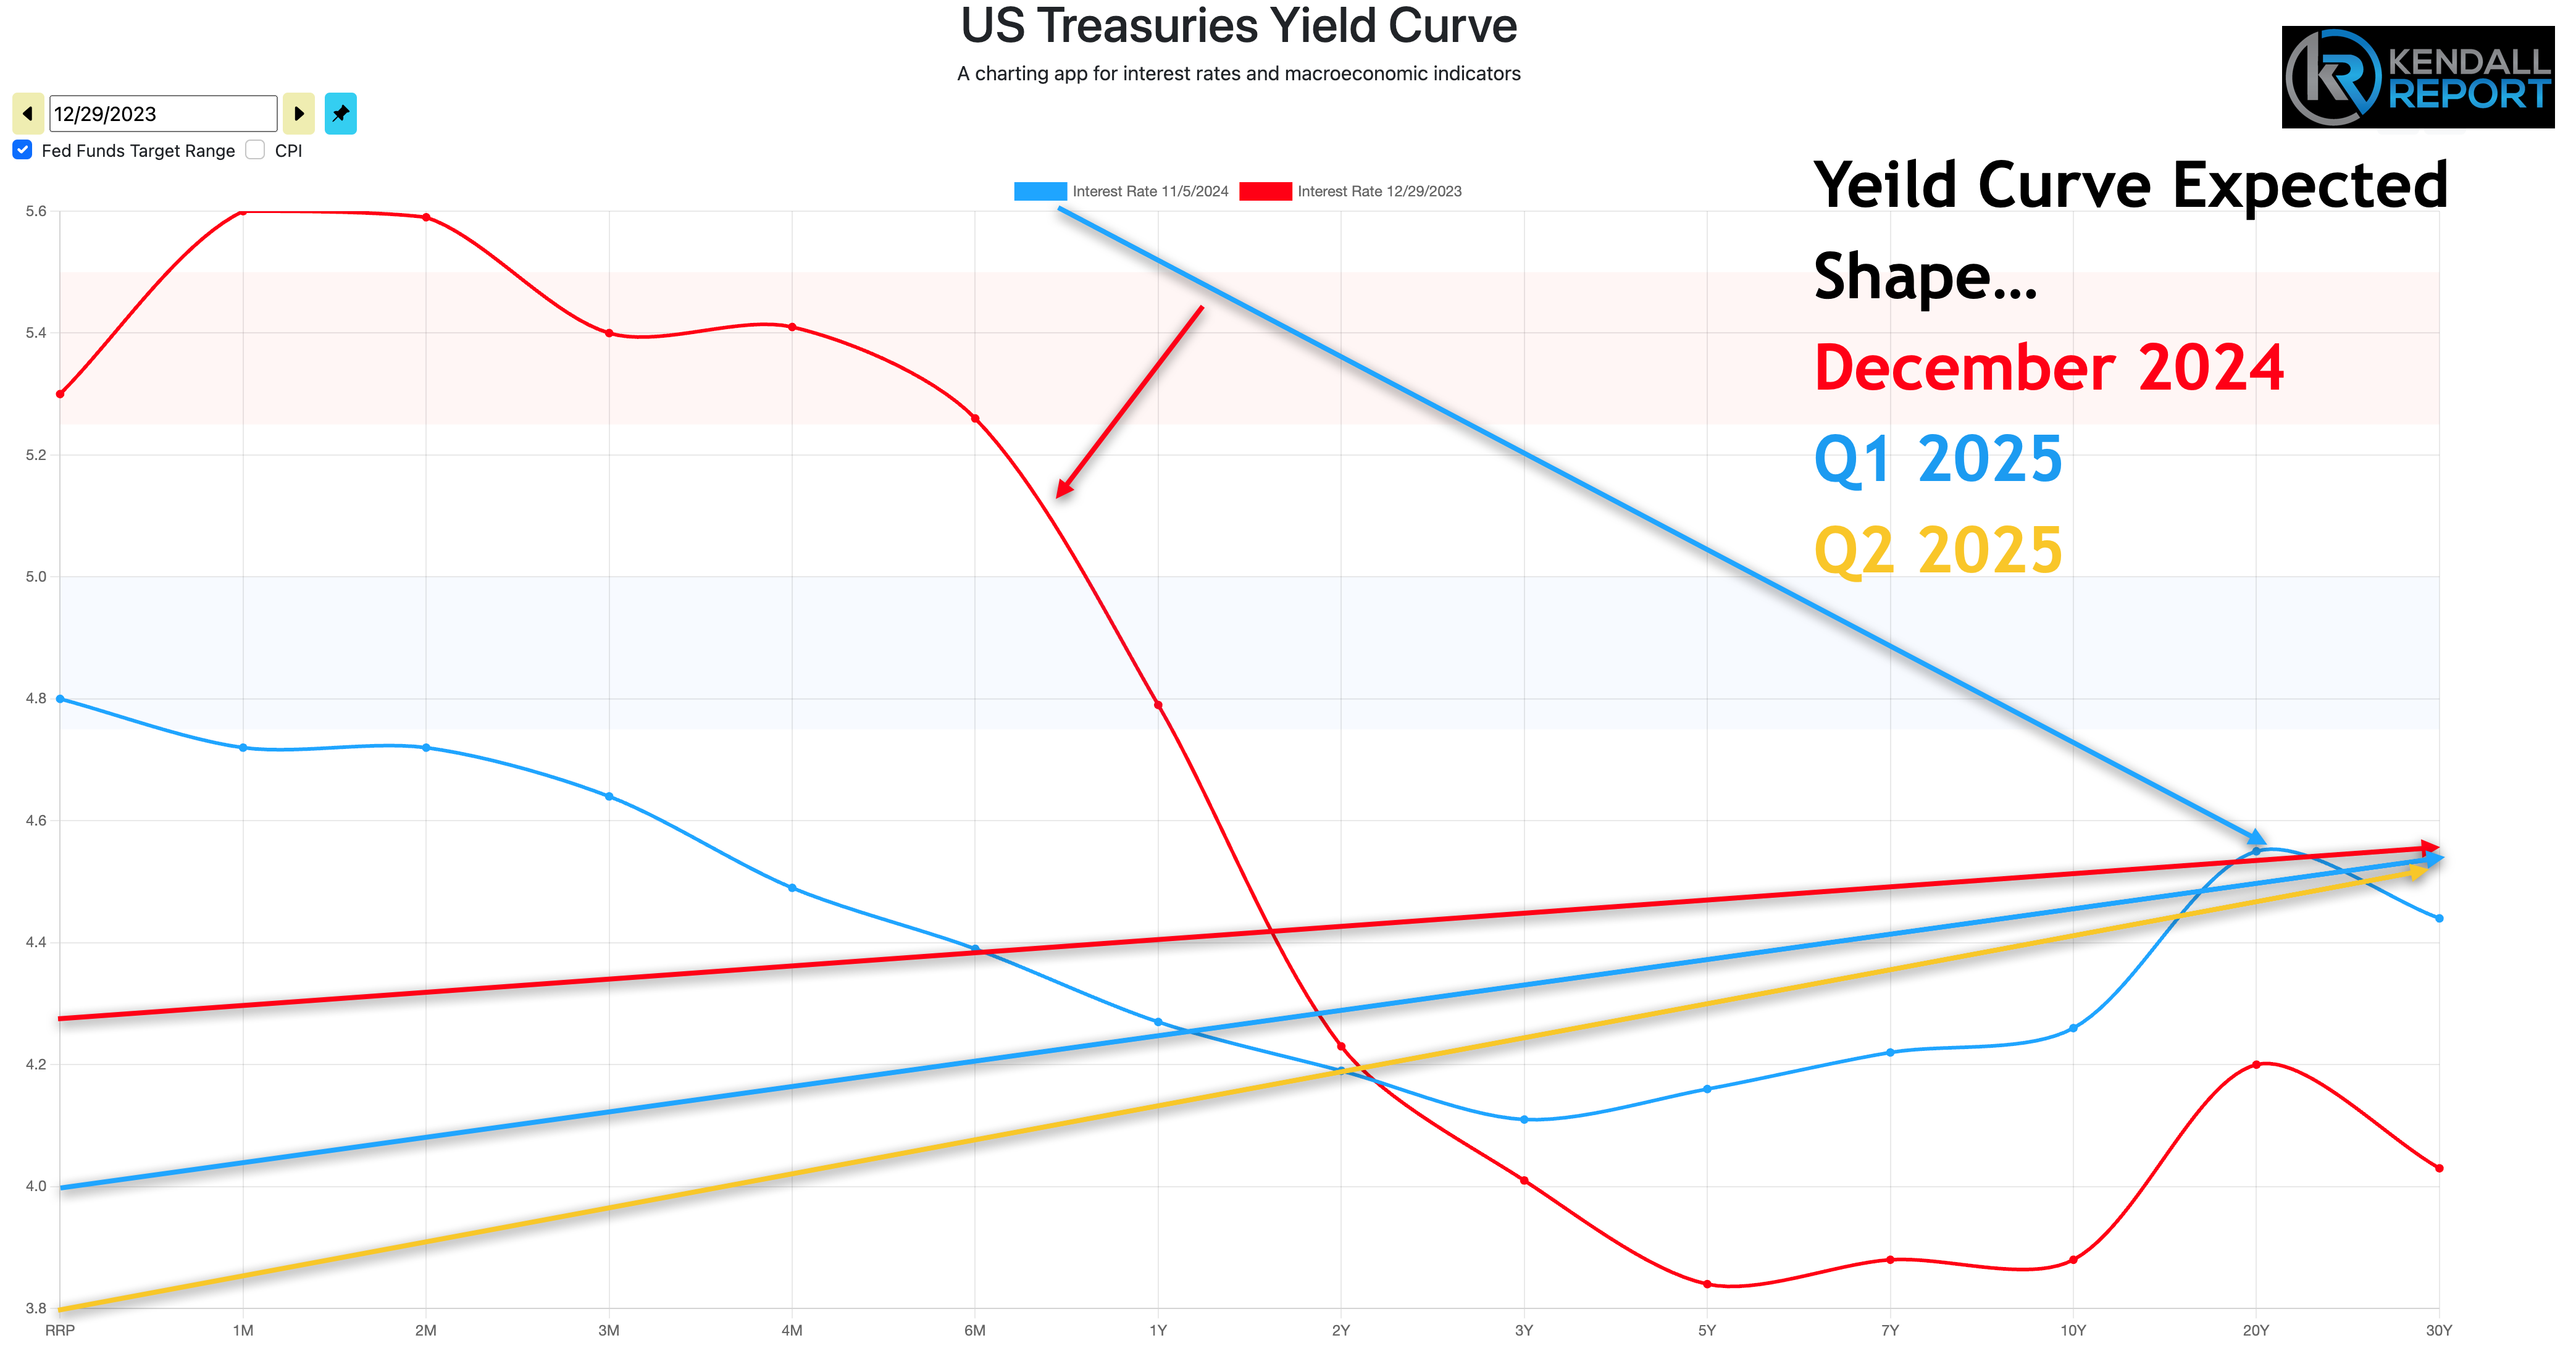
The yield curve is expected to maintain its steepening trajectory. Longer-term rates will likely fluctuate between 3.75% and 4.25%, occasionally testing the 4.50% ceiling or 3.50% floor. This range will respond to economic indicators, market forces, and broader economic conditions.
As markets transition into Friday, attention shifts from this week's significant events toward potential policy implications from the incoming administration. The unusual dynamic of the transition period has created a situation where President-elect Trump's presence and policy positions have begun to overshadow current administrative activities, creating a unique market environment focused increasingly on future policy directions rather than current conditions.
The financial sector appears particularly attuned to forthcoming policy announcements and transition team communications, which are expected to significantly influence market sentiment and trading patterns in the coming weeks.
This heightened sensitivity to political developments adds another layer of complexity to market analysis and investment decisions during this transitional period.
Looking back on Thursday’s Action
Today's financial markets showed significant strength, particularly in technology and growth stocks, as two major indices hit new record highs. The Nasdaq Composite surged 1.5%, the S&P 500 gained 0.7%, and the blue-chip Dow Jones Industrial Average remained unchanged. The small-cap Russell 2000 index took a breather, declining 0.4% following its remarkable 6% rally the previous day.
The day's central focus was the Federal Reserve's monetary policy decision and Chairman Powell's subsequent press conference. The Federal Open Market Committee (FOMC) unanimously voted to reduce interest rates by 25 basis points, setting the new federal funds rate target range at 4.50-4.75%. This decision aligned with market expectations, but what truly energized investors was Powell's careful positioning regarding future policy moves.
In a notably nuanced communication strategy, Powell maintained flexibility in the Fed's approach to monetary policy. By neither confirming nor ruling out the possibility of a December rate cut, he successfully preserved the Fed's options while emphasizing their data-dependent, meeting-by-meeting decision-making process. This measured stance seemed to comfort market participants concerned about potentially hawkish signals.
Powell expressed considerable optimism about current economic conditions and monetary policy effectiveness. When faced with questions about president-elect Trump's proposed policies, he diplomatically sidestepped detailed commentary, explaining that without specific policy proposals, the Fed couldn't meaningfully assess their potential impact. He also firmly addressed questions about his leadership position, stating unequivocally that presidential interference with the Fed chair's position would be illegal.
In the bond market, yields moved notably lower throughout the session, particularly during Powell's press conference. The benchmark 10-year Treasury yield decreased by nine basis points to 4.34%, while the 2-year yield, more sensitive to Fed policy expectations, fell five basis points to 4.22%. This yield movement reflected investors' growing confidence in the Fed's policy approach.
The day's economic data releases provided additional support for market optimism. Weekly jobless claims showed a modest increase to 221,000, staying below consensus expectations of 222,000. The third quarter productivity report revealed a 2.2% increase, slightly below the expected 2.3%, while unit labor costs rose more than anticipated at 1.9% versus the projected 0.5%. These figures suggested continued labor market resilience while showing some moderation in wage pressures.
Market sentiment was further bolstered by momentum from the previous day's post-election rally, with many investors appearing motivated by FOMO (fear of missing out) on potential further gains. However, despite the overall positive tone, major indices closed below their intraday highs, suggesting some profit-taking and consolidation at these record levels.
Nasdaq Composite: +28.4%
S&P 500: +25.2%
S&P Midcap 400: +18.0%
Dow Jones Industrial Average: +16.0%
Russell 2000: +17.5%
Reviewing Thursday’s economic releases:
Weekly Initial Claims 221K (KR Forecast consensus 222K); Prior was revised to 218K from 216K, Weekly Continuing Claims 1.892 mln; Prior was revised to 1.853 mln from 1.862 mln
The key takeaway from the report is essentially the same as last week. Layoff activity remains calm, but for employees who do get laid off, finding a new job is more challenging, a reality consistent with a softening labor market.
Q3 Productivity-Prel 2.2% (KR Forecast consensus 2.3%); Prior was revised to 2.1% from 2.5%, Q3 Unit Labor Costs-Prel 1.9% (KR Forecast consensus 0.5%); Prior was revised to 2.4% from 0.4%
The key takeaway from the report is that productivity growth is helping to keep labor costs in check.
September Wholesale Inventories -0.2% (KR Forecast consensus -0.1%); Prior was revised to 0.2% from 0.1%
Friday's economic calendar features the preliminary November University of Michigan Consumer Sentiment survey at 10:00 ET.
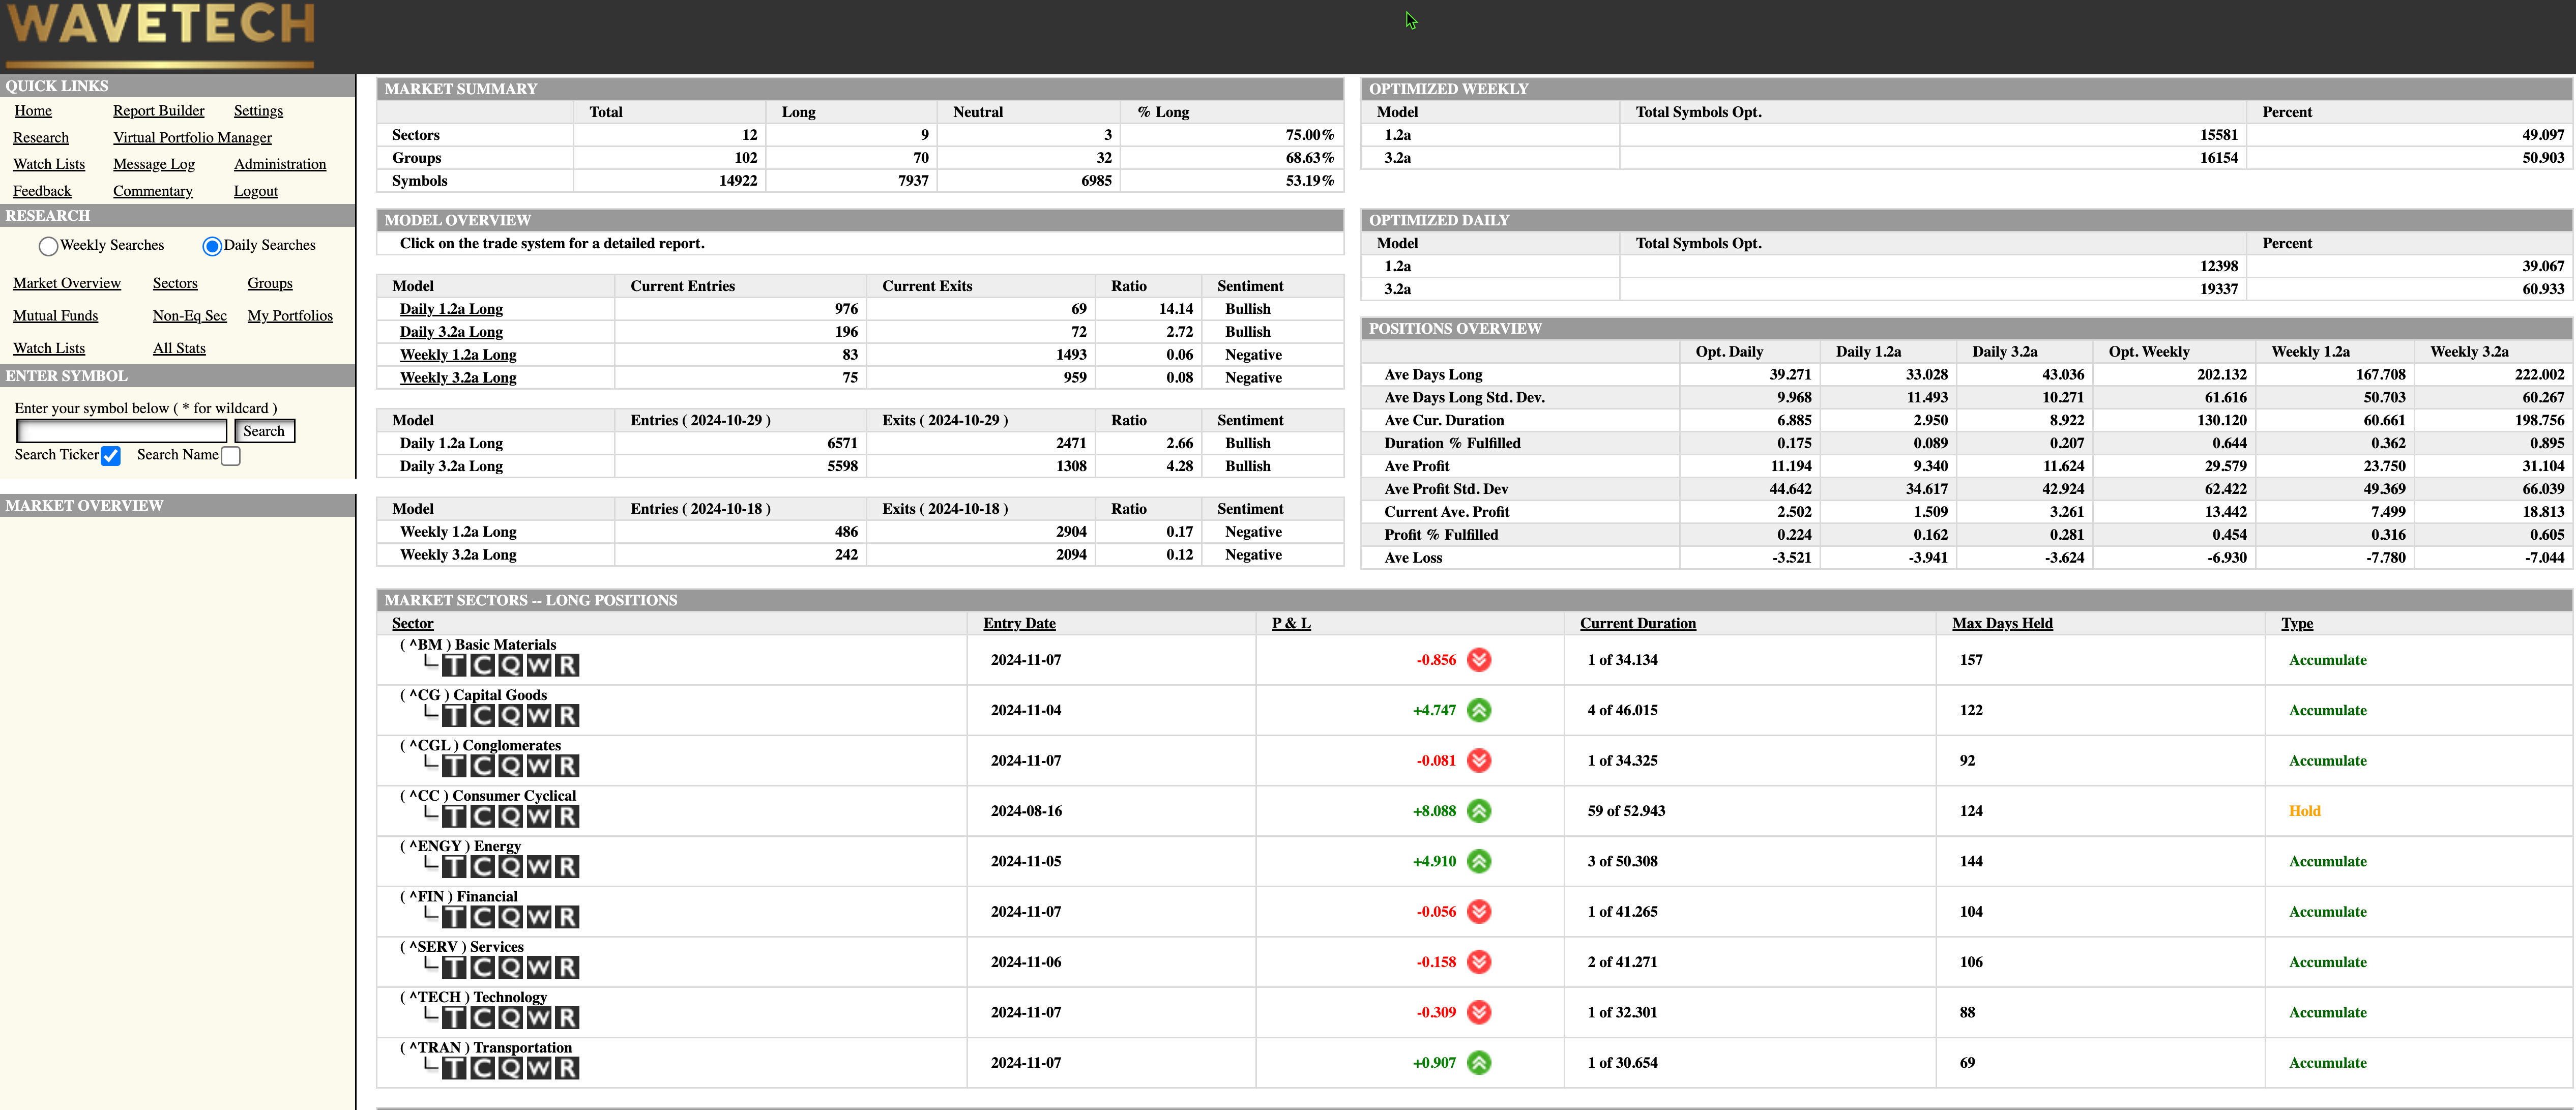
WaveTech Database
The database shows significant short-term momentum, with 1,172 new entries and 141 exits driving the bullish percentage to 53.19%, a dramatic increase from 27.5% just three days ago. This substantial rebound suggests broad market participation, with approximately one-third of the database showing price improvements. Nine sectors are trending positively in the short-term database, indicating widespread market strength.
The intermediate database, scheduled to update after Friday's close, may moderate despite this robust activity. While minor selling pressure could push levels toward 61%, the week's strong performance suggests more stabilization than decline. The unprecedented number of stocks reaching new highs has challenged traditional intermediate database predictions throughout the year.
A fascinating pattern has emerged in bull markets since the 2008 financial crisis. Markets have typically followed a rhythm of two-year rallies followed by 18-month downturns, creating a stair-step pattern upward. However, historical data suggests we might be entering a different paradigm. From 1981 to 1987, markets saw a 229% rally over five years. Even more remarkably, following the 1987 crash, markets experienced an extraordinary 582% gain from 1987 to 2000 without any 20% corrections. Similarly, from 2009 to 2020, it delivered a 400% return.

Current market conditions and projected GDP growth for 2025 suggest we might enter another extended bull market phase, potentially lasting five to seven years without significant (20% or greater) retracements. This theory gains credibility when considering the market reset of 2020, which parallels the 1987 crash in terms of its potential as a launching pad for sustained growth. The 1987 event, despite its catastrophic 40% decline over just three-and-a-half sessions, preceded the longest bull run in modern market history.
As predicted, the current cycle has already materialized the possibility of back-to-back double-digit return years. Looking ahead to 2025 and 2026, continued bullish momentum appears likely as long as the intermediate database remains above 42%. While matching the historic 582% gain from the 1987-2000 period might seem ambitious, evolving market patterns suggest we should consider the possibility of exceptional returns over an extended timeframe.
This analysis departs from recent cyclical patterns, indicating potential structural changes in market behavior. The combination of strong technical indicators, broad market participation, and historical precedent for extended bull markets following major resets provides a foundation for long-term optimism while warranting continued careful monitoring of technical indicators and market breadth measurements.
These observations will be crucial components of the upcoming annual report analysis, particularly in identifying whether traditional market cycles truly give way to new, more sustained growth patterns. The evolution of these trends could fundamentally reshape investment strategies and market expectations for the coming years.
S&P 500 Futures
