
Will PPI Come In Hot?

Attention all members! Join us for an exclusive Master Mind session on our private Discord this Friday, October 12, at 2:00 PM Eastern Time. During this event, I'll share insights on my favorite indicators, demonstrate trade setups, and explain how to leverage these tools to enhance your trading strategies. While space is limited to the first 150 participants, we've sent out detailed access instructions to thousands of our members via email. Don't miss this opportunity to elevate your trading game – we look forward to seeing you there!
KR Opinion
As we approach the week's final trading day, market participants eagerly anticipate the Producer Price Index (PPI) announcement. Expectations are for a moderate increase, with year-over-year figures projected to rise to 2.7%, up 0.3 percentage points from the previous reading. The month-over-month increase is expected to be a more modest 0.2%.
It's crucial to understand the context of these inflation numbers. I've been discussing the possibility of an "echo bounce" in inflation for some time now. This concept was partially validated by the recent Consumer Price Index (CPI) data, which came in slightly higher than expected, albeit by just one tick. While this uptick set a mildly negative tone in the markets, it didn't trigger extreme reactions.
An interesting phenomenon to observe is the selective interpretation of these economic reports. Market participants often focus on specific components that align with their preferred narrative. In this case, the shelter component of the CPI, which has been a primary driver of inflation, showed signs of flattening. This detail encouraged those looking for signs of easing inflationary pressures.
Despite these nuanced inflation readings, the markets have demonstrated remarkable resilience. This robustness is primarily attributed to the prevailing positive trend and a general optimism about the future. Whether this optimism is related to the upcoming election cycle or other factors is debatable, but its impact is undeniable.
The market's ability to shrug off potential headwinds has been impressive. We've seen massive hurricanes, strikes, and other challenging events, yet the market consistently bounces back, often reaching new all-time highs. This resilience is particularly evident in the continued strong performance of high-end tech stocks, which are an unstoppable driving force in the current market environment.
As this pattern persists, it's becoming increasingly clear that the much-discussed "soft landing" scenario for the economy is materializing. This realization is likely to keep market sentiment buoyant for the foreseeable future.
Regarding Federal Reserve policy, there's been a noticeable shift in market expectations. The view I've been sharing for some time - that November could be a "skip" meeting with no rate change - is gaining traction. The consensus is building around a 0.25% rate cut in December, followed by similar cuts in subsequent meetings through Q2 and possibly into Q3 of 2025.
However, it's important to note that challenges lie ahead. As we look towards 2025, particularly in Q2, we may face economic headwinds related to real estate and other sectors. These potential obstacles will require careful navigation and could influence market dynamics.
In conclusion, while the immediate focus is on the upcoming PPI data, the broader picture shows an optimistic and resilient market. The evolving inflation narrative and changing expectations about Fed policy continue to shape the economic landscape. As we move forward, monitoring both the headline economic data and the underlying trends that drive market sentiment and monetary policy decisions will be crucial.
To gain a more comprehensive understanding of inflation trends, it's crucial to look beyond the commonly reported year-over-year and month-over-month changes in the Consumer Price Index (CPI) and Producer Price Index (PPI). Instead, examining the actual index values of these measures can provide deeper insights into the underlying trends and trajectories of inflation.
While a 2% annual growth rate in these indices might sound modest, it represents a substantial increase when viewed in the context of long-term trends. This perspective is often overlooked when focusing solely on percentage changes.
Looking at the PPI chart since 2010, we can observe several distinct trend periods:
1. 2010-2015: This period showed a steady upward trend in the index.
2. 2015-2020: The trend softened slightly. This aligns with the period when the Federal Reserve struggled to boost inflation to meet its target.
3. 2020-Present (blue line): The index accelerates sharply, reflecting the recent significant inflation surge. While the rate of increase has moderated somewhat, forming a plateau, it's important to note that this "flattening" is occurring much higher than previous trends.
If maintained, the current trajectory could eventually bring the index back in line with long-term trends. The Federal Reserve likely considers this scenario in its policy deliberations.
However, the forecast (indicated by the red arrow in your chart) suggests that these numbers may grow even faster in the coming periods. This projection implies that inflation may not be as "under control" as some interpretations of the data might suggest.
If we look at the year-over-year forecast numbers, inflation projections rise to around 3.5%. This is significantly above the Federal Reserve's 2% target and higher than many market participants might expect.
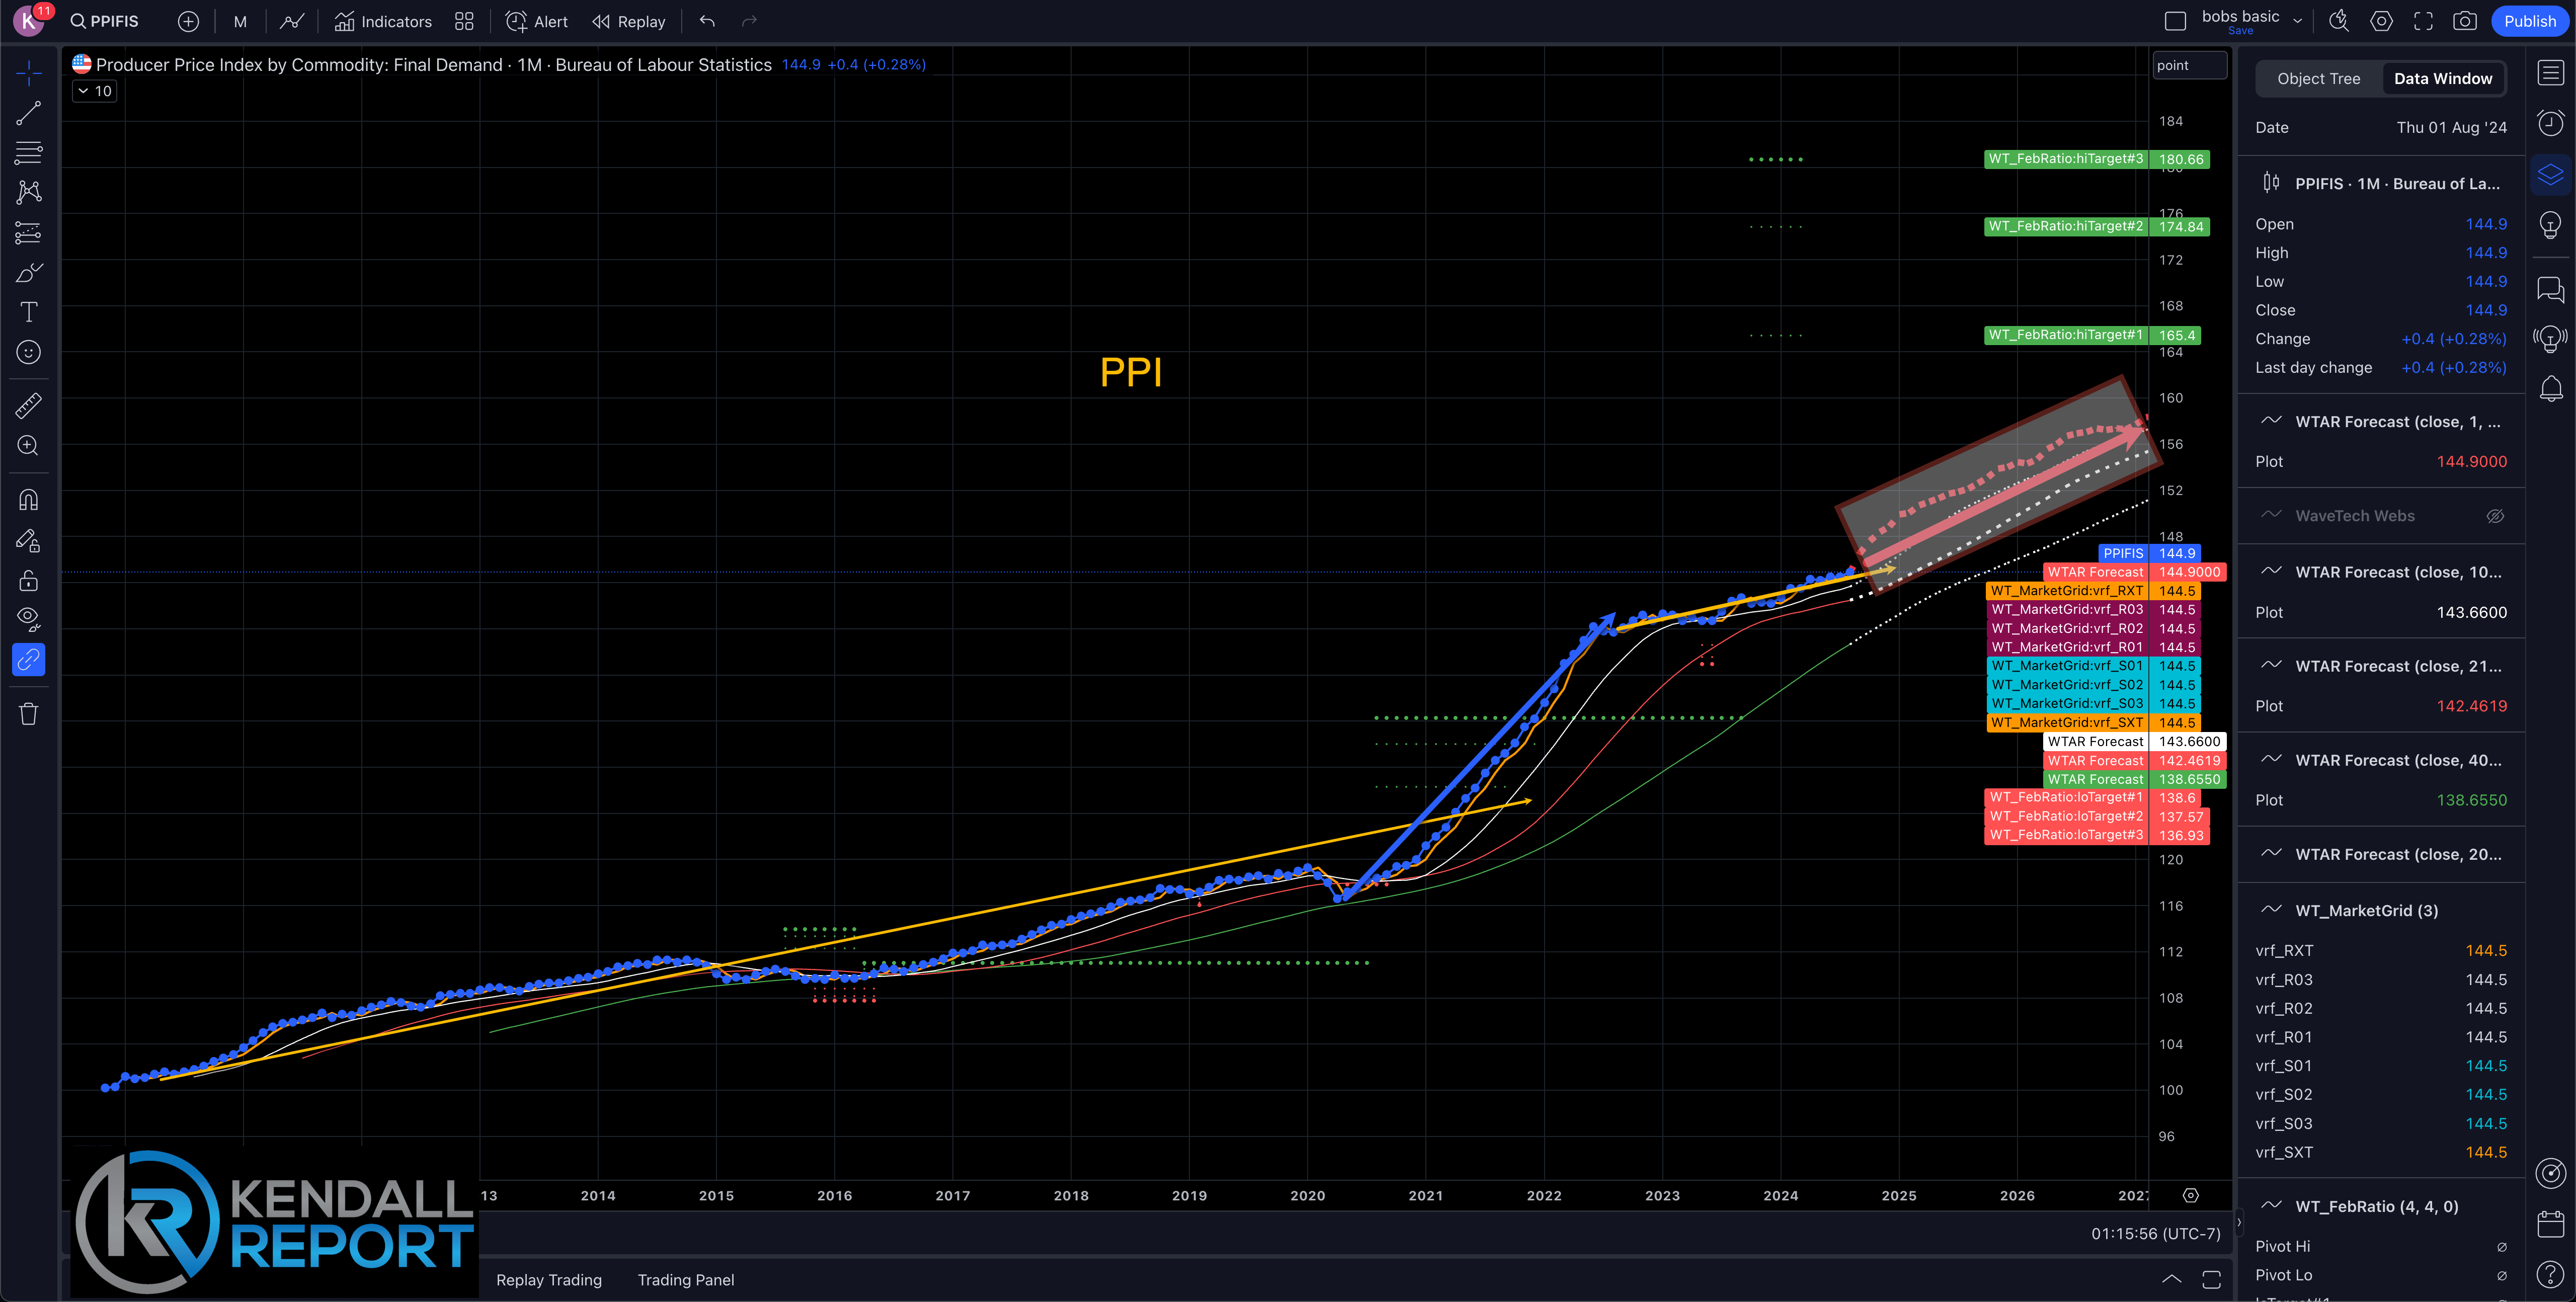
It's essential to maintain this perspective: inflation is not disappearing. In fact, the current pace of price increases is notably sharper than what we've observed in previous decades.
Even if moderated from recent peaks, this persistent inflationary pressure represents a significant shift from the low-inflation environment that characterized much of the past decade.
This more nuanced view of inflation trends underscores the importance of looking beyond headline numbers. It suggests that policymakers and market participants should remain vigilant about inflationary pressures for an extended period. The implications of this sustained higher inflation trajectory could be far-reaching, potentially affecting everything from monetary policy decisions to long-term investment strategies and economic planning.
In conclusion, while current discussions often focus on inflation moderating, a deeper analysis of the actual price indices reveals a more complex and potentially concerning picture. Even if slower than the recent peak, the sharp upward trajectory of prices represents a significant departure from historical norms and warrants continued close attention from all economic stakeholders.
Looking back on Thursday’s action
The equity market experienced a negative bias throughout Thursday's session, characterized by below-average trading volume. Despite the downward pressure, losses were relatively contained.
The equal-weighted S&P 500 declined by 0.4%, while its market-cap-weighted counterpart fell by 0.2%, indicating a slightly more pronounced impact on smaller companies within the index.
Market participants reacted largely to a mixed bag of economic data released during the day. The September Consumer Price Index (CPI) report came in hotter than anticipated, both at the headline and core levels. The headline CPI showed a 0.2% increase (versus an expected 0.1%), while core CPI rose by 0.3% (compared to the expected 0.2%). On a year-over-year basis, core CPI ticked up to 3.3% from August's 3.2%, while headline CPI decelerated slightly to 2.4% from 2.5% in August.
A silver lining in the CPI report was the shelter component, which has been a primary driver of core inflation. Since June, it registered its smallest increase (+0.2%), potentially signaling some easing in housing-related inflationary pressures.
In addition to the CPI data, investors digested the weekly jobless claims report, which showed an increase to 258,000 from the previous week's 225,000. This uptick in unemployment claims adds another layer to the complex economic picture.

Despite the hotter-than-expected inflation data, market sentiment regarding the Federal Reserve's next move remained largely unchanged. The CME FedWatch Tool indicated an 82.9% probability of a 25 basis point rate cut at the November FOMC meeting, slightly up from 80.3% the previous day and a more significant increase from
67.9% a week ago. Atlanta Fed President Bostic's comments further bolstered this optimism, suggesting an openness to skipping a November rate hike.
The Treasury market reacted to the morning's data with a mixed performance. The 10-year yield climbed three basis points to settle at 4.10%, while the 2-year yield dipped two basis points to 4.00%. This flattening of the yield curve reflects the market's evolving expectations about future economic conditions and monetary policy.
Oil prices saw a significant rebound in the commodities market, with WTI crude futures settling 3.5% higher at $75.86 per barrel. This surge in oil prices boosted the S&P 500 energy sector, which closed up 0.8%.
Sector performance was mixed, with only information technology (+0.1%) and materials (+0.2%) joining energy in positive territory. The real estate sector was the day's biggest laggard, dropping 0.9%, followed by communication services, which fell 0.6%.
Overall, the day's trading reflected a cautious market digesting complex economic data and recalibrating expectations for future Fed actions. The modest declines on below-average volume suggest a market pausing to reassess rather than reacting dramatically to the latest information.
· Nasdaq Composite: +21.8% YTD
· S&P 500: +21.2% YTD
· Dow Jones Industrial Average: +12.6% YTD
· S&P Midcap 400: +11.6% YTD
· Russell 2000: +8.0% YTD
Thursday's economic data releases provided a mixed picture of the U.S. economy, with some unexpected employment and inflation figures developments.
The Weekly Initial Claims report showed a significant jump to 258,000, considerably higher than the KR Forecast consensus of 229,000 and up from the prior week's 225,000. Weekly Continuing Claims also increased to 1.861 million, up from the revised previous figure of 1.819 million.
A key takeaway from the jobless claims report is the notable increase in initial claims. While Hurricane Helene likely played a role in this spike, it doesn't fully account for the increase. On an unadjusted basis, initial claims rose by 53,570 to 234,780. The Department of Labor had anticipated a seasonal increase of only 23,665, suggesting other factors are at play in the labor market softening.
The September Consumer Price Index (CPI) data also exceeded expectations. Headline CPI increased by 0.2%, matching the prior month's figure but above the KR Forecast consensus of 0.1%. Core CPI, which excludes volatile food and energy prices, rose by 0.3%, also exceeding the KR Forecast consensus of 0.2% and matching the previous month's increase.
A significant takeaway from the CPI report is that the year-over-year core rate increased despite the shelter component, which has been the primary driver of core inflation, recording its smallest increase (+0.2%) since June. This suggests that inflationary pressures are broadening beyond housing costs.
Looking ahead to Friday, the economic calendar features more inflation data with the release of the September Producer Price Index (PPI). Expectations are for a 0.2% increase month-over-month, with the year-over-year rate projected to rise to 2.7%, up from the prior reading of 2.4%. This data will be released at 8:30 ET.
Additionally, the preliminary October University of Michigan Consumer Sentiment survey will be published at 10:00 ET. It will provide insights into consumer attitudes and expectations, which can be crucial indicators of future economic activity.
WaveTech Database
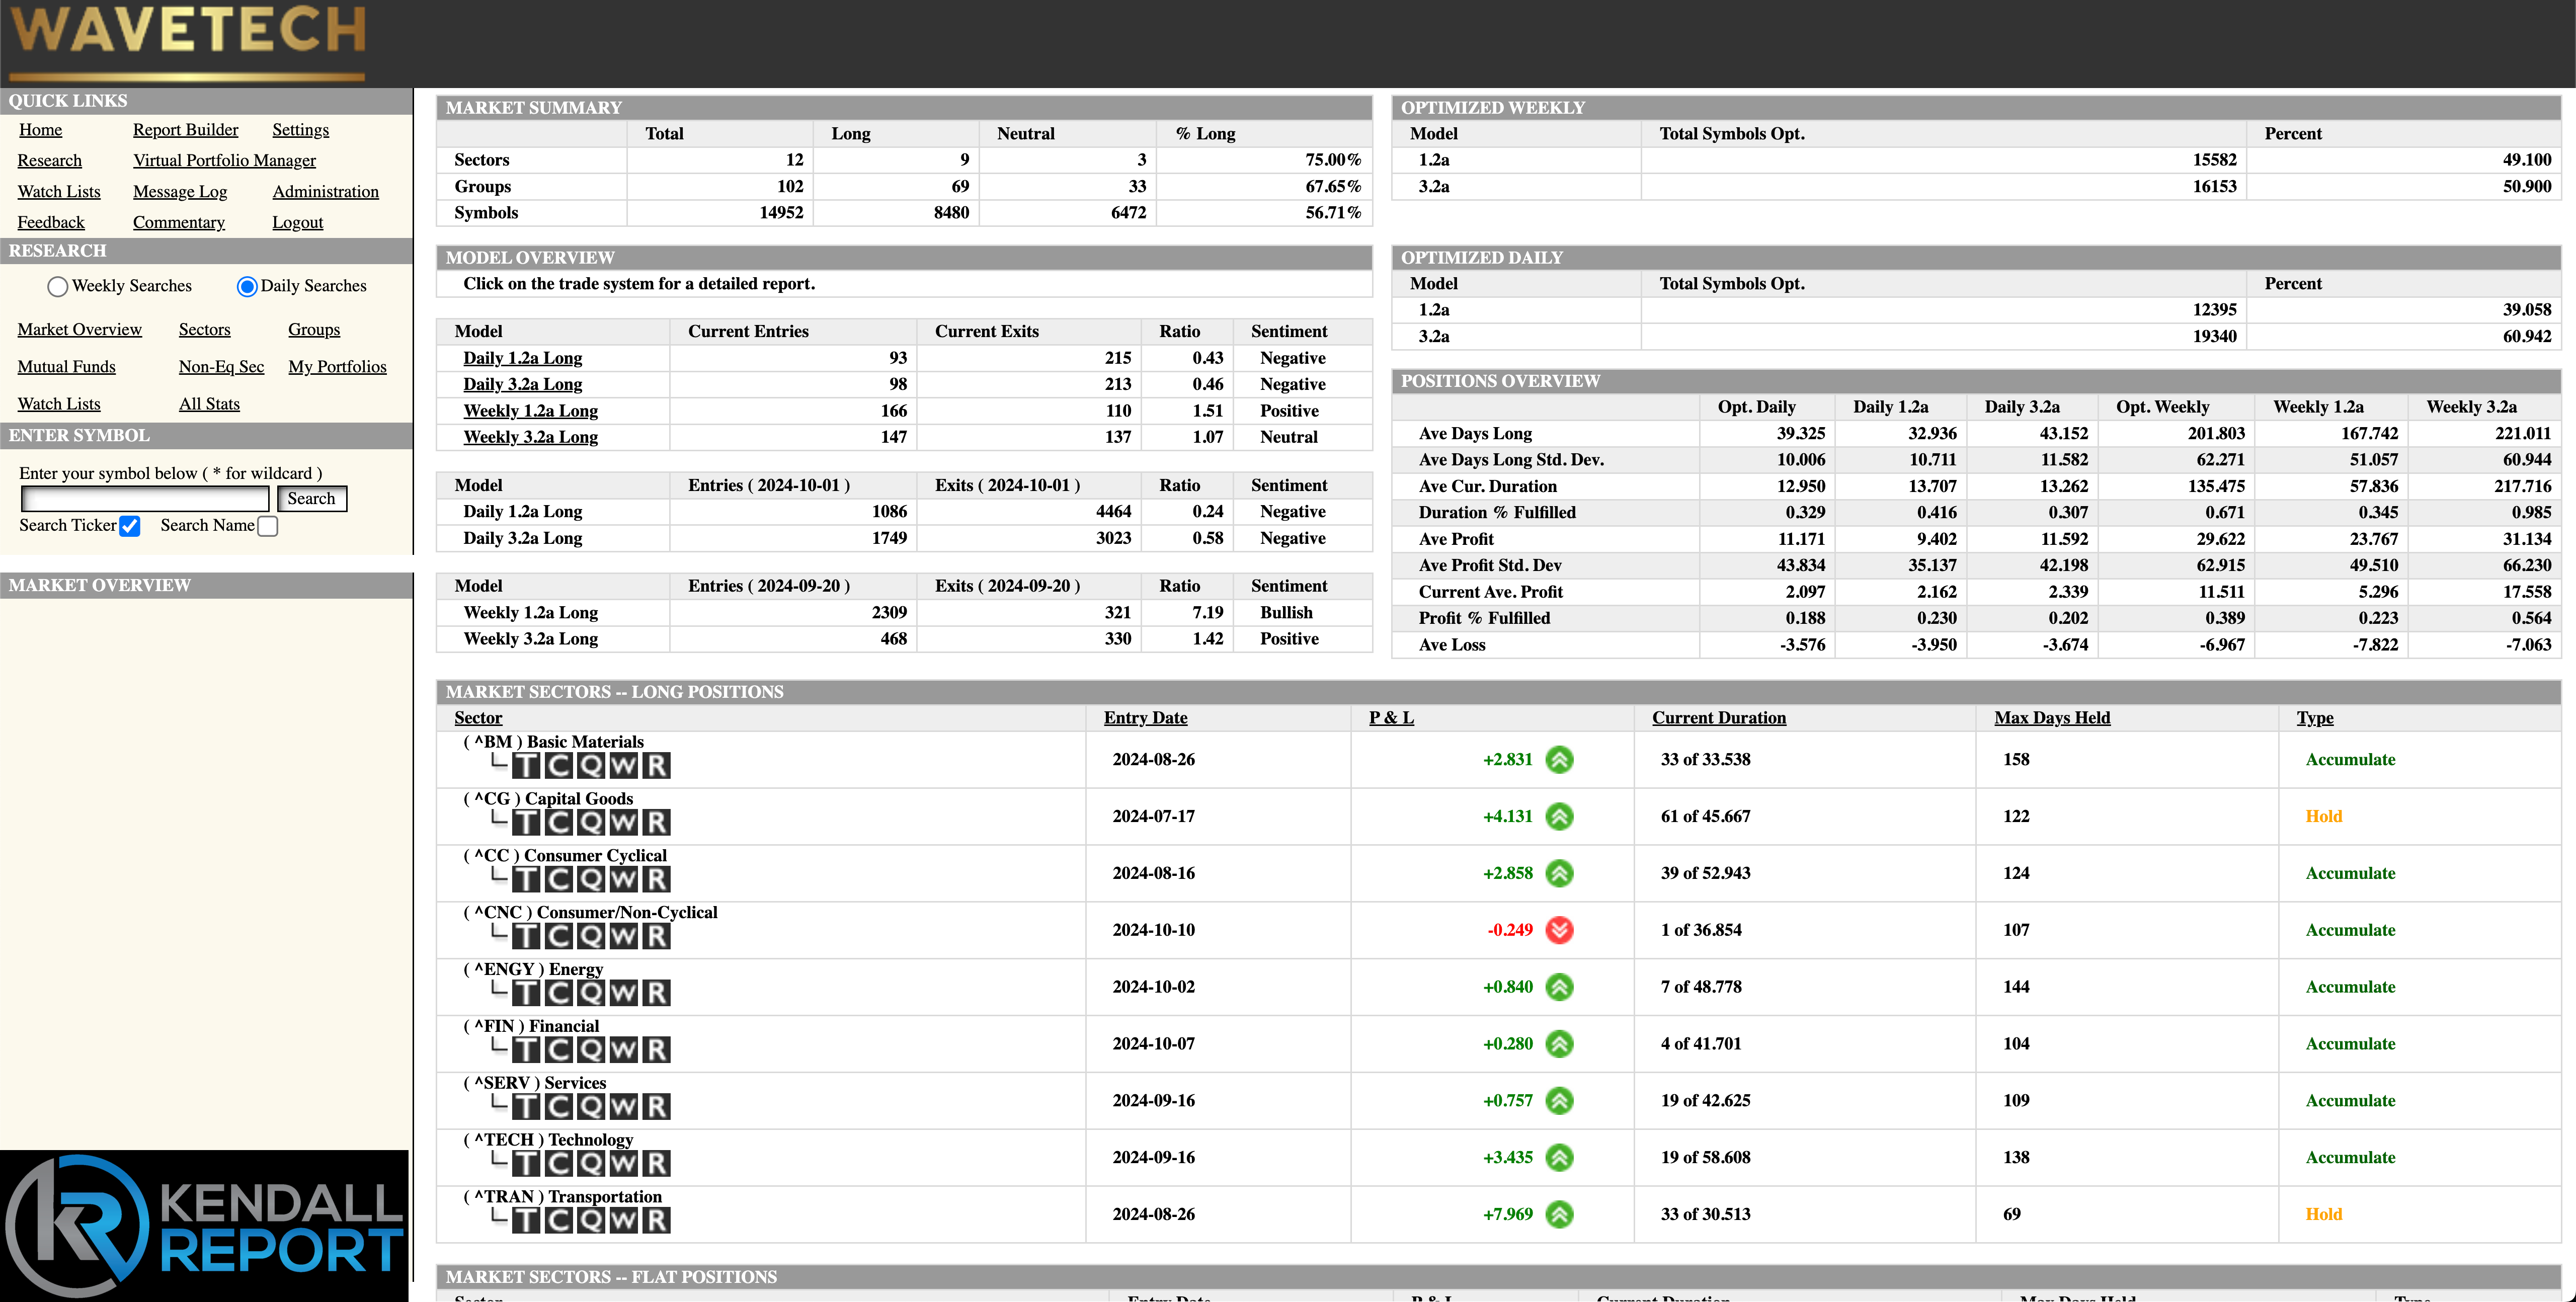
My analysis provides a nuanced perspective on current market dynamics, focusing on short-term trends and potential future directions. The daily database is experiencing some attrition on a short-term level, with 428 exits compared to only 191 new entries. This imbalance has pushed the bullish percentage down to 56.71%. While this represents a decline, it's important to note that this figure still falls within the expected range.
The next significant target range to watch is between 52% and 48%. The current expectation is gradual attrition rather than sudden, dramatic shifts. This aligns with the observed softening trend unfolding in the background. It's crucial to recognize that this pattern of gradual softening has been observed before. Previously, such patterns had manifested as sideways or slightly downward movements before the market ultimately rendered new all-time highs. This historical context suggests that the current softening doesn't necessarily predict a significant downturn.
Despite the attrition, the numbers are still showing robustness as we approach the end of the week. This indicates a resilient market that's maintaining strength even in the face of some selling pressure. As we look ahead to the weekly model run, there are no major expectations for significant changes. The bullish percentage on the weekly models remains above 80%, which is a strong position. However, this high-level leaves room for potential rotation or selling.
Over the past three months, the intermediate database has been completely refreshed, resulting in a robust configuration that will likely continue. The bullish percentage must stay within the 68% to 72% range to maintain the intermediate trends. There don't appear to be any excesses in the market that would raise immediate concerns. However, the analysis promises to cover any potential "cracks in the armor" should they begin to appear.
The market's ability to maintain robustness even as the short-term database shows attrition is a sign of underlying strength. This suggests that while short-term selling or profit-taking may exist, the broader market sentiment remains positive. The expectation of gradual attrition rather than sudden drops aligns with a market digesting gains and potentially consolidating before further moves. Depending on other factors, this behavior often precedes either a resumption of the uptrend or a more significant correction.
The mention of similar patterns leading to new highs in the past is significant. It suggests that current market behavior while showing some weakness, doesn't necessarily indicate an impending major correction. Instead, it could be setting the stage for another leg up. The robust configuration of the intermediate database, coupled with the target range of 68-72% to maintain trends, provides a framework for assessing market health. The intermediate-term uptrend remains intact as long as the bullish percentage stays within this range.
While the current analysis doesn't show any excesses or major concerns, the promise to monitor for any "cracks in the armor" is crucial. Markets can change quickly, and being alert to early signs of trend changes is vital for effective risk management.
In conclusion, the WaveTech Database analysis paints a picture of a market experiencing short-term softening but maintaining overall strength, especially in intermediate trends. The gradual nature of the current attrition, combined with historical patterns and the absence of excesses, suggests a market more likely consolidating than on the brink of a significant reversal. However, monitoring these trends, especially the bullish percentages in both short-term and intermediate databases will be crucial for identifying significant market dynamics shifts.
S&P 500 Futures
The market analysis reveals several important elements that suggest a potential shift in the current trend. The Price Pressure Momentum indicators #2 and #3 have crossed through their first derivatives, often a precursor to a change in market direction. This crossover points towards a likely test of the 5763 level, a significant support point that coincides with the 21-day moving average.
